

Abstract
Background:
No study has compared pharmacologic properties of ticagrelor and clopidogrel in non-dialysis patients with stage 4 – 5 chronic kidney disease (CKD).
Methods:
We conducted a double-blind RCT to compare effects of ticagrelor and clopidogrel in 48 CKD, with the primary outcome of ADP-induced platelet aggregation (WBPA) after 2 weeks of DAPT. In a parallel arm, we compared effects of 2 weeks of ticagrelor plus aspirin on mean changes in WBPA and markers of thromboinflammation among non-CKD controls (n=26) with that of CKD in the ticagrelor-arm.
Results:
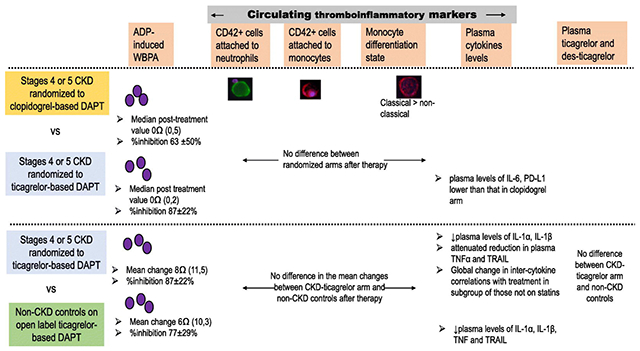
Average age of CKD was 53.7 years, with 62% women, 54% African American, and 42% with stage 5 CKD. Ticagrelor generated statistically lower WBPA values post treatment [median 0 Ω (IQR 0, 2)] vs. clopidogrel [median 0Ω (IQR 0, 5)] (P=0.002); percent inhibition of WBPA was greater (87 ± 22% vs. 63 ± 50%; P=0.04; and plasma IL-6 levels were much lower (8.42 ±1.73 pg/ml vs. 18.48 ±26.56 pg/ml; P=0.04); No differences in mean changes in WBPA between CKD-ticagrelor and control groups were observed. Ticagrelor- DAPT reduced levels of IL-1α and IL-1β in CKD-ticagrelor and control groups, attenuated lowering of TNFα and TRAIL levels in CKD-ticagrelor (vs controls), and had global changes in correlation between various cytokines in a subgroup of CKD-ticagrelor subjects not on statins (n=10). Peak/trough levels of ticagrelor/metabolite were not different between CKD-ticagrelor and control groups.
Conclusions:
We report significant differences in platelet aggregation and anti-inflammatory properties between ticagrelor- and clopidogrel-based DAPT in non-dialysis people with stage 4-5 CKD. These notable inflammatory responses suggest ticagrelor-based DAPT might lower inflammatory burden of asymptomatic patients with stage 4 or 5 CKD. (clinicaltrials.gov # NCT03649711)
Keywords: platelets, chronic kidney disease, ticagrelor, clopidogrel, inflammation
Graphical Abstract
INTRODUCTION
Ticagrelor has the most desirable pharmacological properties among the oral P2Y12 inhibitors.1 The Platelet Inhibition and Patient Outcomes (PLATO) trial reported that in the subgroup with glomerular filtration rate (GFR) <30 ml/min/1.73 m2 (n=214), use of ticagrelor was associated with a 23% reduction in mortality and ischemic events.1 Ticagrelor use was also associated with reduced sepsis-related death in 2 observational studies.2,3 However, there were only 15 individuals with GFR of ≤15 ml/min/1.73 m2 (not on dialysis) included in the PLATO trial.4 Recent post-marketing observational studies failed to demonstrate benefits of ticagrelor over clopidogrel in reducing thrombotic events among CKD patients with GFR ≤15 ml/min/1.73 m2.5–9 To date, there is a lack of mechanistic data to dissect the antiplatelet effects of ticagrelor vs. clopidogrel among patients with stages 4-5 CKD (GFR <30 ml/min/1.73 m2). Studies exploring the antiplatelet effects of ticagrelor in CKD have been limited by the lack of a control arm,10 high dropout rates,11 or failure to enroll participants with stages 4-5 CKD.12–17
The pharmacological characteristics of ticagrelor and clopidogrel may differ between individuals without kidney disease or with stages 1-3 CKD (GFR >60 ml/min/1.73 m2) and patients with more severe stages 4-5 CKD (<30 ml/min/1.73 m2).18–20 Alterations in the hemostatic pathway in patients with stages 4-5 CKD make it difficult to extrapolate mechanistic data to this population.18–20 First, as CKD progresses, the ability of platelet surface receptors to undergo conformational changes upon activation may be impaired.21 Ticagrelor binds reversibly to a site on the platelet P2Y12 receptor distant from the ADP-binding site and blocks ADP binding to the receptor via allosteric modulation.22 Binding of ticagrelor and consequent allosteric modulation of the receptor may be altered in the CKD milieu.23 Second, ADP-induced platelet aggregation may be higher in stages 4-5 CKD and may not be inhibited completely by a P2Y12 antagonists.19 Finally, elevated levels of circulating cytokines in CKD patients may alter drug absorption (peak drug levels) or metabolism (trough drug levels) based on severity of CKD.24 To date, no randomized controlled trial (RCT) has been conducted to compare the antiplatelet effects of ticagrelor and clopidogrel in people with stages 4-5 CKD, and no controlled studies have compared the pharmacologic properties of ticagrelor between people with stages 4-5 CKD or without CKD. Therefore, we performed a mechanistic, double-blind RCT to investigate the efficacy of ticagrelor and clopidogrel in inhibiting platelet aggregation in patients with stages 4-5 CKD. We also investigated the effect of ticagrelor on mean changes in platelet aggregation in patients with stages 4-5 CKD compared to the frequency-matched non-CKD controls. Finally, we explored mechanisms underlying the effects of ticagrelor in patients with stages 4-5 CKD by measuring changes in circulating platelet–leukocyte aggregates, differentiation state of monocytes, cytokine levels, and drug/metabolite levels.
METHODS AND MEASUREMENTS
Study design
The Chronic Kidney Disease (CKD-Platelet) study is a prospective double-blind, parallel-design, RCT (clinicaltrials.gov # NCT03649711) comparing the effects of ticagrelor and clopidogrel on platelet activation, aggregation, and inflammation in 48 CKD outpatients who were asymptomatic for cardiovascular diseases (i.e., not having experienced thrombotic events). Institutional Review Board approvals were obtained and participants gave written informed consent prior to participation. CKD subjects were randomized in a double-blind manner to receive ticagrelor 90 mg orally twice daily or clopidogrel 75 mg orally in the morning and a matching placebo at night for two weeks. All participants also received aspirin 81 mg/day for two weeks. In a parallel open-label, fixed-dose, controlled study, 26 non-CKD controls were recruited and matched with the CKD participants for sex, body mass index within 5 kg/m2 and decade of age. Visits for controls were similar to CKD participants except for randomization and blinding. Non-CKD controls were dispensed aspirin (81 mg/day) and open-label ticagrelor (90 mg twice daily) for 2 weeks.
Sample size and power calculations
For power calculations, measurements of platelet aggregation in CKD patients at baseline and after treatment with clopidogrel, values from previously published work were used (CKD at baseline: 11.32 Ω, SD=5.14 and CKD after clopidogrel treatment: 6.88Ω, SD= 5.95Ω).19,25 Because phase I and II studies of ticagrelor in non-CKD patients reported a 75% decrease in ADP-induced platelet aggregation,26,27 the mean post-ticagrelor treatment platelet aggregation value was calculated to be 2.83 Ω (75% drop from 11.32Ω) for CKD, implying a mean difference of 4.05 Ω (6.88–2.83) in post-treatment platelet aggregation values between ticagrelor and clopidogrel groups. Additional statistics, such as the R-squared value of baseline platelet aggregation accounting for the adjustment for presence of diabetes mellitus (R2=0.25) and the common within-group SD of 5.56, were taken from previously published work.19,25 On the basis of these assumptions, a total sample of 48 CKD participants (24 per arm) provides 81.40% power to detect a mean difference of 4.05 Ω with the use of an ANCOVA F test at a significance level of 0.05 (NCSS Pass 20).
Inclusion and Exclusion criteria
Inclusion criteria for the non-CKD controls were GFR ≥60 ml/min/1.73 m2, urine albumin-to-creatinine ratio (UACR) <30 mg/g, and no known kidney disease. Inclusion criteria for CKD patients were GFR <30 ml/min/1.73 m2 for at least 3 months (calculated with the CKD-EPI equation).28 Exclusion criteria for both groups were lack of health care power of attorney to sign informed consent, unwillingness or inability to participate, pregnancy, acute kidney injury, kidney transplant or any other solid organ transplant recipient, end-stage kidney disease treated with maintenance dialysis (peritoneal or hemodialysis), nephrotic syndrome (defined as nephrotic-range proteinuria, hypoalbuminemia, hyperlipidemia, and generalized edema), recent hospitalization or surgery <3 months, acute coronary or cerebrovascular event in the preceding 12 months, blood dyscrasias, active bleeding, bleeding diathesis, gastrointestinal bleeding in the last 6 months, concomitant use of antiplatelet agents other than aspirin or antithrombotic agents, treatment within 30 days with a glycoprotein IIb/IIIa antagonist, hematocrit <25%, white blood cell count >20,000/μl, platelet count <50,000/μl, or any active malignancy or liver disease.
Recruitment
We recruited asymptomatic outpatients with CKD from renal clinics at the University of Arkansas for Medical Sciences ([UAMS] protocol # 227997) and the Central Arkansas Veterans Affairs Hospital ([VA] protocol # 1241997), Little Rock, Arkansas, from November 1, 2018, through August 19, 2021. Controls were recruited using the data from the UAMS Translational Research Institute Research Participant Registry. People who signed up to be part of the Arkansas Research volunteer database were contacted via emails. Those who responded to the emails were pre-screened by telephone using an IRB-approved transcript, and subsequently scheduled for informed consent and study visits.
Study visits and measurements
Screening visit:
Patients with CKD were prescreened prior to their routine visits to renal clinics, and invited to participate and sign informed consent at a study screening visit when demographic and clinical variables were collected, along with information on concomitant medications and comorbidities. Routine blood laboratory data were collected to ensure individuals met inclusion/exclusion criteria. In women of childbearing potential, urine pregnancy test was also performed. Those on aspirin for primary prevention of cardiovascular disease, or those taking nonsteroidal anti-inflammatory drugs were asked to discontinue use for 2 weeks prior to baseline visit. During the COVID-19 pandemic, this visit was amended to a tele-visit for controls while CKD patients underwent the screening visit during their regular renal clinic appointments. Blood work and urine tests for this visit were deferred to the baseline visit during the pandemic to minimize contact time with the study participants. Recruitment at the VA site was stopped during the pandemic.
Baseline visit:
Medication lists were reviewed, and study staff confirmed that participants were not consuming non-steroidal anti-inflammatory drugs. Blood was collected for complete blood count (CBC) and whole-blood platelet aggregation induced with various agonists (0.5 mM arachidonic acid, 2 μg/mL collagen, 20 μM ADP, or 1 mg/mL ristocetin) and measured using a Chrono-log aggregometer (Chrono-log Corporation Model 500, Havertown, PA 19083, USA). Expression of platelet surface receptors (P-selectin, P2Y12, Glycoprotein IIb/IIIa, and Glycoprotein Ib) and platelet–leukocyte aggregates were measured with a BD LSRFortessa flow cytometer (see detailed protocol in Supplementary Table 1). Thromboinflammatory markers including differentiation state of monocytes, and platelet–leukocyte aggregates were quantified with FlowJo software (TreeStar) by counting platelets (CD42b+) adherent to neutrophils (CD14−/CD16+/CD66b+) and monocytes (CD14+/CD66b) in whole blood. Levels of multiple cytokines were determined with the Bio-techne Human XL Cytokine Luminex® Performance Assay 45-Plex Fixed Panel (catalog # LKTM014).
Randomization of CKD participants:
CKD participants were randomized in a double-blind manner at the baseline visit to receive either 2 weeks of ticagrelor (90 mg twice daily) or clopidogrel (75 mg/day in the morning, plus a matching placebo once daily at night). Stratified randomization was used to ensure balance between the 2 treatments in the strata defined by diabetic status and was performed by a research pharmacist. To minimize imbalances in treatment allocation and to maximize power, a computerized random number generator was used to create a blocked randomization list separately for diabetic and non-diabetic strata. Block size and variable for each stratum were determined by the statistician and revealed to the research pharmacist but not to the research personnel. All study pills were placed in larger identical capsules to conceal allocation. The matching placebo was compacted by the research pharmacist to conceal the frequency of dosing for clopidogrel. All CKD patients received concomitant therapy with aspirin (81 mg/day). Non-CKD controls were dispensed dual antiplatelet therapy (DAPT) consisting of aspirin (81 mg/day) and open-label ticagrelor (90 mg twice daily) for 2 weeks. All participants received phone calls mid-treatment (one week on study drugs) to confirm adherence and record any side effects. We also continued to confirm that the participants were not taking non-steroidal anti-inflammatory drugs or other supplements during the phone call.
Final visit (2 weeks after randomization):
Physical exam was performed at this visit including vitals, height and weight. Pill count was performed to confirm adherence. Adverse events were noted. All blood tests performed at the baseline visit were repeated for each study participant. In addition, samples were collected for trough levels of ticagrelor and its metabolite, des ticagrelor (AR-C124910XX), 12 hours after the last dose of the study drug.29 Subsequently, all participants were administered the study drug and blood was re-drawn for peak drug/metabolite levels 3 hours later. During the COVID-19 pandemic, all participants were screened for COVID symptoms before coming to study visits. Once the study completed enrollment, and unblinding occurred, frozen samples were measured for peak and trough blood levels of ticagrelor and its metabolite using multiple reaction monitoring liquid chromatography mass spectrometry (LCMS) in a subgroup of CKD participants randomized to the ticagrelor arm, and all non-CKD controls (see detailed protocol in Supplementary Table 2).29
Outcome measure
The primary outcome measure in CKD subjects randomized to ticagrelor or clopidogrel was post-treatment platelet aggregation value induced by 20 μM ADP (expressed in ohms, Ω) in participants with stages 4-5 CKD administered ticagrelor or clopidogrel. The secondary outcome measure was percent inhibition of ADP-induced platelet aggregation (IPA), defined as [(baseline aggregation value–post-treatment aggregation value) / (baseline aggregation value)].
To compare ticagrelor treatment effect between CKD-ticagrelor and non-CKD control subjects, the secondary outcome variable was the difference in the mean change in ADP-induced platelet aggregation between treatment and baseline. Markers of thromboinflammation, adverse events, and levels of the drug/metabolite and cytokines were also included as secondary outcomes.
Statistical analysis
Summary statistics were used to describe the distribution of the data. Continuous variables were reported using mean and standard deviation when they were normally distributed, and, using median and interquartile range when they had skewed distributions. Categorical variables were reported using frequency counts and percentages. Post-treatment ADP-induced platelet aggregation value in ohms (Ω) was the primary outcome variable to compare the effect of drugs (ticagrelor vs. clopidogrel) in participants with CKD. An analysis of covariance (ANCOVA) model was used to compare the treatment effects where the primary outcome variable was modeled as the dependent variable, and baseline measurement of platelet aggregation, diabetic status (1: diabetics; 0: non-diabetics), and a binary treatment variable (1: ticagrelor arm; 0: clopidogrel arm) were included as independent variables. In cases of missing data, we performed complete case analysis. The secondary outcome variables were compared using ANCOVA for comparing differences between CKD in the two randomized arms. Univariate analysis was done using Wilcoxon rank sum test adjusted for multiple comparisons (Bonferonni method) for comparing differences between CKD-ticagrelor arm, and the non-CKD controls. Paired t-test or Wilcoxon signed rank test was used to compare the before and after treatment differences within CKD-ticagrelor, and non-CKD control groups. Analyses were performed with SAS version 9.4 (SAS Institute, Cary, NC) and statistical significance was set at 5%.
Data analysis for the cytokine measurements were also performed using the R language to create better visualization of baseline levels, and also of the global changes occurring on therapy.30 The measurements from a set of cytokines were analyzed using the Gene Sets Net Correlations Analysis (GSNCA) method as implemented in the Bioconductor package GSAR.31,32 This nonparametric statistical method tests the hypothesis that the inter-cytokine correlations for the set of cytokines are significantly different before and after therapy, and estimates significance (p-value) using sample permutation approach. Although this method was originally proposed for the analysis of a set of gene expression profiles, it is equally applicable to any set of measurements regardless of their dynamic ranges (i.e., normalization is not required). This method helps us visualize complex changes occurring in the inflammatory pathways. This method assigns each cytokine a weight factor that is proportional to its correlations with the rest of the cytokines. The weight factors are centered around 1, and cytokines that change in similar patterns across subjects show values larger than 1, while cytokines that change in random patterns show values smaller than 1. The weight factors reveal hub cytokines that may directly or indirectly influence other cytokines. Visual network representations of the change in inter-cytokine correlations before and after therapy for specific groups of subjects were generated using package GSAR. The network is formed by the union of the first and second order minimum spanning trees (MSTs). Influential cytokines tend to occupy a central position in the network with dense links to other cytokines, while cytokines with low correlations with other members in the set tend to occupy a peripheral position in the network with sparse links to other cytokines.
RESULTS
In this mechanistic, double-blind RCT, we investigated the efficacy of ticagrelor and clopidogrel in inhibiting ADP-induced platelet aggregation in CKD patients. Supplementary Figure S1 illustrates how the cohort was derived. None of the participants were on dialysis, and nearly half of the CKD participants had stage 5 CKD, with mean GFR in the ticagrelor arm of 16.7 ml/min/1.73 m2 (SD=6.5) and mean GFR in the clopidogrel arm of 16.4 ml/min/1.73 m2 (SD=5.7). Baseline characteristics were comparable between the CKD participants randomized to each drug arm (Table S3). The overall CKD sample consisted of 62% women and 54% African American individuals. Individuals in the non-CKD control arm were recruited with the goal to frequency-match for decade of age, sex and BMI within 5 kg/m2 with the CKD participants in the ticagrelor arm. Table S3 illustrates that these three characteristics were balanced between the CKD-ticagrelor arm, and the non-CKD controls.
Aspirin effect
All participants (CKD and controls) responded to aspirin 81 mg/day, as demonstrated by inhibition of arachidonic acid-induced platelet aggregation (Figure 1, Panel A).
Figure 1.
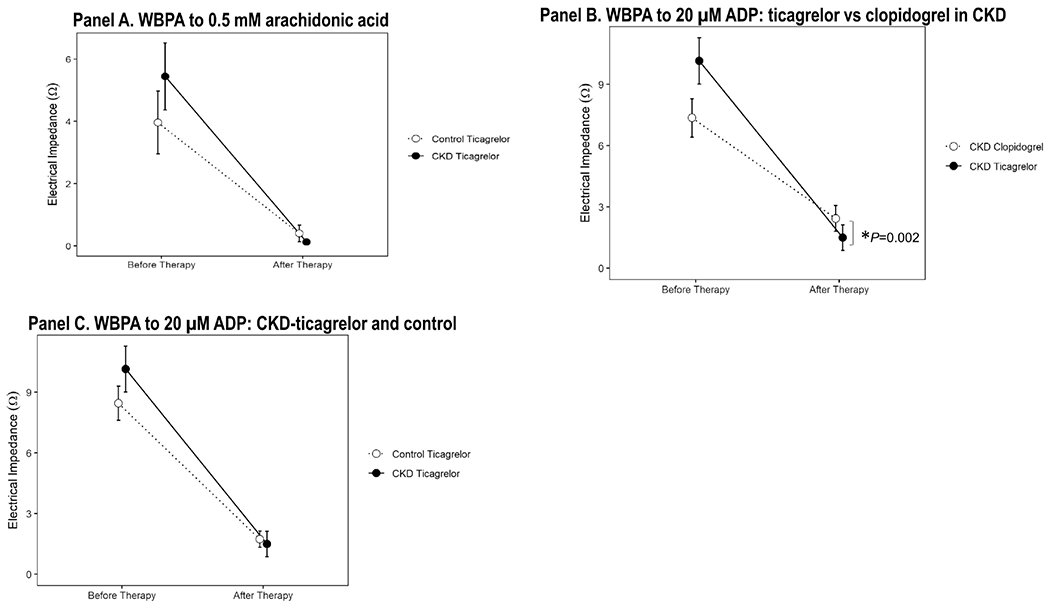
A. Whole-blood platelet aggregation (WBPA) induced with 0.5 mM arachidonic acid in samples from patients with stages 4-5 CKD (closed circle) and non-CKD controls (open circle) at baseline and after 2 weeks of treatment with aspirin 81 mg/d and ticagrelor 90 mg twice daily. B. WBPA induced with 20 μM ADP in samples from participants as described in *ticagrelor vs. clopidogrel, ANCOVA P=0.002 represents significant vertical distance after adjusting for diabetes and baseline ADP values. C. WBPA induced with 20 μM ADP in samples from patients with stages 4-5 CKD randomized to the ticagrelor arm (closed circle) and non-CKD controls (open circle) at baseline and after 2 weeks of treatment with aspirin 81 mg/d and ticagrelor 90 mg twice daily. Data are presented as the mean ± standard deviation.
P2Y12 inhibition
The primary outcome variable of post-treatment ADP-induced platelet aggregation was lower in CKD subjects randomized to receive ticagrelor treatment [median 0 Ω (IQR 0, 2)] vs. clopidogrel treatment [median 0Ω (IQR 0, 5)] and remained statistically significant after adjusting for the presence of diabetes mellitus and baseline values of ADP-induced platelet aggregation, ANCOVA P=0.002 represents significant vertical distance in Figure 1, Panel B. Ticagrelor resulted in a greater percent inhibition of ADP-induced platelet aggregation ([IPA]= 87%, SD=22) than did clopidogrel (IPA=63%, SD=50; P=0.04). Ticagrelor was particularly superior to clopidogrel in inhibiting ADP-induced platelet aggregation in CKD subgroup with GFR <16 ml/min/1.73m2 (Figure 2 Panels A-B) but not in those with GFR ≥16 ml/min/1.73m2. When comparing the performance of ticagrelor between CKD-ticagrelor and non-CKD groups, there were no differences in the mean change in ADP-induced platelet aggregation between groups on ticagrelor therapy (Figure 1, Panel C) or, in their percent inhibition of ADP-induced platelet aggregation, IPA in CKD 87% (SD= 22) vs. IPA in controls 77% (SD= 29), P=0.14.
Figure 2.
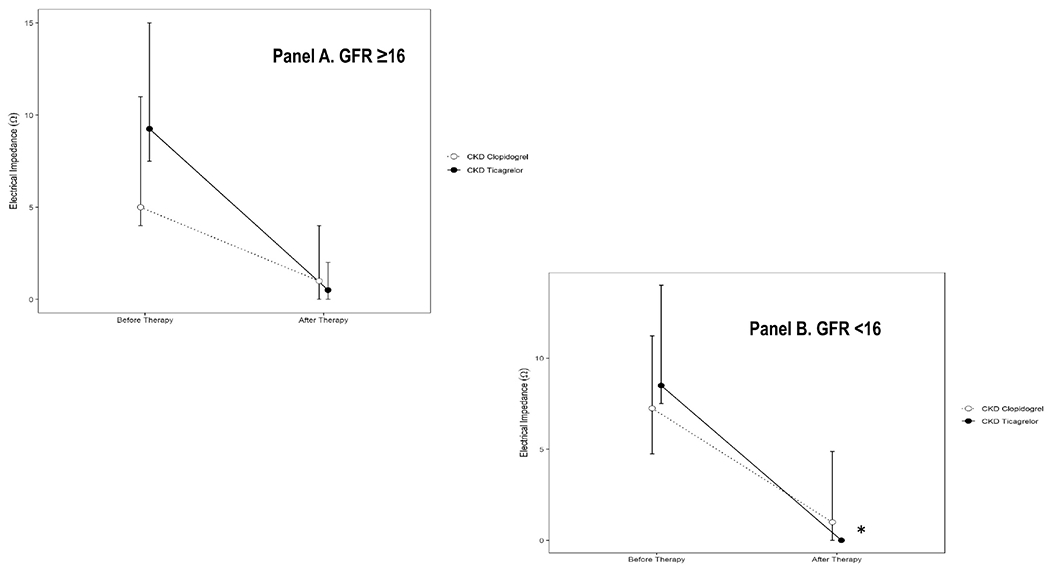
Whole-blood platelet aggregation (WBPA) induced with 20 μM ADP in subgroup of CKD participants with glomerular filtration rate (GFR) A. ≥16 ml/min/1.73m2 and B. *<16 ml/min/1.73m2 randomized to receive ticagrelor (closed circle) vs. clopidogrel (open circle). Data are presented as the mean ± standard deviation.
Other platelet markers
The post-treatment values of platelet aggregation induced by collagen or ristocetin as well as platelet surface expression of GPIb, GPIIb/IIa, P2Y12, and P-selectin were not different between CKD-ticagrelor arm, and the non-CKD controls on ticagrelor-based DAPT (Supplementary Table 4). Similarly, there were no differences in the mean changes in these values on-treatment between CKD-ticagrelor arm, and non-CKD controls on ticagrelor-based DAPT (Supplementary Table 4).
Thrombo-inflammatory markers
Post-treatment, plasma IL-6 levels were lower in the CKD group randomized to the ticagrelor arm compared to the clopidogrel arm, P=0.04 (Figure 3, Panel A). Similarly, PD-L1 was also lower in the CKD-ticagrelor arm. Plasma levels of several other cytokine post treatment were not different between the two randomized arms of CKD people (Figure 3, Panels B-E). Two weeks of ticagrelor-based DAPT resulted in significant lowering of IL-1α and IL-1β levels in both the CKD-ticagrelor, and the non-CKD control groups, all P<0.05 (Figure 4, Panels A-B). However, ticagrelor-based DAPT decreased levels of TNFα and TRAIL in the non-CKD control group but not in the CKD-ticagrelor group (Figure 4, Panels C-D). Mean change in TRAIL levels after treatment was 13.53 (1, 31.18) pg/mL in the non-CKD control arm vs. 3.08 (−18.03, 21.62) pg/mL in the CKD-ticagrelor arm, P=0.09. Finally, there were no differences in levels of IL-6 or IL-1RA before or after ticagrelor treatment in the CKD-ticagrelor or non-CKD control groups (Supplementary Figure S3).
Figure 3.
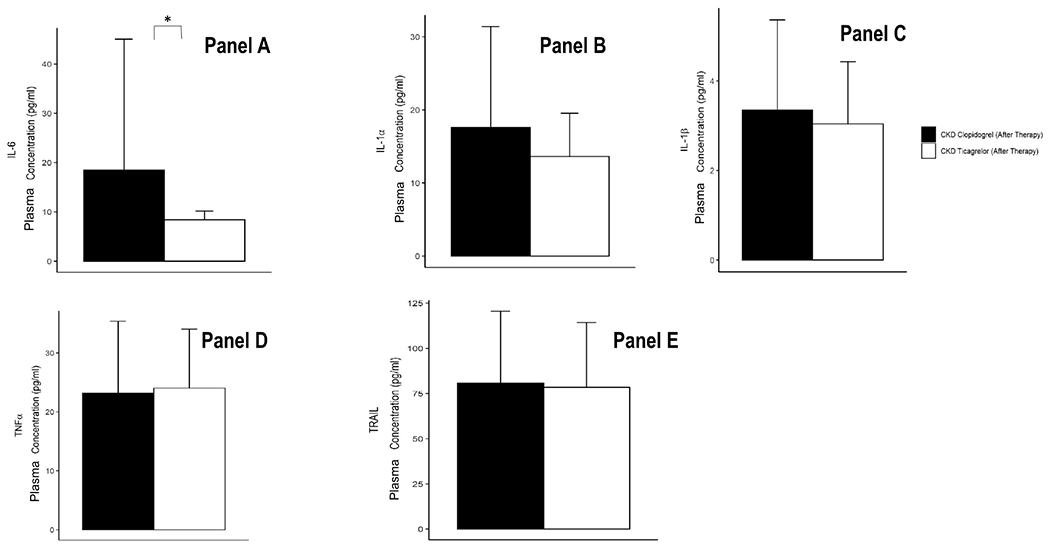
Levels of A. IL-6, B. IL-1α, C. IL-1β, D. TNF-α, and E. TRAIL in plasma from patients with stages 4-5 CKD randomized to the ticagrelor arm, and clopidogrel arm after therapy with aspirin 81 mg/d and ticagrelor 90 mg twice daily. Cytokine concentrations measured with Luminex® assays and expressed in pg/ml. Data are presented as the mean ± standard deviation. P value calculated with a non-parametric test after adjusting for multiple comparisons with the Bonferroni method (*P<0.05).
Figure 4.
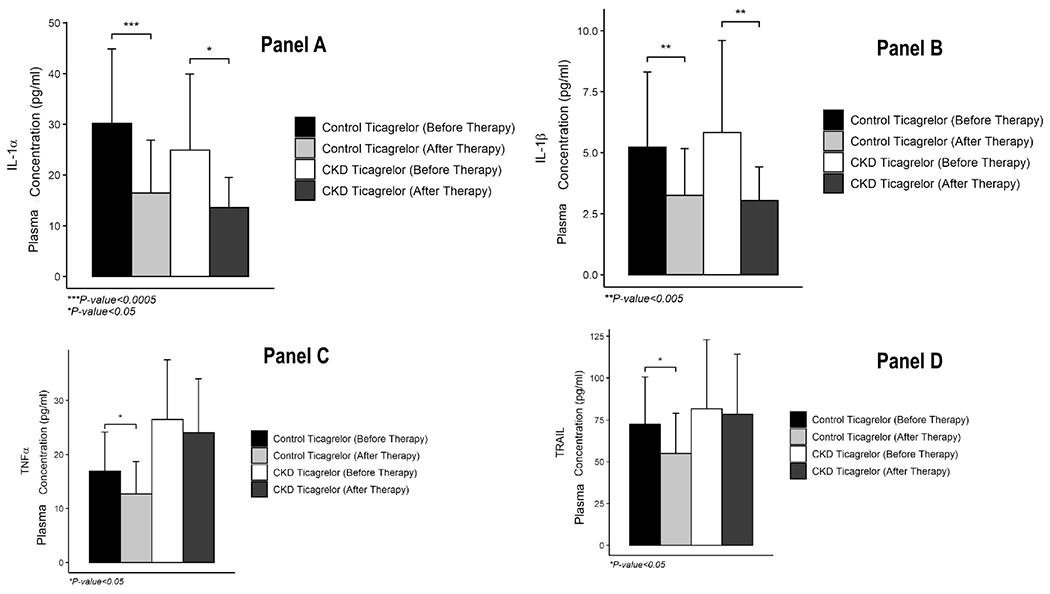
Levels of A. IL-1α, B. IL-1β, C. TNF-α, and D. TRAIL in plasma from patients with stages 4-5 CKD randomized to the ticagrelor arm, and non-CKD controls (normal kidney function without proteinuria) before and after therapy with aspirin 81 mg/d and ticagrelor 90 mg twice daily. Cytokine concentrations measured with Luminex® assays and expressed in pg/ml. Data are presented as the mean ± standard deviation. P value calculated with a paired t-test or paired rank sum test. There were no between-group differences in the 4 analytes before or after therapy after adjusting for multiple comparisons with the Bonferroni method (all P>0.05).
The percent neutrophils and monocytes with attached platelets (Supplementary Figure S2 Panel A and Supplementary Table 5) and the monocyte differentiation state (Supplementary Figure S2 Panel B) was not different in CKD patients randomized to ticagrelor or clopidogrel. After two weeks of aspirin and ticagrelor, no difference was observed between the CKD-ticagrelor arm and the non-CKD control arm in the percent of neutrophils (CKD= median 32% [IQR 29%, 40%] and controls= median 32% [IQR 25%, 36%]) and monocytes (CKD= median 30% [IQR 24%, 40%] and non-CKD controls= median 33% [IQR 21%, 35%]) with attached platelets (all P>0.05; Supplementary Figure S2 Panel C, and Supplementary Table 4). Similarly, there were no differences in the differentiation state of monocytes on DAPT between CKD receiving ticagrelor, and non-CKD controls; all P>0.05 (Supplementary Figure S2 Panel D, and Supplementary Table 4).
The GSNCA test indicated a significant global change in inter-cytokine correlations with therapy in a subgroup of CKD-ticagrelor individuals who reported not to be on any statin therapy (n=10), P<0.05, Figure 5. Platelet-derived growth factor (PDGF) played a central role in tightly correlating with other cytokines before therapy in the CKD-ticagrelor arm (considered a hub), and its weight factor reduced after therapy, Figure 5. IL-1β was also tightly correlated various other cytokines, Figure 5.
Figure 5.
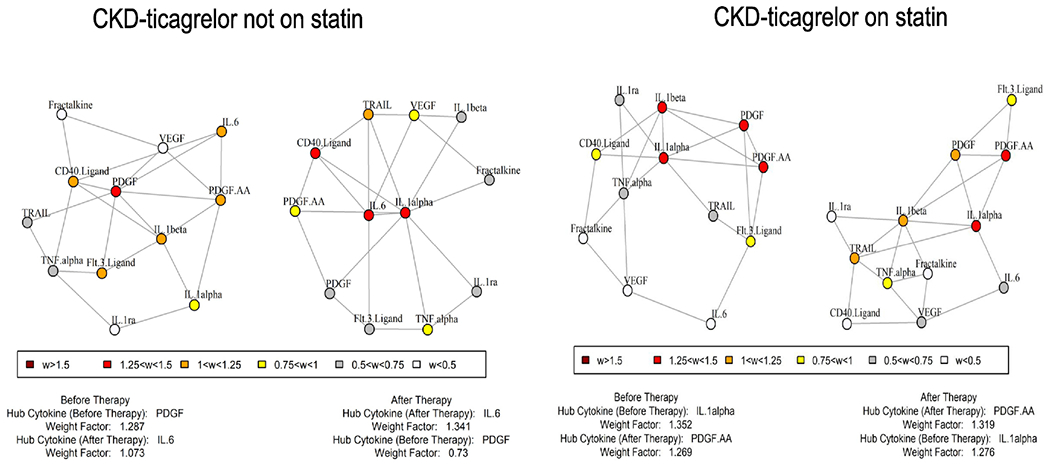
Gene Sets Net Correlations Analysis (GSNCA) representing CKD-ticagrelor arm not on statin co-therapy and, on statin co-therapy. There was a global change in correlation matrix of CKD-ticagrelor arm not on statin (P<0.05). PDGF and IL-1β were tightly correlated with several other cytokines.
Drug levels
There were no differences in the trough or peak levels of ticagrelor or des ticagrelor of CKD-ticagrelor patients and the non-CKD controls (Figure 6, Panels A and B).
Figure 6.
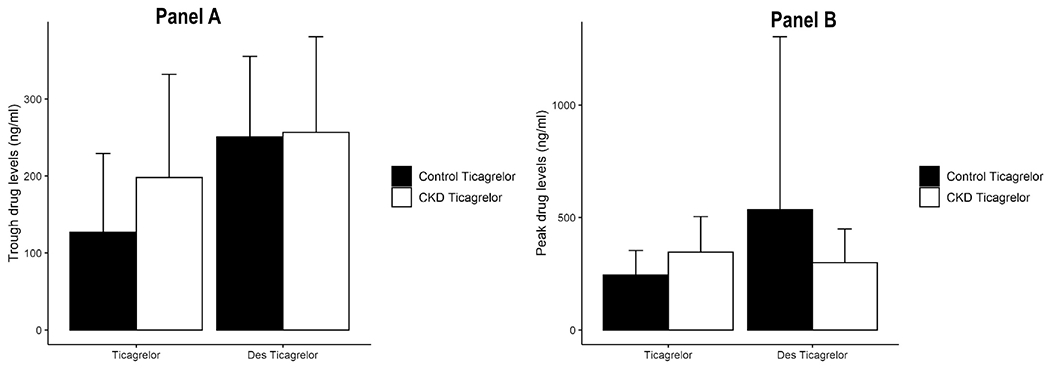
A. Trough (measured at the last visit, 12 h after the final evening dose of ticagrelor) and B. peak (measured 3 h after administration of ticagrelor at the last visit) plasma levels of ticagrelor or des-ticagrelor (AR-C124910XX) in CKD-ticagrelor arm, and non-CKD controls before and after therapy with aspirin 81 mg/d and ticagrelor 90 mg twice daily. Ticagrelor and des-ticagrelor concentrations measured with mass spectrometry and expressed in ng/ml. Data are presented as the mean ± standard deviation. Within-group differences in the before- and after-therapy levels were compared with a paired t-test; all P>0.05. There were no between-group differences in the peak and trough levels of ticagrelor or des-ticagrelor after adjusting for multiple comparisons with the Bonferroni method (all P>0.05).
Adverse events
In the CKD participants, 1 individual treated with clopidogrel developed an allergic rash that was attributed to clopidogrel, and 1 received kidney transplantation and withdrew from the study three days after randomization. Overall, in the CKD cohort, adverse events were minor with two weeks of DAPT (14 in the ticagrelor arm and 15 in the clopidogrel arm, P=0.85) and included bruising, dyspnea, dyspepsia, and fatigue (Supplementary Table 6A) but did not involve discontinuation of the study drug. These episodes resolved spontaneously. There were no differences in adverse events between CKD-ticagrelor and non-CKD control groups during the 2 weeks of DAPT (14 in the CKD arm and 13 in the non-CKD control arm, P=0.87), although there were numerically more patients experiencing dyspnea with ticagrelor (Supplementary Table 6B). One serious adverse event (event rate of 2%) occurred in a CKD participant related to hospital admission for symptomatic anemia requiring a blood transfusion.
DISCUSSION
In the current double-blind, mechanistic RCT, we demonstrated that ticagrelor reduced ADP-induced platelet aggregation more than clopidogrel among asymptomatic patients with stages 4-5 CKD even after adjusting for the presence of diabetes mellitus and baseline values of WBPA. Our findings provide mechanistic evidence for superior efficacy of ticagrelor over clopidogrel in this patient population, as seen in the subgroup analysis of the PLATO trial.1 In addition, ticagrelor-based DAPT reduced plasma IL-6 and PD-L1 levels much more than clopidogrel-based DAPT, and had other notable anti-inflammatory effects in asymptomatic patients with stages 4-5 CKD, such as a decrease in plasma IL-1α and IL–1β levels. This modulatory effect on inflammation in stages 4 or 5 CKD was heterogeneous and complex as evidenced by a significant global change in the shape of the correlation matrix of multiple inflammatory cytokines in CKD-ticagrelor individuals who were not on any statin therapy, and by an attenuated reduction in TNFα and TRAIL levels in CKD-ticagrelor arm vs. non-CKD controls. The sum of these results provides a potential mechanism how ticagrelor use may be associated with lower rates of lethal sepsis in CKD population as reported in recent observational studies.2,3 Our findings also suggest that ticagrelor-based DAPT might lower inflammatory burden observed in asymptomatic stages 4 or 5 CKD patients which has been recently linked to recurrent cardiovascular events in the CANTOS trial.
Our data demonstrate that ticagrelor is better than clopidogrel in achieving inhibition of platelet aggregation in patients with stages 4-5 CKD. Approximately two-thirds of ticagrelor is active after absorption.33 The remainder is metabolized by CYP3A4/5 to an active metabolite, des-ticagrelor (AR-C124910XX).33 Ticagrelor and des-ticagrelor reversibly block the binding of ADP to the P2Y12 receptor. On the other hand, clopidogrel is a pro-drug—85% is hydrolyzed to an inactive metabolite in the blood after absorption, and the remaining 15% is metabolized to 2-oxo-clopidogrel and subsequently to the active metabolite (R-130964), primarily by CYP2C19, before irreversibly blocking the binding of ADP to the platelet P2Y12 receptor.34 In the non-CKD population, this pharmacokinetic difference translates into greater antiplatelet effects for ticagrelor than clopidogrel, with reduced inter- and intra-individual variabilities.35–37 Patients with stages 4-5 CKD, a population with the most severe form of kidney disease not on dialysis, have a 4-fold higher risk of thrombotic cardiovascular events despite treatment with clopidogrel compared to the general population.38 In the subgroup of PLATO trial participants with GFR <30 ml/min/1.73 m2, use of ticagrelor over clopidogrel was associated with a 23% reduction in mortality and ischemic events.1 This double-blind randomized mechanistic RCT addresses limitations of previous studies10–17 by enrolling stages 4-5 CKD individuals with mean GFR of 16 ml/min/1.73m2 not on dialysis, including a control arm, minimizing drop-out rates, double-blinding and randomization of treatment allocation. Furthermore, the CKD patient population was diverse, including over 50% women and African Americans, attesting to effects of ticagrelor across sex and race.
In addition to better platelet inhibition, ticagrelor vs clopidogrel also generates better anti-inflammatory response in asymptomatic patients with stages 4-5 CKD. However, this response is complex, as indicated by decreases in pro-inflammatory plasma IL-1α and IL-1β in all CKD individuals, and a significant global change in the shape of correlation matrix of multiple cytokines in CKD individuals who were not on any statin therapy. Circulating platelets regulate inflammation as well as thrombosis.39,40 Studies performed in the last decade highlighted the role of these anucleated cells in modulating inflammation through their interaction with inflammatory cells in the circulation.41 Studies in animals demonstrated that platelet-depleting antibodies decreased the levels of pro-inflammatory cytokines in the plasma, with cytokine levels being restored by platelet transfusion.42 Ex vivo studies of human blood samples from healthy volunteers demonstrated that platelet inhibitors decreased plasma levels of cytokines.43 CKD is a proinflammatory state marked by increased levels of inflammatory markers in the plasma (e.g., IL-1α, TNF-α, and IL-6) that worsens with worsening CKD severity.24 Use of the more potent platelet inhibitors prasugrel and ticagrelor (vs. clopidogrel) has been associated with reductions in the rate of death from sepsis in recent observational studies of CKD patients.3 In this clinical trial, we observed that ticagrelor-based DAPT decreased levels of pro-inflammatory cytokines in the plasma of individuals with stages 4-5 CKD not on dialysis regardless of statin use, and a global change in inter-correlations of cytokines among subgroup of individuals not on statin co-therapy. Statin therapy reduces inflammation and may be able to confound some of the inflammatory responses of DAPT in CKD individuals.44 In summary, ticagrelor-based DAPT might be able to reduce inflammatory burden in select, if not all, asymptomatic stages 4 or 5 CKD individuals- a problem that remains complex in nature with no readily available clinical intervention for it.
In addition to the global changes in the correlation matrix of cytokines on ticagrelor-based DAPT in some CKD individuals, this treatment generated much less effect on plasma levels of TNFα and TRAIL in the CKD-ticagrelor group than in the non-CKD controls, and no effects on various other thromboinflammatory markers. The reason for the differential and heterogeneous effect is not known. We did note a correlation between plasma TNFα levels and mean platelet volume (r=0.30; P=0.01), which may indicate that younger, larger platelets have a ticagrelor-independent influence on TNFα. Shorter platelet half-life in circulation, platelet sequestration in the microvasculature, or inflammation-induced megakaryopoiesis could influence platelet production in patients with CKD. In mouse models of sepsis, platelets are sequestered in the microcirculation of the lungs and liver following interactions with circulating leukocytes—a phenomenon that culminates in microvascular occlusion and tissue damage, as well as a decrease in the mean platelet count and an increase in the mean platelet volume in the circulation.45 A similar platelet sequestering could be at play in patients with CKD and result in high platelet turnover.46,47 It is also possible that the inflammatory state of CKD is driving production of platelets by megakaryocytes. While an association between baseline plasma levels of proinflammatory cytokines with worse cardiorenal outcomes was previously reported,24,48 the clinical relevance of phenotyping patients with CKD based on the degree of decrease in levels of proinflammatory cytokines with antiplatelet therapeutics needs to be further investigated.
Our study has several limitations. First, although adequately powered to address the primary outcome, the sample size was not powered for secondary outcomes. The sample size was comparable to that of similar published43 and ongoing49 mechanistic studies in this patient population that tends to present recruitment challenges and historically has been excluded from larger RCT. Second, use of concomitant medications known to affect chronic inflammation, such as statins, could have confounded the effects noted in the study.44 Third, the specific P2Y12 inhibitors used could have exerted differential anti-inflammatory effects as reported in experimental studies of healthy human volunteers.43 Such intraclass differences between the P2Y12 inhibitors in CKD patients remain unclear. Fourth, aspirin alone could have contributed to the various characteristics of thromboinflammatory markers observed,50 as the effects of aspirin in CKD patients remain poorly defined. Fifth, inflammatory dysregulation in stages 4 or 5 CKD is complex with large inter-individual variabilities.24 Larger studies are required to adequately address this limitation. Finally, ticagrelor and clopidogrel are approved for use in the setting of acute myocardial infarction. Clopidogrel is also approved for use in chronic cardiovascular diseases. Our study participants were asymptomatic for cardiovascular diseases and would be considered off-label use of the drugs. Despite this limitation, our results are valid as CKD is commonly considered a coronary artery disease (CAD) equivalent regardless of the presence of CAD symptoms.51
In summary, this study demonstrates significant differences in platelet inhibition and inflammatory properties between ticagrelor and clopidogrel in asymptomatic non-dialysis people with stage 4-5 CKD, as well as additional inflammatory responses in CKD patients receiving ticagrelor-based DAPT. Our findings provide evidence for superior efficacy of ticagrelor over clopidogrel in non-dialysis people with stage 4-5 CKD, and also suggest DAPT with ticagrelor and aspirin might lower inflammatory burden observed in asymptomatic stages 4 or 5 CKD patients. Larger mechanistic clinical trials should investigate whether inflammatory responses of ticagrelor-based DAPT improve clinical outcomes in asymptomatic people with stages 4 or 5 CKD, and help us individualize treatment strategies for this understudied patient population in order to maximize therapeutic benefits.
Supplementary Material
ACKNOWLEDGEMENTS
Many thanks to the participants in the CKD-Platelet Study. Individuals who were not financially compensated for their role in the study need to be recognized: medical monitor (Nithin Karakala, MD), Assistant Professor (Christian Herzog, PhD), research coordinators (Giuseppina Dusio, PhD, Brandi Mojica, MS, and Tawana Gibbs, MS), and medical students (Monica Kothari, MD, and Clayton L Davis, MD). Our nephrology colleagues, Luis Juncos, MD, and Manisha Singh, MD, helped us at the Veterans Affairs (VA) site with performing study visits for the participants. Editorial assistance was provided by the UAMS Science Communication Group and Bobby D. Fine, Jr, MD, MPH. The Translational Research Institute (TRI) at the University of Arkansas for Medical Sciences (UAMS) (funded by grant UL1 TR003107 through the National Center for Advancing Translational Sciences of the National Institutes of Health) provided research exam rooms, and assisted with the regulatory approvals. The UAMS and VA Research pharmacists (Amy Crisp, Mindy Caid, Jennifer Roberts, Terri Dodds) blinded the study drugs and helped dispense them.
FUNDING SOURCES
This study was supported by a Joseph V. Bonventre Career Development Grant from the American Society of Nephrology (ASN) Foundation for Kidney Research and a Hornick Endowment award from the University of Arkansas for Medical Sciences College of Medicine Office of Research to Dr. Jain. This study was also supported by a grant (PTRF 2021-04) from Dialysis Clinic Inc. to Dr. Jain. Institutional support was provided by the Translational Research Institute supported by a grant (KL2 TR003108 and UL1 TR003107) from the National Center for Advancing Translational Sciences. The views expressed here are those of the authors and do not necessarily represent the views of the American Society of Nephrology, Veterans Affairs or the National Institutes of Health.
ABBREVIATION LIST
- ANCOVA
analysis of covariance
- CAD
coronary artery disease
- CKD
chronic kidney disease
- DAPT
dual antiplatelet therapy
- GFR
glomerular filtration rate
- GSNCA
gene sets net correlations analysis
- LCMS
liquid chromatography mass spectrometry
- PLATO
Platelet Inhibition and Patient Outcomes
- RCT
randomized controlled trial
- SD
standard deviation
- UACR
urine albumin-to-creatinine ratio
Footnotes
Publisher's Disclaimer: This is a PDF file of an unedited manuscript that has been accepted for publication. As a service to our customers we are providing this early version of the manuscript. The manuscript will undergo copyediting, typesetting, and review of the resulting proof before it is published in its final form. Please note that during the production process errors may be discovered which could affect the content, and all legal disclaimers that apply to the journal pertain.
PRIOR PRESENTATION
Some of these results were submitted in an abstract for the American Society of Nephrology Kidney Week and the American Heart Association Scientific Sessions to be held in Fall 2022.
Declaration of interests
The authors declare that they have no known competing financial interests or personal relationships that could have appeared to influence the work reported in this paper.
DATA AVAILABILITY STATEMENT
The data that support the findings of this study are available from the corresponding author (NJ) upon reasonable request.
REFERENCES
- 1.James S, Budaj A, Aylward P, et al. Ticagrelor versus clopidogrel in acute coronary syndromes in relation to renal function: results from the Platelet Inhibition and Patient Outcomes (PLATO) trial. Circulation. 2010;122(11):1056–1067. [DOI] [PubMed] [Google Scholar]
- 2.Storey RF, James SK, Siegbahn A, et al. Lower mortality following pulmonary adverse events and sepsis with ticagrelor compared to clopidogrel in the PLATO study. Platelets. 2014;25(7):517–525. [DOI] [PMC free article] [PubMed] [Google Scholar]
- 3.Jain N, Phadnis MA, Martin BC, Mehta JL. Potent Antiplatelet Therapy May Reduce Death from Sepsis in Patients on Chronic Dialysis. Am J Cardiol. 2022;162:209–211. [DOI] [PubMed] [Google Scholar]
- 4.Serebruany VL. Ticagrelor FDA approval issues revisited. Cardiology. 2012;122(3):144–147. [DOI] [PubMed] [Google Scholar]
- 5.Jain N, Phadnis MA, Hunt SL, et al. Comparative Effectiveness and Safety of Oral P2Y12 Inhibitors in Patients on Chronic Dialysis. Kidney Int Rep. 2021;6(9):2381–2391. [DOI] [PMC free article] [PubMed] [Google Scholar]
- 6.Mavrakanas TA, Kamal O, Charytan DM. Prasugrel and Ticagrelor in Patients with Drug-Eluting Stents and Kidney Failure. Clin J Am Soc Nephrol. 2021;16(5):757–764. [DOI] [PMC free article] [PubMed] [Google Scholar]
- 7.Lee CH, Tsai TH, Lin CJ, Hsueh SK, Chung WJ, Cheng CI. Efficacy and Safety of Ticagrelor Compared with Clopidogrel in Patients with End-Stage Renal Disease with Acute Myocardial Infarction. Am J Cardiovasc Drugs. 2019;19(3):325–334. [DOI] [PubMed] [Google Scholar]
- 8.Tung YC, Chang CJ, Liu JR, et al. Outcomes after ticagrelor versus clopidogrel treatment in end-stage renal disease patients with acute myocardial infarction: a nationwide cohort study. Sci Rep. 2021;11(1):20826. [DOI] [PMC free article] [PubMed] [Google Scholar]
- 9.Roh JW, Lee SJ, Kim BK, et al. Ticagrelor vs. Clopidogrel in Acute Coronary Syndrome Patients With Chronic Kidney Disease After New-Generation Drug-Eluting Stent Implantation. Front Cardiovasc Med. 2021;8:707722. [DOI] [PMC free article] [PubMed] [Google Scholar]
- 10.Alexopoulos D, Xanthopoulou I, Plakomyti TE, Goudas P, Koutroulia E, Goumenos D. Ticagrelor in clopidogrel-resistant patients undergoing maintenance hemodialysis. Am J Kidney Dis. 2012;60(2):332–333. [DOI] [PubMed] [Google Scholar]
- 11.Jeong KH, Cho JH, Woo JS, et al. Platelet reactivity after receiving clopidogrel compared with ticagrelor in patients with kidney failure treated with hemodialysis: a randomized crossover study. Am J Kidney Dis. 2015;65(6):916–924. [DOI] [PubMed] [Google Scholar]
- 12.Baber U, Mehran R, Kirtane AJ, et al. Prevalence and impact of high platelet reactivity in chronic kidney disease: results from the Assessment of Dual Antiplatelet Therapy with Drug-Eluting Stents registry. Circ Cardiovasc Interv. 2015;8(6):e001683. [DOI] [PubMed] [Google Scholar]
- 13.Angiolillo DJ, Bernardo E, Capodanno D, et al. Impact of chronic kidney disease on platelet function profiles in diabetes mellitus patients with coronary artery disease taking dual antiplatelet therapy. J Am Coll Cardiol. 2010;55(11):1139–1146. [DOI] [PubMed] [Google Scholar]
- 14.Park S, Kim W, Park C, Kang W, Hwang S, Kim W. A Comparison of Clopidogrel Responsiveness in Patients with versus without Chronic Renal Failure. Am J Cardiol. 2009;104(9):1292–1295. [DOI] [PubMed] [Google Scholar]
- 15.Htun P, Fateh-Moghadam S, Bischofs C, et al. Low responsiveness to clopidogrel increases risk among CKD patients undergoing coronary intervention. J Am Soc Nephrol. 2011;22(4):627–633. [DOI] [PMC free article] [PubMed] [Google Scholar]
- 16.Edfors R, Sahlen A, Szummer K, et al. Outcomes in patients treated with ticagrelor versus clopidogrel after acute myocardial infarction stratified by renal function. Heart. 2018;104(19):1575–1582. [DOI] [PubMed] [Google Scholar]
- 17.De Filippo O, D’Ascenzo F, Raposeiras-Roubin S, et al. P2Y12 inhibitors in acute coronary syndrome patients with renal dysfunction: an analysis from the RENAMI and BleeMACS projects. Eur Heart J Cardiovasc Pharmacother. 2020;6(1):31–42. [DOI] [PubMed] [Google Scholar]
- 18.Baaten C, Sternkopf M, Henning T, Marx N, Jankowski J, Noels H. Platelet Function in CKD: A Systematic Review and Meta-Analysis. J Am Soc Nephrol. 2021. [DOI] [PMC free article] [PubMed] [Google Scholar]
- 19.Jain N, Li X, Adams-Huet B, et al. Differences in Whole Blood Platelet Aggregation at Baseline and in Response to Aspirin and Aspirin Plus Clopidogrel in Patients With Versus Without Chronic Kidney Disease. Am J Cardiol. 2016;117(4):656–663. [DOI] [PMC free article] [PubMed] [Google Scholar]
- 20.Boccardo P, Remuzzi G, Galbusera M. Platelet Dysfunction in Renal Failure. Semin Thromb Hemost. 2004;30(05):579, 589. [DOI] [PubMed] [Google Scholar]
- 21.Gawaz MP, Dobos G, Spath M, Schollmeyer P, Gurland HJ, Mujais SK. Impaired function of platelet membrane glycoprotein IIb-IIIa in end-stage renal disease. J Am Soc Nephrol. 1994;5(1):36–46. [DOI] [PubMed] [Google Scholar]
- 22.Husted S, van Giezen JJ. Ticagrelor: the first reversibly binding oral P2Y12 receptor antagonist. Cardiovasc Ther. 2009;27(4):259–274. [DOI] [PMC free article] [PubMed] [Google Scholar]
- 23.Jain N, Reilly RF. Oral P2Y12 Receptor Inhibitors in Hemodialysis Patients Undergoing Percutaneous Coronary Interventions: Current Knowledge and Future Directions. Semin Dial. 2016;29(5):374–381. [DOI] [PubMed] [Google Scholar]
- 24.Amdur RL, Feldman HI, Gupta J, et al. Inflammation and Progression of CKD: The CRIC Study. Clin J Am Soc Nephrol. 2016;11(9):1546–1556. [DOI] [PMC free article] [PubMed] [Google Scholar]
- 25.Jain N, Wan F, Kothari M, et al. Association of platelet function with depression and its treatment with sertraline in patients with chronic kidney disease: analysis of a randomized trial. BMC Nephrol. 2019;20(1):395. [DOI] [PMC free article] [PubMed] [Google Scholar]
- 26.Husted S, Emanuelsson H, Heptinstall S, Sandset PM, Wickens M, Peters G. Pharmacodynamics, pharmacokinetics, and safety of the oral reversible P2Y12 antagonist AZD6140 with aspirin in patients with atherosclerosis: a double-blind comparison to clopidogrel with aspirin. Eur Heart J. 2006;27(9):1038–1047. [DOI] [PubMed] [Google Scholar]
- 27.Storey RF, Husted S, Harrington RA, et al. Inhibition of platelet aggregation by AZD6140, a reversible oral P2Y12 receptor antagonist, compared with clopidogrel in patients with acute coronary syndromes. J Am Coll Cardiol. 2007;50(19):1852–1856. [DOI] [PubMed] [Google Scholar]
- 28.Levey AS, Stevens LA, Schmid CH, et al. A new equation to estimate glomerular filtration rate. Ann Intern Med. 2009;150(9):604–612. [DOI] [PMC free article] [PubMed] [Google Scholar]
- 29.Butler K, Teng R. Pharmacokinetics, pharmacodynamics, safety and tolerability of multiple ascending doses of ticagrelor in healthy volunteers. Br J Clin Pharmacol. 2010;70(1):65–77. [DOI] [PMC free article] [PubMed] [Google Scholar]
- 30.R Core Team (2022). R: A language and environment for statistical computing. R Foundation for Statistical Computing, Vienna, Austria. URL https://www.R-project.org/. [Google Scholar]
- 31.Rahmatallah Y, Emmert-Streib F, Glazko G. Gene Sets Net Correlations Analysis (GSNCA): a multivariate differential coexpression test for gene sets. Bioinformatics. 2014;30(3):360–368. [DOI] [PMC free article] [PubMed] [Google Scholar]
- 32.Rahmatallah Y, Zybailov B, Emmert-Streib F, Glazko G. GSAR: Bioconductor package for Gene Set analysis in R. BMC Bioinformatics. 2017;18(1):61. [DOI] [PMC free article] [PubMed] [Google Scholar]
- 33.Dobesh PP, Oestreich JH. Ticagrelor: pharmacokinetics, pharmacodynamics, clinical efficacy, and safety. Pharmacotherapy. 2014;34(10):1077–1090. [DOI] [PMC free article] [PubMed] [Google Scholar]
- 34.Mullangi R, Srinivas NR. Clopidogrel: review of bioanalytical methods, pharmacokinetics/pharmacodynamics, and update on recent trends in drug-drug interaction studies. Biomed Chromatogr. 2009;23(1):26–41. [DOI] [PubMed] [Google Scholar]
- 35.Siller-Matula JM, Akca B, Neunteufl T, et al. Inter-patient variability of platelet reactivity in patients treated with prasugrel and ticagrelor. Platelets. 2016;27(4):373–377. [DOI] [PubMed] [Google Scholar]
- 36.Storey RF, Melissa Thornton S, Lawrance R, et al. Ticagrelor yields consistent dose-dependent inhibition of ADP-induced platelet aggregation in patients with atherosclerotic disease regardless of genotypic variations in P2RY12, P2RY1, and ITGB3. Platelets. 2009;20(5):341–348. [DOI] [PubMed] [Google Scholar]
- 37.Angiolillo DJ, Fernandez-Ortiz A, Bernardo E, et al. Variability in individual responsiveness to clopidogrel: clinical implications, management, and future perspectives. J Am Coll Cardiol. 2007;49(14):1505–1516. [DOI] [PubMed] [Google Scholar]
- 38.Best PJM, Steinhubl SR, Berger PB, et al. The efficacy and safety of short- and long-term dual antiplatelet therapy in patients with mild or moderate chronic kidney disease: Results from the Clopidogrel for the Reduction of Events During Observation (CREDO) Trial. Am Heart J. 2008;155(4):687–693. [DOI] [PubMed] [Google Scholar]
- 39.Thomas MR, Storey RF. The role of platelets in inflammation. Thromb Haemost. 2015;114(3):449–458. [DOI] [PubMed] [Google Scholar]
- 40.Corken A, Ware J, Dai J, et al. Platelet-Dependent Inflammatory Dysregulation in Patients with stages 4-5 Chronic Kidney Disease- A Mechanistic Clinical Study. Kidney360. 2022: 10.34067/KID.0005532022. [DOI] [PMC free article] [PubMed] [Google Scholar]
- 41.Franco AT, Corken A, Ware J. Platelets at the interface of thrombosis, inflammation, and cancer. Blood. 2015;126(5):582–588. [DOI] [PMC free article] [PubMed] [Google Scholar]
- 42.Aslam R, Speck ER, Kim M, et al. Platelet Toll-like receptor expression modulates lipopolysaccharide-induced thrombocytopenia and tumor necrosis factor-alpha production in vivo. Blood. 2006;107(2):637–641. [DOI] [PubMed] [Google Scholar]
- 43.Thomas MR, Outteridge SN, Ajjan RA, et al. Platelet P2Y12 Inhibitors Reduce Systemic Inflammation and Its Prothrombotic Effects in an Experimental Human Model. Arterioscler Thromb Vasc Biol. 2015;35(12):2562–2570. [DOI] [PMC free article] [PubMed] [Google Scholar]
- 44.Jain MK, Ridker PM. Anti-inflammatory effects of statins: clinical evidence and basic mechanisms. Nat Rev Drug Discov. 2005;4(12):977–987. [DOI] [PubMed] [Google Scholar]
- 45.Clark SR, Ma AC, Tavener SA, et al. Platelet TLR4 activates neutrophil extracellular traps to ensnare bacteria in septic blood. Nat Med. 2007;13(4):463–469. [DOI] [PubMed] [Google Scholar]
- 46.Korniluk A, Koper-Lenkiewicz OM, Kaminska J, Kemona H, Dymicka-Piekarska V. Mean Platelet Volume (MPV): New Perspectives for an Old Marker in the Course and Prognosis of Inflammatory Conditions. Mediators Inflamm. 2019;2019:9213074. [DOI] [PMC free article] [PubMed] [Google Scholar]
- 47.Kemec Z, Demir M, Gurel A, et al. Associations of platelet indices with proteinuria and chronic kidney disease. J Int Med Res. 2020;48(6):300060520918074. [DOI] [PMC free article] [PubMed] [Google Scholar]
- 48.Landray MJ, Wheeler DC, Lip GYH, et al. Inflammation, endothelial dysfunction, and platelet activation in patients with chronic kidney disease: the chronic renal impairment in Birmingham (CRIB) study. Am J Kidney Dis. 2004;43(2):244–253. [DOI] [PubMed] [Google Scholar]
- 49.Clinical Trial Identifier URL: https://clinicaltrials.gov/ct2/show/NCT02539160?term=NCT02539160&draw=2&rank=1. Accessed on May 9th, 2022 at 1:30pm.
- 50.Flannagan KS, Sjaarda LA, Hill MJ, et al. Pilot randomized trial of short-term changes in inflammation and lipid levels during and after aspirin and pravastatin therapy. Reprod Health. 2019;16(1):132. [DOI] [PMC free article] [PubMed] [Google Scholar]
- 51.Jain N, McAdams M, Hedayati SS. Screening for Cardiovascular Disease in CKD: PRO. Kidney360. 2022;3(11):1831–1835. [DOI] [PMC free article] [PubMed] [Google Scholar]
Associated Data
This section collects any data citations, data availability statements, or supplementary materials included in this article.
Supplementary Materials
Data Availability Statement
The data that support the findings of this study are available from the corresponding author (NJ) upon reasonable request.