Abstract
Background:
Although previous studies have described a positive correlation between physical activity and 25-hydroxyvitamin D levels (25(OH)D), the relationship between participation in school sports and 25(OH)D levels among children has not been well characterized.
Methods:
The present study analyzed data from participants aged 5 to 15 years in the National Health and Nutrition Examination Survey cycle 2013-2014. General linear models adjusted for potential confounders were assembled to examine 25(OH)D levels according to participation in school sports.
Results:
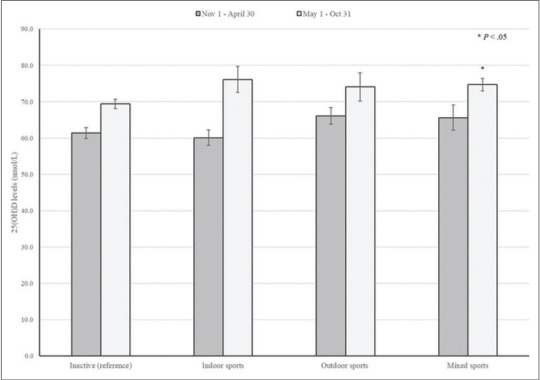
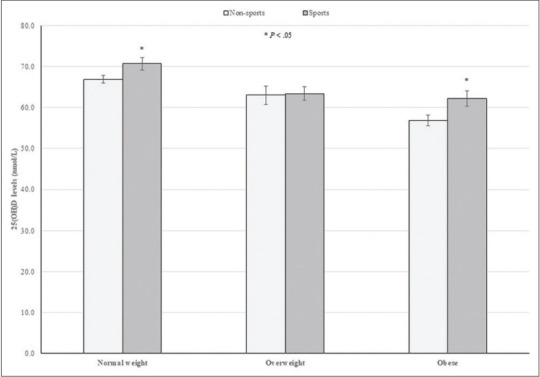
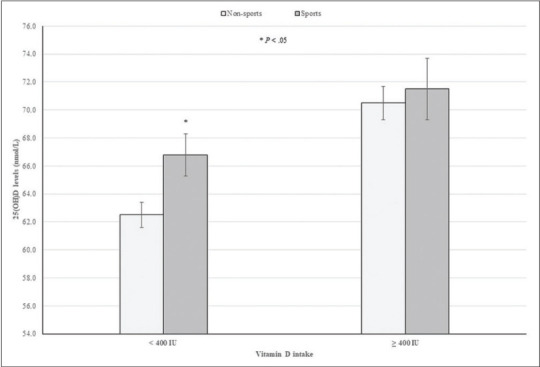
Of 1,670 children in the study sample, 17.9% were defined as having 25(OH)D inadequacy (< 50 nmol/L). Overall, 38% of children reported participation in school sports. In general, 25(OH)D levels were increased among children examined between May 1st and Oct 31st non-Hispanic whites, normal weight, higher income, and daily vitamin D intake ≥ 400 IU/d. After adjusting for potential confounders, 25(OH)D levels were 3.7 nmol/L higher among children who played in any school sports than those who did not. In general, higher 25(OH)D levels were seen among children examined during summer and fall seasons than those during winter and spring seasons, regardless the type of sport activities. Moreover, children who played mixed sports during summer and fall seasons had significantly higher 25(OH)D levels than their physically inactive counterparts.
Conclusions:
25(OH)D concentrations were significantly higher in children playing school sports than those who did not. Thus, children's participation in school sports, particularly during summer and fall seasons should be considered as an effective public health intervention to reach optimal 25(OH)D levels.
Keywords: Adolescents, grip strength, NHANES, vitamin D levels
Introduction
Muscle weakness is a common finding among vitamin D deficient subjects with and without evidence of osteomalacia.[1] Subsequently, several studies conducted among older adults have reported with conflicting results the relationship between 25, hydroxyvitamin D (25(OH)D) levels and muscle strength. Although few studies demonstrated that 25(OH)D levels were significantly correlated with muscle strength,[2,3,4,5,6] others did not.[7,8]
In adolescents, there has been limited research examining this association. Previously, a cross-sectional study conducted in Chinese girls aged 12–15 years reported that serum 25(OH)D level ≥50 nmol/L was associated with greater grip strength.[9] Likewise, among participants in the Young Hears Study 2000, boys 15-year-old with serum 25(OH)D levels >51 nmol/L had significantly greater grip strength (GS) than those with 25(OH)D level <32 nmol/L. However, among 12-year-old boys and girls, GS did not significantly differ across 25(OH)D levels.[10] Given that muscle strength significantly correlates with bone mass acquisition during adolescence, it is relevant to determine the effect of 25(OH)D levels on muscle strength during this critical period of musculoskeletal growth.[11] Therefore, the present cross-sectional study aimed to examine the relationship between vitamin D status and handgrip strength among adolescents aged 10–19 years.
Methods
Study population
The present analysis was based on data from the continuous National Health and Nutrition Examination Survey (NHANES) 2011-2012 and 2013-2014 cycles. The NHANES is designed to assess the health and nutritional status of adults and children in the United States (US). A complex, multistage probability sampling design was used to select a sample representative of the civilian noninstitutionalized household population of the US.[12]
Characteristics of adolescents
The demographic characteristics of the adolescents were self-reported. In addition, the household reference person's highest level of education was described and the ratio of family income to poverty was calculated to measure family's poverty status. In the interview file, sedentary lifestyle over the past 30 days was assessed by asking participants “How many hours per day did you sit and watch TV or videos? Self-reported general health was grouped as good to excellent and fair to poor. In the dietary interview component, adolescent's daily total protein intake was reported in gm. Standing height (cm) was measured using a stadiometer and a fixed vertical backboard. Moreover, participants’ total percent fat mass and total lean mass (gm), excluding bone mineral content, were measured using whole-body scans densitometers (Hologic, Inc., Bedford, Massachusetts).
Vitamin D status
Total serum 25(OH)D level (nmol/L) was measured by the CDC standardized liquid chromatography-tandem mass spectrometry (LC-MS/MS) method. Adolescents with 25OHD levels < 50 nmol/L were defined as having vitamin D deficiency, 25OHD levels between 50 nmol/L to 75 nmol/L represented vitamin D insufficiency, and those with 25OHD levels > 75 nmol/L were considered as sufficient vitamin D levels as per the American Endocrine Society guideline.[13]
Muscle strength
A detailed description of the muscle strength procedure manual is available at https://wwwn.cdc.gov/nchs/data/nhanes/2013-2014/manuals/muscle_strength_2013.pdf. Briefly, muscle strength was measured using a handgrip dynamometer. Participants while standing squeezed the dynamometer as hard as possible. The exam was then repeated in each hand three times, with a 60-second rest between trials on alternating hands. The combined maximum GS, expressed in kilograms (kg) was calculated as the sum of the greatest reading for each hand. Those who were unable to hold the dynamometer with both hands or had any surgery in the hands/wrists in the prior 3 months were excluded for this analysis.
Statistical analysis
The demographic characteristics of participants were compared across vitamin D status using the Chi-squared and ANOVA for categorical and continuous variables, respectively. Subsequently, gender- and age-specific general linear models adjusted for potential confounders were assembled to examine the combined maximum GS (kg) across vitamin D status. SPSS Complex Sample software, V.25 (SPSS Inc, Chicago, Illinois, USA) was used in all analyses to account for the complex survey design. A P value <0.05 was considered statistically significant.
Results
A total of 2,528 participants with a mean age of 14.5 (SE 0.07) years comprised the study sample, representing an estimated 31 million US adolescents during the study period. Table 1 shows the characteristics of adolescents according to vitamin D status. In general, girls, non-Hispanic black, low income, higher total percent fat mass, sedentary lifestyle, and lower protein intake were characteristics associated with vitamin D insufficiency. Overall, the crude prevalence of vitamin D deficiency was 28.5% in girls and 22.9% in boys. As shown in Figure 1, height-adjusted combined maximum GS was consistently stronger in boys than that in girls, which was more accentuated among adolescents aged 15-19 years.
Table 1.
Characteristics of children and corresponding 25(OH) D levels
| % (SE) (n=1,670) | Mean 25(OH) D nmol/L, (SE) | |
|---|---|---|
| Six-month period, % | ||
| Nov 1st - April 30th | 47.5 (6.5) | 60.6 (1.5)* |
| May 1st - Oct 31st | 52.5 (6.5) | 70.4 (1.7) |
| Age group, (years), % | ||
| 5-10 | 50.0 (2.2) | 69.7 (1.6)* |
| 11-15 | 50.0 (2.2) | 61.9 (1.4) |
| Gender, % | ||
| Boys | 51.4 (1.6) | 66.4 (1.1) |
| Girls | 48.6 (1.6) | 65.2 (1.9) |
| Race/Hispanic origin, % | ||
| Hispanic | 24.4 (4.4) | 60.7 (1.3)* |
| Non-Hispanic White | 52.2 (5.9) | 72.3 (1.3) |
| Non-Hispanic Black | 13.9 (2.2) | 52.1 (1.7) |
| Other Race | 9.5 (1.3) | 62.8 (1.8) |
| BMI, % | ||
| Normal | 63.5 (1.7) | 68.6 (1.6) |
| Overweight | 17.7 (0.7) | 63.2 (1.9) |
| Obese | 18.8 (1.5) | 58.8 (1.4) |
| Reference person’s education, % | ||
| <9th grade | 6.4 (1.2) | 58.2 (1.1)* |
| 9-11th grade | 11.8 (1.4) | 61.1 (1.7) |
| High school graduate | 22.4 (2.6) | 62.1 (1.7) |
| Some college | 31.8 (1.7) | 65.7 (1.4) |
| College graduate or above | 27.5 (3.4) | 72.4 (2.5) |
| Income to poverty ratio, % | ||
| <1.00 | 27.4 (3.2) | 61.0 (1.4)* |
| ≥1.00 | 72.6 (3.2) | 67.3 (1.5) |
| Hours watch TV or videos past 30 days, % | ||
| <1 h | 12.4 (1.1) | 67.9 (2.6)* |
| 1 h | 26.8 (1.7) | 68.5 (1.7) |
| 2 h | 30.0 (1.5) | 65.5 (1.1) |
| ≥3 h | 30.8 (1.6) | 62.6 (1.9) |
| Participate in school sports, % | ||
| Yes | 38.4 (2.2) | 68.6 (2.0)* |
| No | 61.6 (2.2) | 64.0 (1.2) |
| EAR for vitamin D intake, % | ||
| <400 IU | 76.7 (1.5) | 64.2 (1.3)* |
| ≥400 IU | 23.3 (1.5) | 70.9 (1.8) |
*P<0.05. EAR: Estimated Average Requirement
Figure 1.

25(OH)D levels according to type of sport activities and examination period
Figure 1.

25(OH)D levels according to school sports participation and BMI
Figure 1.

25(OH)D levels according to school sports participation and EAR for vitamin D intake
Table 2 shows adjusted mean combined maximum GS across vitamin D status stratified by age groups and gender. As expected, boys were consistently stronger than girls, which was more accentuated among those aged 15–19 years. Moreover, GS was slightly greater among adolescents aged 10–14 years with 25(OH)D levels >75 nmol/L than their counterparts with 25(OH)D <50 nmol/L. However, this difference did not reach statistically significance. In contrast, boys and girls aged 15–19 years with 25(OH)D levels between 50 and 75 and >75 nmol/L were significantly stronger than those with vitamin D deficiency, respectively.
Table 2.
Participation in selected school sports and 25(OH) D levels among children
| Sports | n (%) | Mean 25(OH) D nmol/L (SE)a | Mean 25(OH) D nmol/L (SE)b |
|---|---|---|---|
| None (reference) | 1,063 (61.6) | 61.5 (1.8) | 64.2 (0.9) |
| Any sport activity | 607 (38.4) | 67.2 (1.7)* | 67.9 (1.2)* |
| Basketball | 196 (11.1) | 63.2 (1.9) | 65.4 (1.2) |
| Soccer | 155 (10.2) | 74.5 (3.7)* | 72.1 (2.7)* |
| Baseball | 93 (6.9) | 65.8 (2.3) | 69.5 (2.3)* |
| Football | 115 (6.8) | 61.5 (1.5)* | 65.3 (1.9) |
| Running out | 88 (5.2) | 68.3 (2.7) | 64.8 (2.0) |
| Track and field | 69 (5.0) | 70.4 (3.8) | 67.7 (3.0) |
| Volleyball | 38 (2.9) | 59.7 (4.1) | 61.9 (2.1) |
| Dance | 57 (2.8) | 60.9 (5.5) | 61.5 (2.7) |
aUnadjusted mean 25(OH) D levels. bMean 25 (OH) D levels adjusted for age, gender, six-month study period, race/ethnicity, BMI, family reference person’s education, income to poverty ratio, sedentary lifestyle, and vitamin D intake. *P<0.05
Discussion
The present results indicate that adolescents with vitamin D sufficiency had greater combined maximum GS than their counterparts with vitamin D deficiency. This association was particularly accentuated in boys and girls aged 15 years and older. Moreover, boys with 25(OH)D levels between 50 and 75 nmol/L also had stronger GS than those with 25(OH)D levels <50 nmol/L. Of note, the significant GS differences between age groups and sex found in the present study have been explained by an age-dependent increase in fat free mas during childhood.[14]
The present findings are consistent with those reported in the Young Hearts Study in which boys 15-year-old with 25(OH)D levels >51 nmol/L had on average 3.8 kg stronger GS than their counterparts with 25(OH)D levels <32 nmol/L. However, GS did not significantly differ among girls 15-year-old and 12-year-old boys and girls across 25(OH)D tertiles.[10] Likewise, a prospective study conducted among girls aged 10–13 years recruited from schools in Central Finland demonstrated no difference in muscle strength between participants with 25(OH)D levels <50 nmol/L and those with 25(OH)D levels ≥50 nmol/L both at baseline and 7.5-year follow-up.[15] On the contrary, a cross-sectional study conducted among Chinese adolescent girls aged 15 years demonstrated that girls with 25(OH)D levels ≥50 nmol/L had on average 1.8 kg greater GS than those with vitamin D deficiency.[9] In addition, in the HELENA study, GS was positively associated with 25(OH)D levels among girls with a mean age of 14.8 years.[16] Likewise, in a small study conducted among Ethiopian schoolchildren, serum 25(OH)D level had a significant and positive correlation with GS, which is in agreement with the present findings.[17]
Although the physiological effects of vitamin D on muscle strength are not completely elucidated, it has been postulated that 1,25-dihydroxyvitamin D3 increases calcium influx in muscle cells and may have a role in the regulation of muscle cell cytoskeleton protein synthesis.[18] Moreover, Girgis et al. demonstrated that mice with deletion of the vitamin D receptor or diet-induced vitamin D deficiency were weaker than controls at 3 months. Moreover, both groups of mice had down-regulation of genes encoding calcium-handling and sarco-endoplasmic reticulum calcium transport.[19]
The present study has some limitations that should be mentioned. Because of its cross-sectional design, the temporal relationship between vitamin D status and grip strength may not be established. The handgrip strength was used as proxy for overall body muscle strength. However, it is unknown if vitamin D status may have a similar effect on other muscle strength measurements. Finally, data on adolescent's pubertal status were not available for the present analysis. Despite these limitations, the major strength of this population-based study is that the results may be generalized to the US adolescent population.
In conclusion, adolescents with vitamin D sufficiency were significantly stronger than their counterparts with vitamin D deficiency. Notably, this association was particularly marked among those aged 15–19 years. However, further prospective studies are needed to determine the long-term effect of optimal 25(OH)D levels on muscle strength in adolescents.
Financial support and sponsorship
Nil.
Conflicts of interest
There are no conflicts of interest.
References
- 1.Glerup H, Mikkelsen K Poulsen L, Hass E, Overbeck S, Andersen H, et al. Hypovitaminosis D myopathy without biochemical signs of osteomalacic bone involvement. Calcif Tissue Int. 2000;66:419–24. doi: 10.1007/s002230010085. [DOI] [PubMed] [Google Scholar]
- 2.Orces CH. Prevalence of clinically relevant muscle weakness and its association with vitamin D status among older adults in Ecuador. Aging Clin Exp Res. 2017;29:943–9. doi: 10.1007/s40520-016-0678-3. [DOI] [PubMed] [Google Scholar]
- 3.Aspell N, Laird E, Healy M, Lawlor B, O’Sullivan M. Vitamin D deficiency is associated with impaired muscle strength and physical performance in community-dwelling older adults: Findings from the english longitudinal study of ageing. Clin Interv Aging. 2019;14:1751–61. doi: 10.2147/CIA.S222143. [DOI] [PMC free article] [PubMed] [Google Scholar]
- 4.Kitsu T, Kabasawa K, Ito Y, Kitamura K, Watanabe Y, Tanaka J, et al. Low serum 25-hydroxyvitamin D is associated with low grip strength in an older Japanese population. J Bone Miner Metab. 2020;38:198–204. doi: 10.1007/s00774-019-01040-w. [DOI] [PubMed] [Google Scholar]
- 5.Iolascon G, de Sire A, Calafiore D, Moretti A, Gimigliano R, Gimigliano F. Hypovitaminosis D is associated with a reduction in upper and lower limb muscle strength and physical performance in post-menopausal women: A retrospective study. Aging Clin Exp Res. 2015;27(Suppl 1):S23–30. doi: 10.1007/s40520-015-0405-5. [DOI] [PubMed] [Google Scholar]
- 6.Bischoff-Ferrari HA, Dietrich T, Orav EJ, Hu FB, Zhang Y, Karlson EW, et al. Higher 25-hydroxyvitamin D concentrations are associated with better lower-extremity function in both active and inactive persons aged>or=60 y. Am J Clin Nutr. 2004;80:752–8. doi: 10.1093/ajcn/80.3.752. [DOI] [PubMed] [Google Scholar]
- 7.Kim BJ, Kwak MK, Lee SH, Koh JM. Lack of association between vitamin D and hand grip strength in Asians: A nationwide population-based study. Calcif Tissue Int. 2019;104:152–9. doi: 10.1007/s00223-018-0480-7. [DOI] [PubMed] [Google Scholar]
- 8.Annweiler C, Schott-Petelaz AM, Berrut G, Kressig RW, Bridenbaugh S, Herrmann FR, et al. Vitamin D deficiency-related quadriceps weakness: Results of the Epidemiologie De Osteoporose cohort. J Am Geriatr Soc. 2009;57:368–9. doi: 10.1111/j.1532-5415.2009.02118.x. [DOI] [PubMed] [Google Scholar]
- 9.Foo LH, Zhang Q, Zhu K, Ma G, Hu X, Greenfield H, et al. Low vitamin D status has an adverse influence on bone mass, bone turnover, and muscle strength in Chinese adolescent girls. J Nutr. 2009;139:1002–7. doi: 10.3945/jn.108.102053. [DOI] [PubMed] [Google Scholar]
- 10.Carson EL, Pourshahidi LK, Hill TR, Cashman KD, Strain JJ, Boreham CA, et al. Vitamin D, muscle function, and cardiorespiratory fitness in adolescents from the young hearts study. J Clin Endocrinol Metab. 2015;100:4621–8. doi: 10.1210/jc.2015-2956. [DOI] [PubMed] [Google Scholar]
- 11.Chan DC, Lee WT, Lo DH, Leung JC, Kwok AW, Leung PC. Relationship between grip strength and bone mineral density in healthy Hong Kong adolescents. Osteoporos Int. 2008;19:1485–95. doi: 10.1007/s00198-008-0595-1. [DOI] [PubMed] [Google Scholar]
- 12. [Last accessed on 2020 Dec]. Available from: https://wwwn.cdc.gov/nchs/nhanes/analyticguidelines.aspx.
- 13.Holick MF, Binkley NC, Bischoff-Ferrari HA, Gordon CM, Hanley DA, Heaney RP, et al. Endocrine Society.Evaluation, treatment, and prevention of vitamin D deficiency: An Endocrine Society clinical practice guideline. J Clin Endocrinol Metab. 2011;96:1911–30. doi: 10.1210/jc.2011-0385. [DOI] [PubMed] [Google Scholar]
- 14.Sartorio A, Lafortuna CL, Pogliaghi S, Trecate L. The impact of gender, body dimension and body composition on hand-grip strength in healthy children. J Endocrinol Invest. 2002;25:431–5. doi: 10.1007/BF03344033. [DOI] [PubMed] [Google Scholar]
- 15.Wang R, Alen M, Yu Z, Wiklund P, Cheng SM, Törmäkangas T, et al. Does serum 25-hydroxyvitamin D influence muscle development during puberty in girls.A 7-year longitudinal study? PLoS One. 2013;8:82124. doi: 10.1371/journal.pone.0082124. [DOI] [PMC free article] [PubMed] [Google Scholar]
- 16.Valtueña J, Gracia-Marco L, Huybrechts I, Breidenassel C, Ferrari M, Gottrand F, et al. Cardiorespiratory fitness in males, and upper limbs muscular strength in females, are positively related with 25-hydroxyvitamin D plasma concentrations in European adolescents: The HELENA study. QJM. 2013;106:809–21. doi: 10.1093/qjmed/hct089. [DOI] [PubMed] [Google Scholar]
- 17.Wakayo T, Belachew T, Whiting SJ. Serum vitamin D level associates with handgrip muscle strength among Ethiopian schoolchildren: A cross-sectional study. Food Nutr Bull. 2018;39:54–64. doi: 10.1177/0379572117724545. [DOI] [PubMed] [Google Scholar]
- 18.Girgis CM, Clifton-Bligh RJ, Hamrick MW, Holick MF, Gunton JE. The roles of vitamin D in skeletal muscle: Form, function, and metabolism. Endocr Rev. 2013;34:33–83. doi: 10.1210/er.2012-1012. [DOI] [PubMed] [Google Scholar]
- 19.Girgis CM, Cha KM, Houweling PJ, Rao R, Mokbel N, Lin M, et al. Vitamin D receptor ablation and vitamin D deficiency result in reduced grip strength, altered muscle fibers, and increased myostatin in mice. Calcif Tissue Int. 2015;97:602–10. doi: 10.1007/s00223-015-0054-x. [DOI] [PubMed] [Google Scholar]


