

Abstract
TiO2–FeZn nanocatalyst combined with sonolysis were used to activate peroxymonosulfate (PMS) as a highly efficient advanced oxidation process (US/TiO2–FeZn/PMS) for the decoloration of orange II dye (OII) and real textile wastewater. The characterization of the as-synthesized NPs was performed by SEM, FTIR, EDX and XRD analyses. Optimal experimental conditions of operational parameters were obtained: pH = 3, 15 mg/L initial OII concentration, 0.2 g/L PMS, 0.7 g/L nanocatalyst dosing, and 300 W ultrasonic power. The decolorization was observed to increase with increasing the dose of nanocatalyst and the ultrasonic power, and with decreasing pH (under acidic conditions). Under optimal experimental conditions, decolorization and COD removal of textile wastewater were 99.9% and 74.6%, respectively, at 40 min. The TiO2–FeZn/PMS/US as a novel process exhibited a higher removal of OII (95%) than TiO2 NPs/PMS/US process (54%). The OII removal efficiency by the different processes decreased in the following order: TiO2–FeZn/US/PMS > TiO2–FeZn/PMS > TiO2–FeZn/US > TiO2 /US/PMS > US/PMS > TiO2–FeZn > PMS > US. The recyclability study revealed that the process could be reused up to three consecutive cycles. The current US/nanocatalyst/PMS system was concluded to be an efficient, reusable and stable nanocatalyst for the oxidation of textile dyes.
Supplementary Information
The online version contains supplementary material available at 10.1007/s13738-023-02780-3.
Keywords: Bimetallic nanoparticles; Peroxymonosulfate; Orange II dye; Sonocatalytic degradation, TiO2–FeZn nanoparticles
Introduction
During the last decades, the textile industry is one of the most water consuming industries, producing colorful wastewater with different quality and quantities [1, 2]. The dyes are classified as reactive, direct, acidic, dispersive and cationic groups which are greatly applied in food, cosmetics, paper and pulping, pharmaceuticals and textile industries [3]. Azo dyes which constitute about 60–70% of the dyes available on the world, are the largest group of dyes applied in the textile industries. Azo dyes are potential carcinogenic, toxic, non-biodegradable and mutagenic compounds. Orange II (OII), also known as acid orange 7, is an azo dye of an acidic nature, soluble in water and has an azo group (–N = N–) as chromophore in its structure, related to aromatic systems linked to as –OH and –SO3–Na+ [4, 5]. Dye wastewater has negative effects on human health and aquatic life, as well as threatening the environment. The colorful wastewater from the textile industry in the receiving water bodies prevents the penetration of sunlight and the consequent increase in the turbidity of the water [4, 6]. Therefore, the application of efficient and cost-effective destructive technologies for dye wastewater treatment is of paramount importance [6–9].
Due to the toxic nature of OII and its resistance to biological degradation in conventional wastewater treatment plant (WWTP), various treatment technologies, such as physical, biological and chemical methods, have been developed to remove this type of pollutant from wastewater [10–12]. Advanced oxidation processes (AOPs), as an efficient destructive technology, have gained increasing attention due to the avoidance of additional expensive physical separation process, as well as high performance in the degradation of persistent organic pollutants via the free radical mechanism. The several technologies of AOPs including Fenton oxidation, photocatalysis degradation, sonocatalytic and sonochemical methods, catalytic ozonation, electrochemical processes, etc., are based on the in situ generation of hydroxyl free radicals () from non-selective, strong reactive oxidizing species with a redox potential of 2.8 V [13, 14]. Recently, the novel combinations of the AOPs have been suggested as an efficient and promising technologies for the degradation of bio-recalcitrant environmental pollutants. In the last decade, sulfate radicals-based AOPs (SR–AOPs) have been proposed due to their unique characteristics compared to –based AOPs. Sulfate radical () is the powerful oxidant with a high standard redox potential ranging from 2.5 to 3.1 V, higher selectivity, high pollutant degradation efficiency over a wide pH range (1 ≤ pH ≤ 10.5) and longer half-life to degrade target pollutants than radicals (30–40 µs vs. 20 ns) [15–17]. Moreover, contrary to which participate in various reaction non-selectively, mainly react with organic matter during electron transfer selectively. Therefore, SR–AOPs are considered as very effective and promising methods for degradation of organic environmental contaminants. In order to generate in SR–AOPs, persulfate (PS, S2O8–) and peroxymonosulfate (PMS, HSO5–) could be used as source of and the efficient activator should be used to decompose them in the reaction solution. Unlike PS, PMS could be more easily activated with an efficient activator such as transition metal and ultrasound, due to its asymmetric structure, as well as the shorter O–O bond length in PMS. Therefore, PMS was used as a source of to degrade OII in aqueous solution. Various methods of PMS activation have been reported in the literature, including transition metals (homogenous and heterogeneous), ultraviolet (UV), ultrasound (US), heat, conduction electron, carbon–based catalysts, among others [18–20].
Among them, the sonochemical processes have attracted great attention as one of the most advanced oxidation methods due to its high effectiveness, high efficiency for the degradation of bio–recalcitrant industrial pollutants, and its high potential of organic pollutant mineralization [21, 22]. In the sonochemical process, ultrasonic waves travel inside the aqueous medium producing the formation, growth and implosive collapse of bubbles within the medium (ultrasonic cavitation), which produce “hot spots” with very high temperatures and pressures. Ultrasonic cavitation is the process of growth and collapse of small filled cavities (bubbles) in the liquid under the action of ultrasound. Sonoluminescence (flashes of light or chemiluminescence) occurs during ultrasonic transient cavitation collapse. Sonoluminescence is caused by chemical reactions of high–energy species formed during cavitational collapse (it is a form of chemiluminescence) [23, 24]. Cavitation involves the formation of bubbles that grow and collapse, producing strong rupture forces with extremely high temperatures (~ 5000 °C) and pressures (~ 2000 atm) generating radical species [25], the emission of light pulses (single and multi-bubble sonoluminescence) [26, 27], and dispersion and deagglomeration of NPs [28]. High temperature produces species resulting in thermal dissociation of water [21, 22]. Oxidizing agents such as and are produced during the bubble collapse [29, 30]. In addition, ultrasonic waves,))), can also activate PMS to produce and in water based on following Eqs. (1) and (2) [31, 32]:
| 1 |
| 2 |
However, the use of ultrasonic waves requires long time and high energy for pollutant degradation; but its combination with other oxidation processes or the use of suitable catalysts can be considered to overcome these problems [31, 32].
The presence of nanocatalyst can provide additional active sites for bubble nucleation. Among the different semiconductors, titanium oxide (TiO2) has gained more attention in the sonocatalytic process for the destruction of organic pollutants, due to its excellent physical and chemical properties, non–toxicity and low cost [31, 32]. One of the methods for improving the catalytic performance of TiO2 and preventing the recombination of electron–hole pairs is the doping with transition metal oxides such as Fe2O3 and ZnO [33, 34].
The metal oxide nanostructures such as Fe2O3 and ZnO increase the production of during the ultrasonic irradiation [7, 35]. Also, these metal oxide nanostructures could activate PMS, as suitable source of in the solution based on following Eqs.:
| 3 |
| 4 |
Therefore, the application of combined AOPs can improve the catalytic performance of metal oxide nanostructures for bio–recalcitrant pollutant degradation by the generation of both sulfate and hydroxyl radicals.
To the best of our knowledge, the use of integrated TiO2–FeZn NPs as a nanocatalyst under ultrasonic irritation to activate PMS and the subsequent application of this novel process for the treatment of colored solutions have not been reported. In the present study, a heterogeneous TiO2–FeZn NPs nanocatalyst was synthesized and used as a PMS activator under ultrasonic irradiation as an efficient novel process to enhance OII dye degradation under different experimental conditions. Thus, to achieve this goal, several activities were carried out, such as (i) synthesis and characterization of TiO2–FeZn NPs nanocatalyst, (ii) determination of the effective parameters on the degradation process, such as the initial pH, nanocatalyst dosage, initial OII concentration, PMS concentration, and ultrasonic power. OII mineralization was assessed by chemical oxygen demand (COD) measurements under optimal conditions and, finally, (iii) the stability and recyclability of the nanocatalyst was evaluated for potential large-scale applications. Intermediate by-products of OII degradation after the US/nanocatalyst/PMS process were also identified.
Materials and methods
Materials and chemicals
The OII was purchased from Alvan sabet company, Iran. The general characteristics of OII dye and the textile wastewater used in the present study are shown in Table S1 and S2, respectively [36–38]. Titanium (IV) isopropoxide (C12H28O4Ti, TTIP, Merck, 98%), 2-propanol (C3H8O, Merck, > 99%), potassium peroxymonosulfate (Oxone®, PMS, Sigma-Aldrich, CAS NO.:70693–62-8), sulfuric acid (H2SO4, 98%, Merck), sodium hydroxide (NaOH, 99%, Merck) and other reagents were analytical grade and used without further purification. Zinc oxide (ZnO) and iron oxide (Fe2O3) NPs were provided by NanoAmor Co (USA).
Nanocatalyst synthesis and characterization
The synthesis of titanium dioxide (TiO2) NPs was carried using the sol–gel method. TiO2 NPs were prepared according to the procedure described by Noorimotlagh et al. [39]. Briefly, 2-propanol solution was added drop wise in TTIP solution under continuous stirring (solution A). Then, for TiO2 doping with ZnO and Fe2O3, a specific amount of ZnO and Fe2O3 NPs with 0.02% ratio was added in 40 mL deionized water (solution B). Afterward, addition of solution B to A was carried out in drop wise under continuous stirring to produce the TiO2–FeZn NPs in gel form. Then, the gel was centrifuged, rinsed with deionized water, kept in an oven, ground and annealed in a muffle furnace (FP125 model) at 450 °C during 4 h. The experimental equipment applied to characterization of TiO2–FeZn nanocatalyst properties is shown in Table 1.
Table 1.
Experimental equipment applied to characterize properties of TiO2–FeZn NPs nanocatalyst
| Method | Equipment model | Application |
|---|---|---|
| SEMa | Tescan, Mira3, Czech Republic | Determination of morphological properties of synthesized NPs |
| XRDb | Philips Xpert diffractometer | Determination of the crystalline structure of the synthesized NPs |
| EDXc | PHILIPS, XL-30, Netherlands | Determination of the elemental composition of synthesized NPs |
| FT-IRd | St-Jeam Baptiste Bomem 450 | Determination of the functional groups of synthesized NPs |
| BETe | BET- Micromeritics Tristar 3000 | Determination of the specific surface area of synthesized NPs |
aField emission scanning electron microscope
bX–ray diffraction pattern
cEnergy–dispersive X-ray spectroscopy
dFourier transform infrared spectrometer
eBrunauer–Emmett–Teller method
OII sonodegradation procedure and analytical methods
In a typical degradation process, a stock solution of OII was freshly prepared by dissolving a known quantity of OII dye in 100 mL distilled water in a 250 mL erlenmeyer flask. This solution was diluted to the required initial concentrations (10–30 mg/L) of the dye. The initial pH of the dye solution was adjusted by adding 0.1 M NaOH and 0.1 M H2SO4. In each stage, the TiO2–FeZn nanocatalyst and PMS were added to 100 mL of OII solution under magnetic stirrer. Batch experiments were carried out using an ultrasonic generator equipped with a titanium probe transducer (Topsonics, 20 kHz) with different power settings. The tip of ultrasonic probe was placed 2.5 cm into the dye solution. The temperature of reaction solution during the sonication was kept at constant at room temperature by using water circulating system. At different time intervals, an aliquot (3 mL) was sampled, filtered through 0.45 µm membrane and centrifuged at 4000 rpm for 10 min. The residual OII solution concentration was determined using an UV–vis spectrophotometer at wavelength of λmax = 485 nm as the wavelength of maximum absorbance of OII [38]. The decoloration efficiency was calculated using Eq. (5):
| 5 |
where RE is the removal efficiency, OII0 and OIIt are the initial concentration of OII and the concentration at time t, respectively. COD of the real textile wastewater was determined using open reflux procedure based on standard method for the examination of water and wastewater [40]. The effect of various parameters such as pH (3–11), nanocatalyst dosage (0.1–0.7 g/L), PMS concentration (0.1–0.4 g/L) and ultrasonic power (100–400 W) were studied on the novel integrated US/ heterogeneous nanocatalyst /PMS process.
Results and discussion
Characterization of the nanocatalyst
The characterization of the NPs of TiO2, ZnO, Fe2O3 and TiO2–FeZn NPs nanocatalyst were performed by XRD measurements (Fig. 1a–d). The XRD patterns of TiO2–FeZn show sharp peaks at 2θ values of 25.28, 27, 30, 35.5, 43, 53.5, 57.5, 63, 70.3 and 75.01 that correspond to 101, 110, 002, 101, 210, 105, 220, 204, 220 and 215 miller indexes, respectively. Clearly, the characteristic peaks of TiO2 are registered in this pattern (JCPDS file No. 00–021–1272) and the related peaks with crystal structure of ZnO and Fe2O3 observed. Moreover, the peak intensities of the TiO2–FeZn NPs nanocatalyst was reduced (after TiO2 doping) in comparison with those of TiO2, ZnO and Fe2O3 NPs.
Fig. 1.

XRD spectra of ZnO (blue solid line), Fe2O3 (dark blue solid line), TiO2 (green solid line) and TiO2–FeZn (red solid line) nanoparticles
The photographs of bare TiO2 and TiO2–FeZn NPs nanocatalyst, depicted in Fig. 2a–b, exhibit different color appearance. The reason for this color difference is the presence of iron in the TiO2–FeZn nanopowders. The SEM images of pure TiO2 and TiO2–FeZn are shown in Fig. 2c–d. The diameter size of pure TiO2 NPs (10–14 nm) is smaller than that of TiO2–FeZn (15–22 nm). The morphology of TiO2 remains unchanged before and after doping and shows a high–density and amorphous nature. Furthermore, the BET of TiO2 NPs did not change after doping them with ZnO and Fe2O3 (Table. 2). EDX spectroscopy analysis reported the elemental composition of the nanocatalyst (Fig. 2 e–f). The coexistence and well–dispersion of Zn and Fe were detected. And their mass % and atomic % is reported in Table 2. The results of the FT–IR spectra analyses for the NPs, shown in Fig. 3, indicate the absorption peaks around 500–600, 3430 and 1610 cm–1 due to the stretching vibration of O–H bond from the molecularly adsorbed water. It is important to notice that the absorption peaks recorded in the spectra of TiO2, ZnO and Fe2O3 are also shown in the FT–IR spectrum of TiO2–FeZn NPs nanocatalyst.
Fig. 2.

a and b Photographs of TiO2 and TiO2–FeZn powders, respectively, c and d SEM images of characterization of TiO2 and TiO2–FeZn samples, respectively, and e and f EDX of TiO2 and TiO2–FeZn samples, respectively
Table 2.
Element mass and atomic percentages of main surface elements in TiO2 and TiO2–FeZn samples calculated from the SEM–EDX spectrum and the physical properties of the samples (BET surface areas and pore parameter)
| Samples | Element mass (%) | Element atomic (%) | Pore volume (cm3/g) | SBET (m2/g) | ||||||
|---|---|---|---|---|---|---|---|---|---|---|
| O2 | Ti | Fe | Zn | Ti | O2 | Zn | Fe | |||
| TiO2 | 49.07 | 50.93 | 0.00 | 0.00 | 24.35 | 75.65 | 0.00 | 0.00 | 4.9 | 0.007 |
| TiO2–Fe2O3–ZnO | 51.02 | 46.98 | 0.55 | 1.45 | 26.4 | 72.80 | 0.55 | 0.24 | 4.9 | 0.008 |
Fig. 3.

FT–IR spectra of TiO2–FeZn (red solid line), TiO2 (blue solid line), ZnO (green solid line), and Fe2O3 (brown solid line)
Decolorization of OII at different processes
To observe the activation of PMS by ultrasound, the decolorization efficiency of OII was performed by TiO2/PMS/US and TiO2–FeZn /PMS/US treatment processes under the same operational conditions. As can clearly be seen in Fig. 4a, the OII degradation efficiency of the former (54%) is lower than the later (95%). This is attributed to the presence of Zn and Fe in the TiO2–FeZn nanopowders structure that facilitated the degradation of OII in aqueous phase since low contribution of US (3%) and PMS (7.5%) in dye degradation was observed at 60 min of reaction, as depicted in Fig. 4b. This is explained by the limited ability of (i) US to generate sufficient hydroxyl radicals and (ii) PMS to produce enough sulfate and hydroxyl radicals to oxidize the OII molecules [6, 41]. Nevertheless, 33% removal efficiency was achieved by combining PMS with US (PMS/US) which is attributed to the activation of PMS by ultrasonic irradiation [6, 41]. Combining TiO2–FeZn with US and TiO2–FeZn with PMS the OII degradation increased to 63% and 65%, respectively, as shown in Fig. 4b. Thus, the novel combination process (TiO2-FeZn NPs/PMS/US) exhibited the maximum decolorization efficiency (95%) using the combination of US/ heterogeneous TiO2–FeZn NPs/PMS. The use of semiconductors with ultrasound leads to an increase in the velocity of cavitation bubble formation that results in the production of hydroxyl radicals. Furthermore, the ultrasonic irradiation also activates the PMS to produce sulfate radicals that are more efficient for organic matter degradation than the hydroxyl radicals. The efficiency of the process is increased with TiO2, ZnO, and Fe2O3 NPs serving as a solid material to create cavitation events under the ultrasonic field that produce sonoluminescence (flashes of light) upon bubble collapse at the solid/liquid interface. Therefore, these nanoparticle catalysts can be photoactivated by flashes of light generating more radical species that degrade dye contaminants. The generated and radicals attack the dye molecules and OII decomposition occurs [6, 42, 43]. Based on the results, the novel integrated TiO2–FeZn NPs/PMS/US process was selected to carry out further experiments.
Fig. 4.

Comparison of a TiO2 NPs/PMS/US with TiO2–FeZn NPs/PMS/US, b different processes on decolorization of OII, and c the plot between ln (OII0/OIIt) and time for determine the reaction rate constant of the pseudo-first order kinetic model under experiment conditions: 15 mg/L initial OII concentration, 0.7 g/L catalyst dosage, 300 W ultrasonic power, 0.2 g/L PMS concentration and pH 3
The pseudo–first order kinetic model, Eq. (6), was applied to study the kinetics of OII decomposition.
| 6 |
In this equation, k (min–1) is the reaction rate constant. OII0 and OIIt are the concentrations of the influent and effluent dye (mg/L), respectively, at given time (t, min). The reaction rate constant of OII discoloration was determined from the slope of the reaction time vs ln (OIIt /OII0) plot. As can be seen in Fig. 4c, the reaction rate constants obtained for different processes in this study, i.e., TiO2–FeZn NPs/PMS/US, TiO2–FeZn NPs /PMS, TiO2–FeZn NPs /US, PMS/US, TiO2–FeZn NPs, PMS and US were 0.04, 0.0171, 0.0163, 0.0073, 0.006, 0.002 and 0.001 min–1, respectively. It can be inferred from these data that the reaction rate constants for the advanced oxidation hybrid process (TiO2–FeZn NPs /PMS/US) is four times higher than each of the individual processes. Consequently, the synergistic effect of this hybrid process can be calculated by an Enhancement index (EI) using the following Eq. [44].
| 7 |
Based on Eq. (7), if the value of EI is less than 1, which indicates an antagonistic impact, it means that the simultaneous impact is less than the sum of the individual effects and if its value is greater than 1, it reveals a synergistic influence on the hybrid advanced destructive process. In this work, the EI value for the TiO2–FeZn NPs/ PMS/US process was 4.44 and confirmed a great synergistic influence when a hybrid AOPs combination is applied. Indeed, the addition of PMS and US in the presence of NPs can synergistically enhance the generation of hydroxyl and sulfate radicals.
Influence of the main operational parameters on OII degradation in nanocatalyst/PMS/US process
The degradation efficiency of OII was investigated under five main operational parameters including the solution pH, nanocatalyst dosage, initial concentration of OII, ultrasonic power and PMS concentration. Therefore, the influence of these operational parameters on the OII degradation was studied.
Influence of solution pH
The pH of solution plays an important role in the oxidation of organic compounds in the advanced oxidation processes to generate free radicals. Thus, the pH effect on OII decolorization as a function of time was studied and the results are shown in Fig. 5a. As can be seen, by increasing the pH of the solution from 3 to 11, the percentage dye degradation decreases from 92% to 35.33%. Thus, acidic conditions are favorable for OII degradation by the TiO2–FeZn NPs/PMS /US process. According to Fig. 5b, the reaction rate constant (k) values were 0.059, 0.040, 0.027, 0.016 and 0.011 min–1 for 3, 5, 7, 9, and 11 pH values, respectively, indicating that the process has a high reaction rate in the acidic medium (pH 3). This phenomenon is attributed to the stability of PMS in acidic pH and also to its activation to generate sulfate radicals () that are easily formed at low pH values. A possible explanation for the decreased degradation efficiency at basic pH values using the activation of PMS with US and the TiO2–FeZn NPs is that the surface charge of the NPs is negatively charged at pH > pHpzc = 7.2 (Fig. 6). Thus, the negatively–charge NP surface in contact with negatively–charge radical species () might hinder the conversion of to [4, 18, 19]. The pHzpc of the TiO2–FeZn sonocatalyst plays a critical role for the interaction between sonocatalyst surface and OII dye molecules. To determine the pHzpc of TiO2–FeZn NPs catalyst, the change in pHf (final pH) was plotted as a function of pHi (initial pH). Therefore, the point of intersection of the curves of pHf and pHi gives the value of pHzpc = 7.2, which is considered as the pHzpc of the sonocatalyst surface, shown in Fig. 6. At alkaline pH, the exclusion occurs between species of PMS and nanocatalyst. When the solution pH is acidic, H+ production prevents the reaction between HSO5– and the nanocatalyst surface [41].
Fig. 5.

a Effect of pH on decolorization of OII under experimental conditions: 15 mg/L initial OII concentration, 0.5 g/L catalyst dosage, 300 W ultrasonic power, 0.2 g/L PMS concentration, b the reaction rate kinetics during 40 min degradation
Fig. 6.
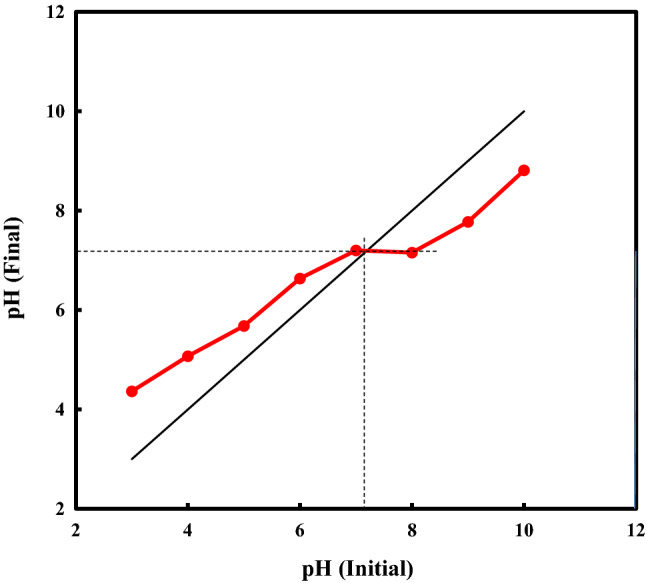
Plot for the determination of pHzpc of TiO2–FeZn nanocatalyst
Influence of nanocatalyst dosage
Figure 7a shows the influence of the nanocatalyst dose on OII degradation. As can be seen, by increasing the nanocatalyst dose from 0.1 to 0.7 g/L, the degradation rate increased from 68.86% to 99.9%. According to Fig. 7b, the reaction rate constant (k) values increased to 0.0277, 0.0419, 0.059, and 0.114 min–1, for nanocatalyst doses of 0.1, 0.3, 0.5 and 0.7 g/L, respectively, indicating that the process has a high reaction rate at the highest doses of nanocatalyst in aqueous solutions, in agreement with the efficiency of the degradation rate. It can be attributed to the presence of more active sites on nanocatalyst level with increasing nanocatalyst dosage and resulting generation of reactive radicals [6]. At higher dose, conflict between the dye and the NPs is more and sound waves have more effect. The presence of TiO2 NPs provide nucleation sites to increase the number of bubble collapse with the subsequent formation of more free radicals.
Fig. 7.

a Effect of catalyst dosage on decolorization of OII under experimental conditions: 15 mg/L initial OII concentration, pH = 3, 300 W ultrasonic power, 0.2 g/L PMS concentration and b the reaction rate kinetics during 40 min reaction of the catalyst dosage
Influence of initial OII concentration
Effect of OII dye concentration (10–30 mg/L) on the OII degradation rate was also studied, as depicted in Fig. 8a. According to these results, the degradation efficiency decreases by increasing the dye concentration, falling from 100% for dye concentration = 10 and 15 mg/L to 56.46% at 30 mg/L at 40 min. As depicted in Fig. 8b, the values of the reaction rate constant (k) obtained were 0.122, 0.114, 0.0455, and 0.0203 min–1, for OII dye concentrations of 10, 15, 20, and 30 mg/L, respectively, indicating that the process has a high reaction rate at the lowest concentration of OII dye in aqueous solutions, according to the efficiency of the degradation rate. This is attributed to the need of more free radicals (, ) available for the oxidation of dye molecules when their concentration is > 15 mg/L. At low dye concentrations, increase in reaction time leads to the formation of more reaction of formed radicals with dye molecules [6, 41, 45].
Fig. 8.

a Effect of initial dye concentration on decolorization of OII under experimental conditions: 0.7 g/L catalyst dosage, pH = 3, 300 W ultrasonic power, 0.2 g/L PMS concentration, and b the reaction rate kinetics during 40 min reaction of the initial dye concentration
Influence of ultrasonic power
The ultrasonic power is another important factor that influences the efficiency of dye degradation. According to Fig. 9a, an increase in the ultrasonic power leads to an increase in OII degradation. Thus, a 100% degradation efficiency is reached using an ultrasonic power of 300 W and 400 W at 40 min of reaction. Therefore, 300 W ultrasonic power was selected for subsequent experiments. Figure 9b shows the values of the reaction rate constants (k) that were obtained: 0.0161, 0.0267, 0.114, and 0.115 min–1, corresponding to ultrasonic power of 100, 200, 300 and 400 W, respectively, indicating that the process has a high reaction rate at the highest ultrasonic power in the aqueous solutions, consistent with the degradation rate efficiency. Increasing ultrasonic power exacerbates the oxidants decomposition for generation of free radicals. The higher ultrasonic power raises system energy and mass transfer in the solution that consequently improves cavitation performance, forming micro stream and generation of ·•OH radicals [46]. Therefore, cavitation bubble collapse and mass transfer increase the dye degradation efficiency [47].
Fig. 9.

a Effect of ultrasonic power on decolorization of OII under experimental conditions: 0.7 g/L catalyst dosage, pH = 3, 15 mg/L initial dye concentration, 0.2 g/L PMS concentration and b the reaction rate kinetics during 40 min reaction of the ultrasonic power
Influence of PMS concentration
Figure 10a shows that by increasing the PMS concentration from 0.1 to 0.25 g/L, the OII degradation rate increased from 63 to 100%. However, the degradation efficiency decreased (95%) when the PMS concentration was increased to 0.3 g/L. An increase in the dose of PMS can lead to the production of more active radicals [4, 41]. Therefore, at a higher concentration of PMS, more species of HSO5– are generated, leading to the consumption of active radicals such as Eq. (8) and •OH Eq. (9). Negative effects of radical reactions Eqs. (8) and (10) can occur before reacts with the organic dye [48] with the consequent decrease in the rate of OII degradation [47] and therefore the degradation efficiency decreases. The scavenging effect of radicals and their high concentration led to the generation of less reactive radical species Eq. (8) and the production of S2O82– Eq. (10), respectively in the degradation process.
| 8 |
| 9 |
| 10 |
Fig. 10.

a Effect of PMS concentration on decolorization of OII under experimental conditions: 0.7 g/L catalyst dosage, pH = 3, 15 mg/L initial dye concentration, 300 W ultrasonic power and b the reaction rate kinetics during 40 min reaction of the PMS concentration
Figure 10b shows the reaction rate constant (k) values of 0.0263, 0.0367, 0.07, 0.117 and 0.070 min–1 for PMS concentrations of 0.1, 0.15, 0.2, 0.25 and 0.3 g/L, respectively. The k values decreased at a PMS concentration of 0.3 g/L, indicating that the process has the highest reaction rate at a PMS concentration of 0.25 g/L in aqueous solutions, consistent with the degradation rate efficiency.
COD removal and decolorization
The efficiency of the US/heterogeneous nanocatalyst/PMS was studied for COD removal during the treatment of colored solution and dye mineralization (Fig. 11). The decolorization of the aqueous solution and COD removal of OII was 99.9% and 74.58%, respectively at 40 min. Decreased COD removal represents increased oxidation of the destroyed structure of the discolored colored molecule [32]. One of the reasons for reduction in COD removal is the production of some by-products that are not completely mineralized [49]. A comparison of OII dye degradation found in the current study with the literature is reported in Table 3. The result of this study competes with those reported in the literature with a degradation efficiency similar to that reported by Cai et al., [48] and with a degradation efficiency higher than that reported by Ghalebizade and Ayati [50] and Liu et al., [41].
Fig. 11.

COD value and decolorization of OII dye under experimental conditions: 0.7 g/L catalyst dosage, pH = 3, 15 mg/L initial dye concentration, 300 W ultrasonic power, 0.2 g/L PMS concentration
Table 3.
Comparison of degradation efficiency (DE) of OII dye from similar studies reported in the literature
| Reference | Process | Experimental Conditions | DE (%) |
|---|---|---|---|
| [48] | Mesoporous silica SBA–15 supported iron and cobalt (Fe–Co/SBA-15) | OII degradation increased with the higher PMS concentration (3.2 mM), reaction temperature (20 ºC), Fe–Co/SBA-15 dosage (1.0 g/L) and ultrasonic power (104.8 W/L) | 99.9 |
| [50] | Electro-peroxone process | OII dye concentration = 500 mg/L, pH = 7.7, applied current = 0.5 A, O3 rate = 1 L/min−1 and [Na2SO4] = 0.1 M | 99 |
| [41] | Magnetic Fe3O4 NPs, PMS activator under US irritation | Catalyst dose = 0.4 g/L, PMS dose = 3 mM, T = 25ºC, initial AO7 concentration = 0.06 mM, ultrasound power = 200 W, 25 mM tetraborate buffered pH 7.5 | 90 |
| Current study | TiO2–FeZn NPs /PMS/US | pH = 3, OII concentration 15 mg/L, PMS of 0.2 g/L, nanocatalyst dose of 0.7 g/L and US of 300 W | 99.9 |
Stability and reusability of the heterogeneous TiO2–FeZn NPs nanocatalyst
To scale and industrial uses, one of the important parameters is the reusability of the nanocatalyst. The reusability of the heterogeneous nanocatalyst was investigated using three consecutive runs under the optimal conditions (Fig. 12). For this purpose, the used nanocatalyst was washed with double distilled water several times and dried after each sonochemical time reaction. According to Fig. 12, the degradation efficiency decreased from 99.9% in the first run to 80.4% in the last run. This can be attributed to some loss in the amount of nanocatalyst during the washing and drying processes for the next test. Furthermore, the possibility of leaching of metal oxides from the nanocatalyst could have affected the efficiency of OII degradation.
Fig. 12.

Recyclability of TiO2–FeZn nanocatalyst using three consecutive cycles under experimental conditions: 0.7 g/L catalyst dosage, pH = 3, 15 mg/L initial dye concentration, 300 W ultrasonic power, 0.2 g/L PMS concentration
Possible OII degradation mechanism under US/heterogeneous TiO2-FeZn/PMS process
In the present study, a hybrid advanced destructive process was applied to degrade an organic compound, i.e., OII as the main model pollutant in the effluent of textile industry. As can be seen in Fig. 13, in this process, both hydroxyl and sulfate free radicals were produced and attacked the OII dye structure. The decomposition of OII dye was reported to proceed via azo bond cleavage, yielding two relatively lower molecular weight aromatic ring molecules. Subsequently, the degradation of OII continues by electrophilic addition of on the two previous aromatic rings and hydroxylated derivatives are generated. These compounds through the oxidative ring opening reaction can be converted to aliphatic carboxylic by–product intermediates. The last intermediates in the decomposition of aromatic organic compounds are carboxylic acids such as formic acid, maleic acid, oxalic acid, glycolic acid, etc. Finally, carbon dioxide and water are the end products of the oxidation of these intermediate species [44, 45, 51, 52]. Further determination of OII by–products was hampered due to the COVID-19 pandemic conditions, as all available analytical laboratories were closed; therefore, possible intermediates were reported based on the works reported in the literature.
Fig.13.

schematic of the hydroxyl and sulfate free radical generation pathway for the decomposition of organic compounds in aqueous solutions
Conclusions
In this work, heterogeneous TiO2–FeZn NPs together with ultrasound were used to activate PMS for OII dye degradation in the novel TiO2–FeZn NPs/PMS/US process. The complete OII degradation was achieved at 40 min of irradiation with US using an ultrasonic power of 300 W, in the presence of 15 mg/L dye, 0.2 g/L PMS and 0.7 g/L of nanocatalyst dose. The radicals and were the main species responsible for the degradation of the dye. The results showed that the novel integrated TiO2–FeZn NPs/PMS/US process can significantly improve the degradation of organic pollutants in textile wastewater, such as OII dye. The novel nanocatalyst showed high catalytic activity and reusability for OII degradation. Therefore, the present US/nanocatalyst/PMS system as SR–AOPs is an efficient, reusable and stable nanocatalyst for industrial scale oxidation of wastewater textile dye.
Supplementary Information
Below is the link to the electronic supplementary material.
Acknowledgements
The authors would like to thanks Ilam University of Medical Sciences (IUMS) (IR.MEDILAM.REC.1399.018) for financially support.
Author contributions
ZN: Conceptualization, Methodology, Validation, Formal analysis, Investigation, Supervision. NJ: Conceptualization, Methodology, Validation, Formal analysis. SSM: Validation, Formal analysis, Writing- review & editing, Supervision. MD: Methodology, Validation, Writing- review & editing. AA: Methodology, Writing-review & editing. SAM: Conceptualization, Methodology, Validation, Resources, Writing-original draft, Writing-review & editing, Project administration.
Declarations
Conflict of interest
The author declares that he has no competing interests.
Contributor Information
Zahra Noorimotlagh, Email: noorimotlagh.zahra@gmail.com.
Mahboobeh Dehvari, Email: mahboobehdehvari@yahoo.com.
Seyyed Abbas Mirzaee, Email: Mirzaee.seyyed@gmail.com.
Neemat Jaafarzadeh, Email: Jaafarzadeh-n@ajums.ac.ir.
Susana Silva Martínez, Email: ssilva@uaem.mx.
Ali Amarloei, Email: amarloei@yahoo.com.
References
- 1.Azbar N, Yonar T, Kestioglu K. Chemosphere. 2004;55:35. doi: 10.1016/j.chemosphere.2003.10.046. [DOI] [PubMed] [Google Scholar]
- 2.Lucas MS, Peres JA. Dyes Pigments. 2007;74:622. doi: 10.1016/j.dyepig.2006.04.005. [DOI] [Google Scholar]
- 3.Al-Momani F, Touraud E, Degorce-Dumas JR, Roussy J, Thomas O. J. Photoch. Photobio. A. 2002;153:191. doi: 10.1016/S1010-6030(02)00298-8. [DOI] [Google Scholar]
- 4.Stoyanova M, Slavova I, Ivanova V. Appl. Catal. A-Gen. 2014;476:121. doi: 10.1016/j.apcata.2014.02.024. [DOI] [Google Scholar]
- 5.Ghaneian MT, Jamshidi B, Dehvari M, Amrollahi M. Res. Chem. Intermediat. 2015;41:3223. doi: 10.1007/s11164-013-1427-2. [DOI] [Google Scholar]
- 6.Liu F, Yin P, Wang X, Gao H, Zhang H. Sep. Purif. Technol. 2018;194:181. doi: 10.1016/j.seppur.2017.10.072. [DOI] [Google Scholar]
- 7.Farhadi S, Siadatnasab F, Khataee A. Ultrason. Sonochem. 2017;37:298. doi: 10.1016/j.ultsonch.2017.01.019. [DOI] [PubMed] [Google Scholar]
- 8.Mirzaee SA, Bayati B, Valizadeh MR, Gomes HT, Noorimotlagh Z. Chem. Eng. Res. Des. 2021;167:116. doi: 10.1016/j.cherd.2020.12.025. [DOI] [Google Scholar]
- 9.Mirzaee SA, Jaafarzadeh N, Gomes HT, Jorfi S, Ahmadi M. Chem. Eng. J. 2019;370:372. doi: 10.1016/j.cej.2019.03.202. [DOI] [Google Scholar]
- 10.Asad S, Amoozegar MA, Pourbabaee AA, Sarbolouki MN, Dastgheib SMM. Bioresour. Technol. 2007;98:2082. doi: 10.1016/j.biortech.2006.08.020. [DOI] [PubMed] [Google Scholar]
- 11.Lodha B, Chaudhari S. J. Hazard. Mater. 2007;148:459. doi: 10.1016/j.jhazmat.2007.02.061. [DOI] [PubMed] [Google Scholar]
- 12.Jaafarzadeh N, Baboli Z, Noorimotlagh Z, Silva-Martínez S, Ahmadi M, Alavi S, Mirzaee SA. Desalin. Water Treat. 2019;154:177. doi: 10.5004/dwt.2019.23897. [DOI] [Google Scholar]
- 13.Soltani RDC, Khataee AR, Safari M, Joo SW. Int. Biodeter. Biodegr. 2013;85:383. doi: 10.1016/j.ibiod.2013.09.004. [DOI] [Google Scholar]
- 14.Thokchom B, Pandit AB, Qiu P, Park B, Choi J, Khim J. Ultrason. Sonochem. 2015;27:210. doi: 10.1016/j.ultsonch.2015.05.015. [DOI] [PubMed] [Google Scholar]
- 15.Wang J, Wang S. Chem. Eng. J. 2018;334:1502. doi: 10.1016/j.cej.2017.11.059. [DOI] [Google Scholar]
- 16.Lee H, Lee HJ, Jeong J, Lee J, Park NB, Lee C. Chem. Eng. J. 2015;266:28. doi: 10.1016/j.cej.2014.12.065. [DOI] [Google Scholar]
- 17.Oh WD, Dong Z, Lim TT. Appl. Catal. B-Environ. 2016;194:169. doi: 10.1016/j.apcatb.2016.04.003. [DOI] [Google Scholar]
- 18.Waldemer RH, Tratnyek PG, Johnson RL, Nurmi JT. Environ. Sci. Technol. 2007;41:1010. doi: 10.1021/es062237m. [DOI] [PubMed] [Google Scholar]
- 19.Wang WH, Wang WH, Hoag GE, Collins JB, Naidu R. Water. Air. Soil. Poll. 2013;224:1733. doi: 10.1007/s11270-013-1733-8. [DOI] [Google Scholar]
- 20.Ghanbari F, Moradi M. Chem. Eng. J. 2017;310:41. doi: 10.1016/j.cej.2016.10.064. [DOI] [Google Scholar]
- 21.Neppolian B, Bruno A, Bianchi CL, Ashokkumar M. Ultrason. Sonochem. 2012;19:9. doi: 10.1016/j.ultsonch.2011.05.018. [DOI] [PubMed] [Google Scholar]
- 22.Zhu L, Meng ZD, Park CY, Ghosh T, Oh WC. Ultrason. Sonochem. 2013;20:478. doi: 10.1016/j.ultsonch.2012.08.005. [DOI] [PubMed] [Google Scholar]
- 23.Flint EB, Suslick KS. J. Am. Chem. Soc. 1989;111:6987. doi: 10.1021/ja00200a014. [DOI] [Google Scholar]
- 24.Putterman SJ, Weninger KR. Annu. Rev. Fluid Mech. 2000;32:445. doi: 10.1146/annurev.fluid.32.1.445. [DOI] [Google Scholar]
- 25.Kurian M. Clean. Eng. Technol. 2021;2:100090. [Google Scholar]
- 26.Matula TJ. Philos. T. Roy. Soc. A. 1999;357:225. doi: 10.1098/rsta.1999.0325. [DOI] [Google Scholar]
- 27.Birkin PR, Offin DG, Joseph PF, Leighton TG. J. Phys. Chem. B. 2005;109:16997. doi: 10.1021/jp051619w. [DOI] [PubMed] [Google Scholar]
- 28.Kudryashova O, Vorozhtsov S. JOM. 2016;68:1307. doi: 10.1007/s11837-016-1851-z. [DOI] [Google Scholar]
- 29.Ahmad M, Ahmed E, Hong ZL, Ahmed W, Elhissi A, Khalid NR. Ultrason. Sonochem. 2014;21:761. doi: 10.1016/j.ultsonch.2013.08.014. [DOI] [PubMed] [Google Scholar]
- 30.Wang J, Guo Y, Liu B, Jin X, Liu L, Xu R, Kong Y, Wang B. Ultrason. Sonochem. 2011;18:177. doi: 10.1016/j.ultsonch.2010.05.002. [DOI] [PubMed] [Google Scholar]
- 31.Khataee A, Sheydaei M, Hassani A, Taseidifar M, Karaca S. Ultrason. Sonochem. 2015;22:404. doi: 10.1016/j.ultsonch.2014.07.002. [DOI] [PubMed] [Google Scholar]
- 32.Li J, Suyoulema, Wang W, Sarina Solid. State. Sci. 2009;11:2037. doi: 10.1016/j.solidstatesciences.2009.09.012. [DOI] [Google Scholar]
- 33.Venditti F, Cuomo F, Ceglie A, Avino P, Russo MV, Lopez F. Langmuir. 2015;31:3627. doi: 10.1021/acs.langmuir.5b00560. [DOI] [PubMed] [Google Scholar]
- 34.Noorimotlagh Z, Kazeminezhad I, Jaafarzadeh N, Ahmadi M, Ramezani Z. Catal. Today. 2020;348:277. doi: 10.1016/j.cattod.2019.08.051. [DOI] [Google Scholar]
- 35.Noorimotlagh Z, Soltani RDC, Khorramabadi GhS, Godini H, Almasian M. Desalin. Water Treat. 2016;57:1684. doi: 10.1080/19443994.2014.977954. [DOI] [Google Scholar]
- 36.Marković D, Šaponjić Z, Radoičić M, Radetić T, Vodnik V, Potkonjak B, Radetić M. Ultrason. Sonochem. 2015;24:221. doi: 10.1016/j.ultsonch.2014.11.017. [DOI] [PubMed] [Google Scholar]
- 37.Velegraki T, Poulios I, Charalabaki M, Kalogerakis N, Samaras P, Mantzavinos D. Appl. Catal. B-Environ. 2006;62:159. doi: 10.1016/j.apcatb.2005.07.007. [DOI] [Google Scholar]
- 38.Nourmoradi H, Ghiasvand A, Noorimotlagh Z. Desalin. Water Treat. 2015;55:252. doi: 10.1080/19443994.2014.914449. [DOI] [Google Scholar]
- 39.Noorimotlagh Z, Kazeminezhad I, Jaafarzadeh N, Ahmadi M, Ramezani Z, Silva-Martinez S. J. Hazard. Mater. 2018;350:108. doi: 10.1016/j.jhazmat.2018.02.022. [DOI] [PubMed] [Google Scholar]
- 40.W.E. Federation and A. Association, Standard methods for the examination of water and wastewater. American Public Health Association (Washington, DC, USA, 2005), p. 21
- 41.Liu J, Zhou J, Ding Z, Zhao Z, Xu X, Fang Z. Ultrason. Sonochem. 2017;34:953. doi: 10.1016/j.ultsonch.2016.08.005. [DOI] [PubMed] [Google Scholar]
- 42.Khataee A, Mohamadi FT, Rad TS, Vahid B. Ultrason. Sonochem. 2018;40:361. doi: 10.1016/j.ultsonch.2017.07.021. [DOI] [PubMed] [Google Scholar]
- 43.Khataee A, Arefi-Oskoui S, Samaei L. Ultrason. Sonochem. 2018;40:703. doi: 10.1016/j.ultsonch.2017.08.014. [DOI] [PubMed] [Google Scholar]
- 44.Ghanbari F, Zirrahi F, Lin KYA, Kakavandi B, Hassani A. J. Environ. Chem. Eng. 2020;8:104167. doi: 10.1016/j.jece.2020.104167. [DOI] [Google Scholar]
- 45.Liu H, Li G, Qu J, Liu H. J. Hazard. Mater. 2007;1:180. doi: 10.1016/j.jhazmat.2006.10.009. [DOI] [PubMed] [Google Scholar]
- 46.Khataee A, Hassandoost R, Pouran SR. Ultrason. Sonochem. 2018;41:626. doi: 10.1016/j.ultsonch.2017.10.028. [DOI] [PubMed] [Google Scholar]
- 47.Wei C, Zhang J, Zhang Y, Zhang G, Zhou P, Li W, Liang J, Liu Y, Zhang W. Water Sci. Technol. 2017;76:1436. doi: 10.2166/wst.2017.316. [DOI] [PubMed] [Google Scholar]
- 48.Cai C, Zhang H, Zhong X, Hou L. J. Hazard. Mater. 2015;283:70. doi: 10.1016/j.jhazmat.2014.08.053. [DOI] [PubMed] [Google Scholar]
- 49.Soltani RDC, Shams-Khoramabadi Gh, Godini H, Noorimotlagh Z. Desalin. Water Treat. 2015;56:2551. doi: 10.1080/19443994.2014.964781. [DOI] [Google Scholar]
- 50.Ghalebizade M, Ayati B. Chemosphere. 2019;235:1007. doi: 10.1016/j.chemosphere.2019.06.211. [DOI] [PubMed] [Google Scholar]
- 51.Eslami A, Mehdipour F, Lin KYA, Maleksari HS, Mirzae F, Ghanbari F. J. Water. Process. Eng. 2020;33:100998. doi: 10.1016/j.jwpe.2019.100998. [DOI] [Google Scholar]
- 52.Zhong X, Xiang L, Royer S, Valange S, Barrault J, Zhang H. J. Chem. Technol. Biot. 2011;86:970. doi: 10.1002/jctb.2608. [DOI] [Google Scholar]
Associated Data
This section collects any data citations, data availability statements, or supplementary materials included in this article.