

Abstract
Immune‐mediated hypersensitivities such as autoimmunity, allergy, and allogeneic graft rejection are treated with therapeutics that suppress the immune system, and the lack of specificity is associated with significant side effects. The delivery of disease‐relevant antigens (Ags) by carrier systems such as poly(lactide‐co‐glycolide) nanoparticles (PLG‐Ag) and carbodiimide (ECDI)‐fixed splenocytes (SP‐Ag) has demonstrated Ag‐specific tolerance induction in model systems of these diseases. Despite therapeutic outcomes by both platforms, tolerance is conferred with different efficacy. This investigation evaluated Ag loading and total particle dose of PLG‐Ag on Ag presentation in a coculture system of dendritic cells (DCs) and Ag‐restricted T cells, with SP‐Ag employed as a control. CD25 expression was observed in nearly all T cells even at low concentrations of PLG‐Ag, indicating efficient presentation of Ag by dendritic cells. However, the secretion of IL‐2, Th1, and Th2 cytokines (IFNγ and IL‐4, respectively) varied depending on PLG‐Ag concentration and Ag loading. Concentration escalation of soluble Ag resulted in an increase in IL‐2 and IFNγ and a decrease in IL‐4. Treatment with PLG‐Ag followed a similar trend but with lower levels of IL‐2 and IFNγ secreted. Transcriptional Activity CEll ARrays (TRACER) were employed to measure the real‐time transcription factor (TF) activity in Ag‐presenting DCs. The kinetics and magnitude of TF activity was dependent on the Ag delivery method, concentration, and Ag loading. Ag positively regulated IRF1 activity and, as carriers, NPs and ECDI‐treated SP negatively regulated this signaling. The effect of Ag loading and dose on tolerance induction were corroborated in vivo using the delayed‐type hypersensitivity (DTH) and experimental autoimmune encephalomyelitis (EAE) mouse models where a threshold of 8 μg/mg Ag loading and 0.5 mg PLG‐Ag dose were required for tolerance. Together, the effect of Ag loading and dosing on in vitro and in vivo immune regulation provide useful insights for translating Ag‐carrier systems for the clinical treatment of immune disorders.
Keywords: autoimmune, nanoparticles, tolerance
1. INTRODUCTION
Undesired immune activation against self‐antigen (Ag), allergens, or donor Ags can lead to debilitating autoimmunity, life‐threatening allergies, or graft rejection, respectively (Pearson, Casey, Hughes, Miller, et al., 2017). Clinically, no therapies provide a cure for these pathological conditions, yet the disease may be managed with broadly acting immunosuppressive therapies. However, immunosuppression increases the risk of opportunistic infections and the development of cancer (Adami et al., 2003; Calabrese & Molloy, 2008). There is an unmet clinical demand for therapies that reprogram pathogenic immune cells while preserving the protective repertoire of immune cells. This so‐called Ag‐specific immune tolerance has been demonstrated experimentally using Ag delivery modalities that utilize peripheral tolerance mechanisms to enforce systemic tolerance (Luo et al., 2016).
One of the earliest Ag carriers to experimentally induce Ag‐specific tolerance was Ag‐coupled splenocytes (SP‐Ag) (S. Miller et al., 1979). The peptide conjugation process is mediated by the crosslinker 1‐ethyl‐3‐(3‐dimethylaminopropyl)carbodiimide (ECDI). This coupling reaction induces apoptosis in the splenocytes resulting in an in vivo clearance of SP‐Ag by macrophages in the spleen, resembling the natural clearance of circulating apoptotic cells (Getts et al., 2011). This biomimetic process utilizes the body's natural peripheral tolerance processes. SP‐Ags have demonstrated Ag‐specific tolerance in animal models of Th1/17‐ and Th2‐mediated hypersensitivities and allogeneic transplantation, as well as safety in a clinical trial for the treatment of multiple sclerosis (Luo et al., 2008; Lutterotti et al., 2013; Smarr et al., 2011; Turley & Miller, 2007). However, clinical translation of this strategy is complicated by the patient‐specific ex vivo manipulation of cells, which is costly and requires skilled technicians.
PLG nanoparticles are being investigated as alternative Ag‐carriers that are biodegradable, tunable, and manufacturable at large scale (Pearson, Casey, Hughes, Miller, et al., 2017), (Truong et al., 2021). Ag has been incorporated into NPs by encapsulation, surface conjugation, and as Ag‐polymer conjugates (D. R. Getts et al., 2012; McCarthy et al., 2017; Pearson, Casey, Hughes, Miller, et al., 2017; Tostanoski et al., 2016). These NPs can be further modified with immunomodulators to enhance their tolerogenic capabilities (Casey et al., 2017; Cho et al., 2017; Maldonado et al., 2015). The tolerogenic versatility of NPs has been demonstrated in animal models of Th1/17, Th2, and allogeneic models, and recently completed a phase 2a clinical trial for the treatment of celiac disease (Freitag et al., 2020; Kelly et al., 2021; Pearson, Casey, Hughes, Wang, et al., 2017). Despite similar tolerogenic outcomes, PLG‐Ag and SP‐Ag appear to induce tolerance with different mechanisms of action. In an allogeneic islet transplant model, injections of donor ECDI‐SP produced a 70% graft survival compared to donor lysates delivered by poly(lactide‐co‐glycolide) (PLG) particles which provided a 20% graft survival (and 60% survival with a short course of rapamycin) (Bryant et al., 2014; Luo et al., 2008). Additionally, a therapeutic dose of ECDI‐treated splenocytes is on the order of 107−108 cells, whereas a therapeutic dose of particles tends to be between 1 and 3 mg of NPs (on the order of 1010 particles) indicating that splenocytes may induced tolerance more efficiently on a per unit basis (Bryant et al., 2014; Hunter et al., 2014; Tan et al., 1992). The differences in tolerogenic efficiency between ECDI‐SP and PLG‐Ag carriers remain uncharacterized.
This investigation aimed to systematically evaluate the immunological outcomes of Ag‐containing PLG NPs (PLG‐Ag) on innate and adaptive immunity using a model system of bone marrow–derived dendritic cells (DCs) and T cells. Transcriptional Activity CEll ARrays (TRACER) were employed to measure DC transcription factor activity induced during PLG‐Ag treatment and Ag presentation to T cells. In parallel, T‐cell expression of the high‐affinity IL‐2 receptor (CD25) was measured to quantify T‐cell Ag‐recognition, and T‐cell differentiation was characterized by measuring Th1‐ and Th2‐associated cytokine secretion, with SP‐Ag used as a control. A range of PLG‐Ag concentrations and Ag densities were evaluated to determine delivery and Ag loading effects on DC:T‐cell signaling. Finally, delayed‐type hypersensitivity (DTH) and experimental autoimmune encephalomyelitis (EAE) mouse models were utilized to determine the effect of Ag loading and NP dosing on tolerance outcomes.
2. MATERIALS AND METHODS
2.1. Materials
Acid‐terminated 50:50 poly(d,l‐lactide‐co‐glycolide) (PLG) (∼0.17 dl/g inherent viscosity in hexafluoro‐2‐propanol) was purchased from Lactel Absorbable Polymers. Poly(ethylene‐alt‐maleic anhydride) (PEMA) was purchased from Polysciences, Inc. Amine‐terminated ovalbumin peptide (NH2‐OVA323‐339) (OVA), and proteolipid peptide (NH2‐PLP139‐15) (PLP), were purchased from Genscript. LPS from Escherichia coli serotype O111:B4 was purchased from Sigma‐Aldrich. N‐(3‐Dimethylaminopropyl)‐N′‐ethylcarbodiimide hydrochloride (ECDI) was purchased from Millipore.
2.2. Nanoparticle preparation
PLG‐OVA nanoparticles were fabricated from OVA‐PLG bioconjugates using an oil‐in‐water (o/w) emulsion solvent evaporation (SE) technique as previously described (Pearson, Casey, Hughes, Wang, North, Getts, Miller, Shea 2017). Briefly, 400 mg of the acid‐terminated PLG and OVA‐PLG polymer conjugate (total OVA concentration 8 μg/mg) was dissolved in 2 ml of dichloromethane (DCM). This organic phase was added to 10 ml of 1% PEMA and sonicated for 30 s at 100% amplitude using a Cole‐Parmer Ultrasonic processor (Model XPS130). The emulsion was added to 200 ml of magnetically stirred 0.5% PEMA overnight to allow for DCM evaporation. The nanoparticles were washed by centrifugation at 7000 rcf for 15 min and washed twice with 0.1 M sodium bicarbonate buffer and a final wash using water. Sucrose (4% w/v) and mannitol (3% w/v) were used as cryoprotectants and the particles were lyophilized for 48 h before use. The size and zeta potential of the nanoparticles were determined in water by dynamic light scattering (DLS) using a Malvern Zetasizer ZSP. The nanoparticles had a z‐average diameter of 470 nm ± 16 nm with a zeta potential of −45 ± 0.5 mV. Antigen loading is reported as the proportion of PLG‐Ag used in the fabrication of the particles. Representative batches of NPs were tested for endotoxin using a chromogenic LAL endotoxin quantitation kit and found to be below the assay detection limit (<0.1 EU/ml; Thermo Fisher Scientific).
2.3. Mice
Female C57BL/6J, BALB/c, and OT‐II mice (B6.Cg‐Tg(TcraTcrb)425Cbn/J) (6–9 weeks old) were purchased from The Jackson Laboratories. SJL/J mice (6–9 weeks old) were purchased from Envigo Laboratories. Mice were housed under specific pathogen‐free conditions in the University of Michigan Unit for Laboratory Animal Medicine or at the Northwestern University Center for Comparative Medicine. All mice procedures and experiments were compliant with the protocols of the University of Michigan Animal Care and Use Committee or approved by the Institutional Animal Care and Use Committee of Northwestern University.
2.4. Antibodies and flow cytometry
Antibodies were purchased from BioLegend. Flow cytometry was performed using a Beckman Coulter CytoFLEX S. Analysis was performed using FlowJo software. Anti‐CD16/32 antibody was used to block nonspecific binding before staining with CD4 (RM4‐4) and CD25 (PC61). Cell viability was measured with 4′,6‐diamidino‐2‐phenylindole, dilactate (DAPI) (Biolegend).
2.5. Bone marrow–derived antigen‐presenting cells
Bone marrow was harvested from the tibia and femurs of C57BL/6J mice to differentiate DCs. Cells were cultured in RPMI‐1640 supplemented with GlutaMAX (Life Technologies), penicillin (100 units/ml), streptomycin (100 mg/ml), 10% heat‐inactivated fetal bovine serum (FBS) (Invitrogen Corporation), 50 µM β‐mercaptoethanol, and 20 ng/ml of granulocyte‐macrophage colony‐stimulating factor (GM‐CSF) (Peprotech). Cultures were found to be >85% CD11c+ by flow cytometry at Day 10 of culture.
2.6. Antigen‐coupled ECDI‐treated splenocytes
OVA was coupled to C57BL/6 splenocytes using ECDI as described previously (Turley & Miller, 2007). Briefly, spleens were harvested and dissociated through a 70 μm nylon strainer. Red blood cells were lysed with ACK buffer. OVA was coupled via ECDI to splenocytes (3.2 × 10⁸ splenocytes/ml, 30.75 mg/ml ECDI, 1 mg/ml OVA) in phosphate‐buffered saline (PBS) shaking on ice for 1 h. Cells were washed by centrifugation and filtered.
2.7. DC:T cell cocultures and TRACER
On Day 7 of culture, bone marrow–derived DCs were transduced with transcription factor reporters for measurement in the dynamic TRanscriptional Activity CEll aRray (TRACER) (Decker et al., 2017; Weiss et al., 2010). The TF reporters, delivered in self‐inactivating lentivirus, consist of TF response elements cloned upstream of a minimal thymidine kinase promoter that expresses the firefly luciferase protein (Fluc). The methods for designing reporter constructs and determining reporter binding specificity have been described in detail previously (Decker et al., 2017; Peñalver Bernabé et al., 2016). Day −7 DCs were transduced with lentiviral reporter constructs at a multiplicity of infection (MOI) of 80 and seeded in black 96‐well plates at a density of 5 × 10⁴ cells/well and cultured for a minimum of 48 h. Each well receives a single lentiviral reporter and has a minimum of three technical replicates. After 48 h, media replenished and supplemented with 1 mM d‐Luciferin (Promega Corporation) to enable the measurement of Fluc activity by bioluminescence imaging (Perkin Elmer IVIS Spectrum). Naïve CD4 T cells were isolated from OT‐II mice, or BALB/c mice (for allogeneic stimulation) using a naïve CD4 T‐cell isolation kit (Miltenyi) and coincubated with DCs at 5 × 10⁴ cells/well. Soluble OVA, PLP, PLG‐OVA NPs, and SP‐OVA were added to the DCs at time 0 (the same time as naïve CD4 T cells). Bioluminescence intensity (BLI) was measured at several time points (typically 0, 2, 4, 6, 8, 24, 48, and 72 h) based on preliminary experiments using this culture system. For TRACER analysis, in all treatment groups each TF was examined was normalized and statistical significance determined using methodology previously described (Decker et al., 2017; Rao et al., 2017). Briefly, for each timepoint the background signal measured in a non‐transduced cell control was subtracted from each BLI measurement and then normalized to the corresponding treatment's minimal TA control reporter to give the log2 fold‐change in BLI. Heatmaps were generated by averaging the replicate log2 fold‐change for each reporter condition and time point. Statistical analysis was carried out using the limma R package (Ritchie et al., 2015).
2.8. Cytokine detection
Murine IL‐2, IL‐4, and IFNγ were measured in cell culture supernatants by enzyme‐linked immunosorbent assays (ELISA) (R&D Systems) performed by the University of Michigan Cancer Center Immunology Core.
2.9. Delayed type hypersensitivity
C57BL/6 mice were immunized by subcutaneous injection of 100 μl of 1 mg/ml OVA323‐339/CFA emulsion, distributed across three spots on the back and hind flanks. Mice treated prophylactically received NPs injections on Day −7 relative to immunization, with intradermal Ag challenge on Day 14. Mice treated therapeutically received intravenous NP injections on Day 10 postimmunization, with intradermal Ag challenge on Day 14. Baseline pinna thickness was measured using a digital caliper (Mitutoyo). Control ears were injected intradermally with 10 μl of PLP (1 mg/ml in PBS) and experimental ears were injected with 10 μl of OVA (1 mg/ml in PBS) (Hamilton). Twenty‐four hours later, pinna thickness was remeasured and change in ear thickness was calculated.
2.10. Experimental autoimmune encephalomyelitis
Relapsing‐remitting EAE was induced by immunization with encephalitogenic PLP139‐151 peptide as described previously (Miller et al., 2010). Briefly, SJL/J mice were immunized by subcutaneous injection of 100 μl of 1 mg/ml PLP139−151/complete Freund's adjuvant (CFA) (Difco) distributed across three spots on the nape and hind flanks. Disease severity scores were determined by blinded observers using a 0 to 5 point scale: 0 = no disease, 1 = limp tail or hind limb weakness, 2 = limp tail and hind limb weakness, 3 = partial hind limb paralysis, 4 = complete hind limb paralysis, 5 = moribund. NPs were injected intravenously 7 days before immunization.
2.11. Statistical analyses
Results are reported as mean ± standard error mean (SEM). Significant differences between cytokine expressions were determined by one‐way analysis of variance (ANOVA) along with Tukey's multiple comparison test. Unless noted, p < 0.05 was considered to be statistically significant. In EAE experiments, differences between disease courses of more than two treatment groups were analyzed for statistical significance using the Kruskal–Wallis test (one‐way ANOVA nonparametric test) (p < 0.05). In the DTH model, significant differences between PLP and OVA‐treated ears were determined using two‐way ANOVA with Sidak's multiple comparisons test (p < 0.05). Statistical differences were determined in TF activity using the statistical analysis was performed using the linear models for microarray data limma package in R, with p values adjusted using the false discovery rate
3. RESULTS
3.1. PLG‐Ag and SP‐Ag induce differential DC IRF1 activity and Ag‐specific T‐cell responses
PLG‐Ag and SP‐Ag were evaluated for their Ag delivery efficiency and corresponding impacts on T cell phenotypes resulting from Ag‐presentation (Figure 1). Model MHC II‐restricted Ag OVA323‐339 (OVA) was delivered by PLG‐OVA, SP‐OVA, or as soluble OVA, to DCs to elicit Ag‐specific CD4 responses by OT‐II T cells. PLG‐OVA and SP‐OVA were each evaluated at multiple concentrations to compare their bioactive ranges (Figure 1a). DCs were transduced with a reporter for IRF1, a transcription factor (TF) that regulates proinflammatory gene expression, MHC II expression, and T‐cell differentiation (Kröger et al., 2002; Taki et al., 1997), to monitor the dynamic activation of T cells during Ag recognition (Figure 1b). Ag recognition by T cells was measured by the expression of high‐affinity IL‐2 receptor (CD25, Figure 1c), and the corresponding T cell response was determined by measuring Th1‐ and Th2‐associated cytokines (IL‐2 and IFNγ and IL‐4, respectively, Figure 1d). At the lowest concentration of soluble OVA tested (10 ng/ml), a gradual distribution of CD25 expression on T cells and low levels of secreted IL‐2, IL‐4, and IFNγ was observed (Figure 1c,d). Increasing the OVA concentration to 20 ng/ml or higher resulted in uniformly high CD25 expression by nearly all T cells. At 20 ng/ml OVA, IL‐2 and IL‐4 were secreted, yet only low levels of IFNγ, corresponding to a Th2‐associated cytokine profile. Collectively, increasing the OVA concentration resulted in a dose‐dependent increase in IL‐2 and IFNγ, corresponding to a Th1‐associated cytokine profile. These changes in the T‐cell cytokine secretion with dose were associated with an increase in IRF1 activity measured by TRACER (Figure 1b).
Figure 1.
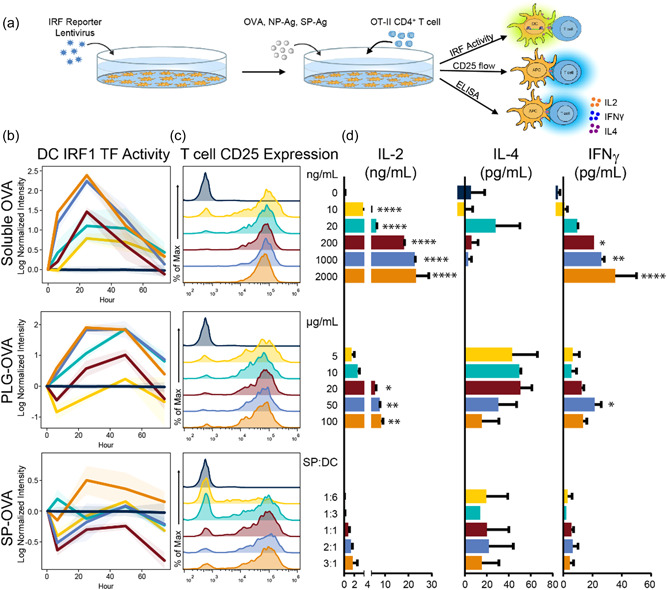
Soluble, PLG NP‐, and ECDI‐SP‐derived antigen cause differential transcription factor activity and T‐cell fates. C57BL/6 DCs were transduced with an IRF1 TF reporter. (a) At time 0, T cells were added with a range of soluble OVA (0– 2000 ng/ml), PLG‐OVA (8 μg OVA/mg NP, 5–100 μg NP/ml), or SP‐OVA (1:6 to 3:1 SP‐OVA:DC ratio). (b) TF activity was tracked over time by bioluminescence using IVIS imaging. (b) On Day 4, T‐cell activation was determined by flow cytometry using CD25 expression (reported as frequency distributions), and (d) the secretion of IL‐2, IL‐4, and IFNγ was measured in the supernatants using ELISA. Error bars represent SEM. N = 3 replicates per condition. Colors are consistent for conditions throughout subfigures (b–d). Asterisk represent statistical significance from no antigen control by ANOVA. *p < 0.05, **p < 0.01, ***p < 0.001, ****p < 0.0001. ANOVA, analysis of variance; DC, dendritic cells; ELISA, enzyme‐linked immunosorbent assay; IFNγ, Interferon‐gamma; IL, interleukin; TF, transcription factor.
Treatment with PLG‐OVA and SP‐OVA resulted in a range of T‐cell responses. At the low PLG‐OVA concentration of 5 μg/ml (8 μg OVA/mg), no positive IRF1 activity was observed, yet there was sufficient T‐cell stimulation for CD25 expression and IL‐4 secretion (Figure 1b–d). Treatment with PLG‐OVA at concentrations of 10 μg/ml and greater resulted in CD25 expression in all T cells and a concentration‐dependent increase in IL‐2 secretion and decrease in IL‐4 secretion were observed. In contrast to soluble OVA, particle‐delivered OVA resulted in reduced IL‐2 and IFNγ secretions, and the IRF1 activity was more rapidly initiated by soluble OVA. OVA delivery by SP‐OVA resulted in a more gradual increase in CD25 expression on T cells with nearly complete activation (as measured by CD25 expression) above a SP‐OVA:DC ratio of 1:1 (Figure 1c). At all SP‐OVA:DC treatment ratios, relatively low levels of IL‐2, IL‐4, and IFNγ were detected (Figure 1d). This low level of cytokine secretion was similarly observed in SP‐OVA:DC ratios up to 6:1 (data not shown). Despite the low level of IL‐2 secretion, a dose‐dependent increase with SP‐OVA treatment was observed. Similarly, low IRF1 activity was observed, which became positive at a SP‐OVA:DC treatment ratio of 3:1 yet was delayed 24 h from the addition of SP‐OVA (Figure 1b). The IRF1 TF activity observed at the SP‐OVA:DC ratio 3:1 resembled the dynamics of the 10 ng/ml soluble OVA and the 20 μg/ml PLG‐OVA conditions.
3.2. PLG‐OVA and SP‐OVA differentially modulate TF activity in DCs during Ag presentation to Ag‐specific T cells
The differential ability and efficiency of PLG‐Ag and SP‐Ag to induce tolerance in vivo has motivated the hypothesis that these two Ag‐delivery modalities cause distinct signaling in the context of Ag presentation. TRanscriptional Activity CEll aRray (TRACER) was used to measure a range of TF activity resulting from 10 µg/ml PLG‐OVA and 3:1 SP‐OVA:DC (Figure 2), which were selected as the lowest concentrations to induce IRF1 signaling (Figure 1b). A total of 26 TF reporters were measured. Of these, 22 and 24 TFs were significantly regulated by PLG‐OVA and SP‐OVA compared to the Ag‐free control during 48 h of Ag presentation (Supporting Information: Figure S1), respectively, including IRF1, STAT1, NFκB, and SMAD3 (p < 0.05) (Figure 2a). Between the PLG‐OVA and SP‐OVA conditions, 18 TFs were statistically different in terms of their activity during 48 h of culture, including: GATA and STAT family TFs, SMAD3, PPAR, IRF1, and NF‐κB (p < 0.05) (Figure 2b). In general, the TF activity of these two OVA‐carriers followed similar signaling profiles, and at the concentrations evaluated, TF activity was almost exclusively lower in PLG‐OVA condition compared to SP‐OVA. However, divergent signaling activity was observed by FOXA, PTTG, and SMAD3 between 24 and 48 h.
Figure 2.
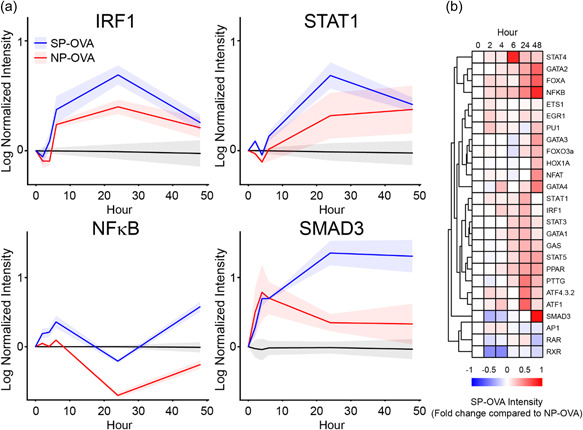
PLG NP‐ and SP‐Ag induce differential TF activity in DCs during Ag presentation to T cells. C57BL/6 DCs were transduced with an array of TF reporters. At time 0, T cells were added with PLG‐OVA (8 μg OVA/mg NP, 10 μg NP/ml) or SP‐OVA (1:1 ratio with DCs). TF activity was tracked by bioluminescence using IVIS imaging. (a) The dynamic TF activity of IRF1, STAT1, NF‐κB, and SMAD3 and (b) a heatmap representing the activity of SP‐OVA treatment relative PLG‐OVA in all TFs measured. N = 3 replicates per condition. DC, dendritic cells; IFNγ, Interferon‐gamma; IL, interleukin; TF, transcription factor.
3.3. Increasing Ag loading of NPs or SPs enhances IRF1 signaling associated with Ag‐presentation
PLG‐OVA and SP‐OVA were formulated with increasing amounts of Ag to determine if the density of Ag delivered per PLG‐Ag or per SP‐Ag affected Ag signaling and T‐cell cytokine secretions. Increasing the Ag loading in PLG‐OVA particles from 2 to 80 μg/mg resulted in a dose‐dependent increase in IRF1 activity. This concentration‐dependent increase in IRF1 activation was enhanced when the concentration of PLG‐Ag was increased from 10 to 100 μg/ml (Figure 3a). When considering the total Ag delivered (Ag loading ×PLG‐Ag concentration), delivery of 800 ng/ml particle concentration with 8 μg/mg particles resulted in similar IRF1 activity as the same amount of Ag delivered by an 80 μg/mg particle (10 times increase in antigen loading per particle). However, the IRF1 activity resulting from 4 μg/mg particles at a high concentration (400 ng/ml total) was less than the activity resulting from 8 μg/mg particles at a low concentration (80 ng/ml total), which may indicate an improvement in Ag presentation efficiency resulting from particles with higher Ag densities. Interestingly, the secretion of IL‐2 and IFNγ appeared limited compared to equivalent delivery of soluble OVA. Differential Ag loading was then evaluated with SP‐OVAs by coupling 1× to 8× Ag (Figure 3b). The 1× and 2× SP‐OVA followed a similar midrange IRF1 activity profile (relative to the no‐antigen control and highest antigen loading conditions) which was slightly increased in treatments with 4× and 8× OVA loadings (Figure 3). Treatment with SP‐OVA resulted in IL‐4 secretion comparable to NPs and soluble OVA, yet the secretion of IL‐2 and IFNγ was diminished in comparison. In general, increasing the Ag content in PLG‐OVA and SP‐OVA increased the magnitude of IRF1 TF signaling and IL‐2 and IFNγ secretions, and this effect was stronger with PLG‐Ags.
Figure 3.
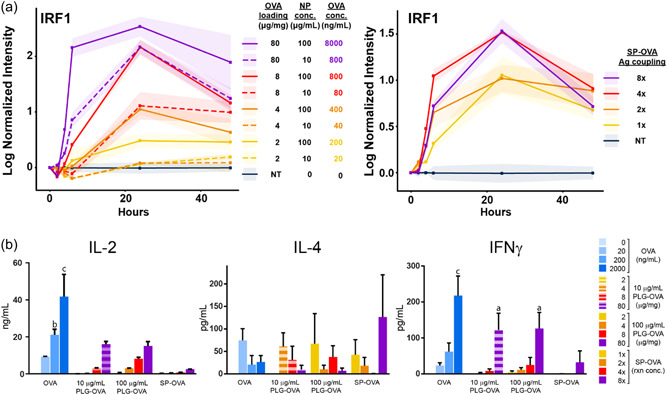
(a) The activity of IRF1 induced during cognate antigen presentation is positively influenced by concentration and antigen loading of PLG‐Ag NPs and SP‐OVA. C57BL/6 DCs were transduced with an IRF1 TF reporter. At time 0, T cells were added with a PLG‐OVA or SP‐OVA. PLG‐OVA particles of various Ag‐loadings (2, 4, 8, or 80 μg OVA/mg NP) were added at a low or high concentration (10 or 100 μg/ml). SP‐OVA were prepared using 1×, 2×, 4×, or 8× OVA (1, 2, 4, or 8 mg/ml per 3.2 × 10⁸ SPs) during ECDI coupling and were added at a 3:1 ratio to DCs. TF activity was tracked over time by bioluminescence using IVIS imaging. (b) On Day 4, IL‐2, IL‐4, and IFNγ were measured in the supernatants. N = 3 replicates per conditions. Statistical differences compared to no antigen control found using ANOVA. a: p < 0.01, b: p < 0.001, c: p < 0.0001. ANOVA, analysis of variance; DC, dendritic cells; ECDI, carbodiimide; PLG, poly(lactide‐co‐glycolide) nanoparticles; SP, splenocytes; TF, transcription factor.
3.4. Increasing Ag loading on PLG‐Ag particles increases tolerogenic efficacy in the delayed hypersensitivity mouse model
PLG‐OVA particles with multiple OVA loadings were evaluated in an OVA‐induced DTH model to determine how Ag loading affects tolerance induction in vivo, as in vitro experiments are insufficient to demonstrate a tolerogenic phenotype. PLG‐OVA particles were employed in this model because of the precise control over Ag‐loading enabled by the incorporation of Ag‐PLG polymer conjugates (Pearson, Casey, Hughes, Miller, et al., 2017). Mice were treated with PLG‐OVA particles before immunization with OVA/complete Freund's adjuvant (CFA) (prophylactically) or after immunization (therapeutically) (Figure 4a). The dose of particles was fixed at 1 mg per mouse, but the OVA loading on the PLG‐OVA particles ranged from 0 to 150 μg/mg. In both prophylactically‐ and therapeutically‐treated mice, an Ag loading‐dependent decrease was observed in the ear swell measurements (Figure 4b). For both treatment schemes, PLG‐OVA with a loading of 8 μg/mg or higher resulted in tolerance measured by an ear swell measurement similar to the negative control. To determine if the tolerance effect was based on an Ag loading of 8 μg/mg or an absolute delivery of 8 μg, particles were also administered at various NP doses and Ag loadings such that each mouse received a total injection of 8 μg of OVA delivered at a loading of 2, 4, or 8 μg/mg (Figure 4c). Where an injection of 1 mg of 8 μg/mg PLG‐OVA was sufficient for prophylactic and therapeutic tolerance, injection 2 mg of 4 μg/mg or 4 mg of 2 μg/mg was not. This result indicates that a minimum Ag loading is required for tolerance induction and that increasing the particle dose does not completely compensate for subtherapeutic Ag loading.
Figure 4.
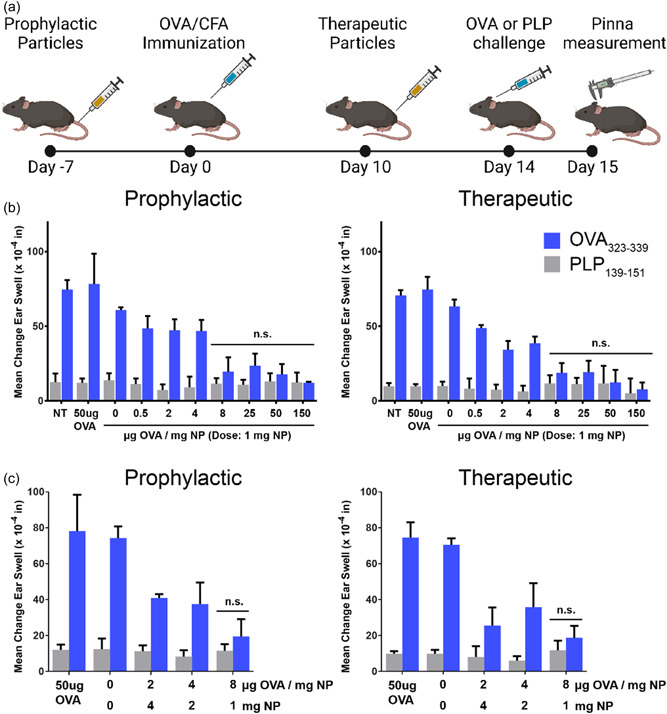
PLG‐Ag NP‐induced tolerance induced in dependent on antigen‐loading in the DTH model. (a) Mice were intravenously injected with PLG‐OVA NPs prophylactically (Day −7 relative to immunization) or therapeutically (Day 10 relative to immunization). Mice were immunized with OVA/CFA and on Day 14 were primed with an intradermal injection of 1 mg/ml OVA or irrelevant PLP in the pinna of the ear. Ear thickness was determined before priming or 24 h following priming. (b) Mice were not treated (NT) or injected with 50 μg OVA or 1 mg of PLG NP containing a range of antigen loading (0–150 μg OVA/mg NP). (c) The amount of Ag delivered by PLG‐Ag was fixed at 8 μg delivered by 1, 2, or 4 mg of PLG‐OVA NPs (loadings of 8, 4, or 2 μg OVA/mg NP). Statistical differences were determined by two‐way ANOVA with Sidak's multiple comparisons test with nonsignificant differences between test ear and control ear indicated (p > 0.05). N = 5 mice per condition. ANOVA, analysis of variance; PLG, poly(lactide‐co‐glycolide); PLP, proteolipid peptide; SP, splenocytes; TF, transcription factor.
3.5. The efficacy of PLG‐Ag‐induced tolerance is particle dose‐dependent
Based on the improved efficacy of particles with high Ag loading, we hypothesized that particles with high Ag loading would be effective at inducing tolerance at lower doses. This hypothesis was tested in the EAE mouse of relapsing‐remitting multiple sclerosis. Mice were treated with a range of PLG‐PLP doses which contained a high Ag content (128 μg PLP/mg NP, limited by the coupling efficiency of Ag‐polymer conjugation) before disease induction by immunization. A single injection of 1 mg provided complete protection against disease after Day 17 (Figure 5). However, decreasing the particle dose resulted in an increase of disease symptoms. A dose of 0.5 mg significantly reduced EAE disease symptoms compared to lower doses and PBS control by Day 17, but this dose was not protective against the onset of acute disease symptoms. Mice treated with the doses of 0.01 and 0.1 mg were not protected, and mice displayed EAE symptoms in both the acute and relapsing stages of disease. These data suggest that, even at high Ag loadings, a minimum therapeutic PLG‐Ag dose must be administered for tolerogenic efficacy.
Figure 5.
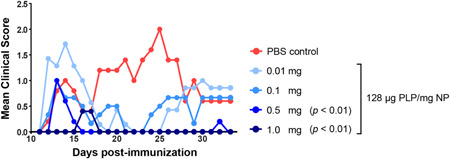
PLG‐Ag NP‐induced tolerance is NP dose‐dependent even at high antigen loading in the EAE model. Mice were intravenously injected with PLG‐PLP NPs 7 days before immunization with PLP/CFA. A range of doses were evaluated (0.01–1 mg/mouse) for these high antigen content particles (128 μg PLP/mg NP). Statistical differences from PBS control were determined by Kruskal–Wallis test (one‐way ANOVA nonparametric) with Dunn's multiple comparisons test. N = 5 mice per condition. ANOVA, analysis of variance; PLG, poly(lactide‐co‐glycolide); PLP, proteolipid peptide.
4. DISCUSSION
The delivery of disease‐relevant Ags by polymeric NPs or ECDI‐fixed SPs has demonstrated Ag‐specific tolerance in a range of immune hypersensitivity models, however, these two technologies appear to induce tolerance with different efficiencies. SP‐Ags have produced tolerogenic outcomes in models of Th1/17 models or autoimmunity, Th2 models of allergy, and facilitated functional allograft acceptance in the absence of immunosuppressive compounds (Getts et al., 2013, 2011; Luo et al., 2008). Based on these successes, biodegradable PLG NPs have been developed as a surrogate Ag carrier to improve the translatability of this peripheral tolerance strategy by enabling large‐scale, rather than patient‐specific, formulation (Hunter et al., 2014; Pearson et al., 2019). This study has extended these previous reports through comparison of Ag‐delivery by NPs and SPs in vitro and extended the antigen dose‐dependent activation of T cells to the tolerogenic phenotype in vivo.
TF activity in DCs was correlated with Ag presentation to T cells and was differentially regulated based on delivery mode and amount of Ag delivered. The increase in TF activity with Ag delivery demonstrates that DCs actively respond to the interaction of MHC II with T cell receptors (TCR). In this study, IRF1 and STAT1 were upregulated during Ag‐presentation, in accordance with their previously identified roles as regulators of MHC II expression (Figure 2). Specifically, MHC II on DCs is controlled by the class II MHC transactivator (CIITA) gene. This gene induces the expression of MHC II and is dependent on the binding of both IRF1 and STAT1, which were upregulated by soluble OVA, PLG‐OVA, and SP‐OVA (Muhlethaler‐Mottet et al., 1998). This cascade is known to be initiated by the action of IFNγ on APCs. Indeed, IFNγ secretion increased in response to increasing OVA concentrations (Figure 1). This increase in IFNγ concentration may indicate that MHC II:TCR interaction provides a positive feedback signal to produce MHC II in proportion to the amount of Ag presented.
In contrast to the many TFs that were positively regulated by Ag delivery and presentation, the activity of NF‐κB was comparatively low (Figure 2). Our recent paper reported that NP‐induced dampening of proinflammatory cytokine secretion induced by lipopolysaccharide (TLR4 agonist) occurred by inhibiting IkB phophorylation and corresponding NF‐κB activation in addition to suppressing p38 MAPK phosphorylation to limit proinflammatory gene transcription (Lasola et al., 2021). These results strongly contrast the rapid immunogenic upregulation of NF‐κB following TLR4 stimulation which is associated with DC maturation and inflammatory cytokine production (Reis et al., 2011). Compared to Ag derived from a vaccine or pathogen, PLG‐Ag and ECDI‐SP‐Ag are delivered to APCs in the absence of immune‐activating stimuli that would increase costimulatory molecule expression (Miller et al., 2007). ECDI‐SP present anti‐inflammatory signaling associated with natural apoptotic death (Turley & Miller, 2007). Inhibited NF‐κB signaling in DCs was determined to be tolerogenic in the EAE model where adoptively transferred MOG‐presenting DCs provided a protective tolerance when treated with an NF‐κB inhibitor, but not if they were NF‐κB‐competent (Iruretagoyena et al., 2006). Together, PLG‐Ag and SP‐Ag initiated a range of TF activity which was Ag‐specific and dependent on quantity of Ag delivered.
Increasing PLG‐Ag loading correlated with a shift in cytokine secretion profile from Th2‐like to Th1‐like in cocultures of DCs and T cells (Figures 1 and 3). In the soluble Ag controls, low concentrations of Ag favored IL‐4 production and higher concentrations of Ag favored high IL‐2 and IFNγ production, which matches previous reports that increasing Ag concentration skews T‐cell differentiation from Th2 to Th1 (Boonstra et al., 2003; Hosken et al., 1995). This trend was observed in the delivery of Ag by PLG particles, where low Ag loading or low particle concentrations resulted in a secretion profile that favored IL‐4 secretion and low levels of IFNγ indicating a Th2‐cytokine profile. However, at higher Ag loadings, treatment with PLG‐Ags resulted in increased IL‐2 and IFNγ secretion, which is associated with a Th1 cytokine profile. This result may seem paradoxical since higher Ag loadings resulted in stronger tolerance in vivo (Figures 4 and 5), yet the Th1 phenotype is often associated with the pathology of autoimmunity. However, the extent of cytokine secretion was less for PLG‐Ags than it was for a similar quantity of soluble Ag, suggesting a suboptimal activation of Th1 cells (Figure 3). Notwithstanding, in vitro experiments may not completely capture the extent of complex interactions produced in vivo as studies have demonstrated significant induction of Ag‐specific regulatory T cells (Tregs), which our current studies did not evaluate (Casey et al., 2017). Using the BDC2.5 mouse model of type 1 diabetes, others observed that IL‐2 and IFNγ were produced from Ag‐challenged SPs derived from NP‐tolerized mice (Prasad et al., 2018). These results could indicate that tolerance is induced, not despite the presence of IL‐2 and IFNγ, but perhaps as a consequence of their activity.
The skewing of T cells towards a Th1 secretion profile was correlated with an increase in IRF1 activity in dendritic cells. This finding is similar to observations from studies in IRF1 deficient mice where Th1 immunity is impaired. IRF1−/− mice contain DCs that are low producers of Th1‐inducing cytokine IL‐12, and are instead high producers of tolerogenic IL‐10 and transforming growth factor‐β (Gabriele et al., 2006). Others have observed that Ag‐specific stimulation of splenocytes from IRF1−/− mice exclusively produced IL‐4 whereas IRF1+/+ mice exclusively produced IFNγ (Taki et al., 1997). Importantly, IRF1−/− T cells are still capable of differentiation into Th1 cells, indicating that IRF1 signaling in APCs (but not T cells) is deterministic of T cell fate (Lohoff et al., 1997). This observation may have implications in NP‐ and SP‐induced tolerance, as the IRF1 signaling was positively regulated by Ag delivery (Figure 1).
The phenotypic outcomes induced by PLG‐Ag and SP‐Ag may be influenced by differences in endocytosis and Ag‐presentation. The expression of CD25 was observed on nearly all T cells even when treated with low concentrations of OVA, PLG‐OVA, and SP‐OVA indicating that, in naïve T cells, a low threshold for Ag experience was present. However, the range of cytokine secretion by T cells seems to suggest that these Ag‐delivery modes are not causing equal DC:T‐cell signaling interactions. At the highest concentrations tested, soluble OVA resulted in 2‐ and 10‐fold higher IL‐2 production than PLG‐OVA and SP‐OVA conditions. This cytokine production coincided with a rapid increase in IRF1 TF activity suggesting that soluble OVA is efficiently processed and presented by DCs to T cells. While the IRF1 activity profile of NP‐OVA had a similar magnitude to the soluble OVA treatment, the onset of signaling was delayed about 24 h. This range in signaling kinetics may be governed by differences in the rate of Ag processing and avidity of Ag presentation. Soluble Ag is efficiently taken up by DCs or may directly load onto surface MHC II to be presented to T cells (Robertson et al., 2000). In contrast, the covalently bound Ag delivered by PLG and ECDI‐SP requires endocytosis and release before loading onto MHC II. The internalization of PLG NPs and ECDI‐SPs occurs over several hours in vitro, and previous studies showed that soluble Ag was expressed in DCs at similar levels as PLG‐derived Ag after 24 h and indeed soluble OVA and particle‐derived OVA‐induced similar IRF1 signaling at 24 h (Brito Baleeiro et al., 2016; Kuo et al., 2017; Turley & Miller, 2007). Unlike treatment with soluble OVA or PLG‐OVA, where OVA is the only added peptide, SP‐OVA deliver a vast range of other cellular proteins which may result in a decrease in the frequency of OVA‐occupied MHC II.
Tolerance induction by PLG‐Ag particles requires a minimum dose and Ag loading (Figures 4 and 5). In the EAE model, we demonstrated that PLG‐Ag particles were ineffective below a dose of 0.5 mg/mouse. The dose‐dependency of tolerance induction has been observed previously with both PLG‐Ag and SP‐OVA, and tolerance cannot be rescued by supplementing the particles with very high Ag loadings (128 μg Ag/mg NP) (Casey et al., 2017; Hunter et al., 2014; Tan et al., 1992). Studies of intravenously delivered particles show that these particles accumulate in the spleen and liver and cause the Ag‐specific arrest of T cells in these organs. Collectively, these results suggest that Ag may need to be distributed across a critical number of APCs in these vascular organs to arrest and reprogram a sufficient number of T cells to have a tolerogenic effect. The observation that increasing the Ag loading per particle does not rescue tolerance in low‐dose regimes supports the importance of temporally distributing the disease‐relevant Ag. Additionally, a minimum effective Ag loading was identified for tolerance induction. In the DTH model, at a fixed dose of 1 mg, an Ag‐loading below 8 μg/mg was insufficient for inducing tolerance (Figure 5). Where the dosing threshold suggested that sufficient biodistribution is required for tolerance, the requirement of Ag loading suggests that a necessary APC:T‐cell Ag signaling requirement. The avidity of Ag signaling that would be minimally required for arresting the flow of circulating T cells remains uncertain, or whether the requirement is for programming a specific phenotype in the T cells.
In summary, the presentation of NP‐ and SP‐Ag was compared in a coculture system of DCs and T cells to elucidate the cellular and molecular events programmed by these platforms. DC TF activity was upregulated during Ag presentation to Ag‐restricted T cells, and different Ag delivery modes resulted in distinct TF signaling dynamics. Compared to soluble Ag delivery, PLG‐Ag induced lower levels of IL‐2 and IFNγ secretion, whereas cytokine responses to SP‐Ag were severely muted in the DC:T‐cell assay. The TF activity and cytokine profiles were dependent on Ag density and concentration of PLG‐Ag and SP‐Ag. The importance of these factors was corroborated in vivo for PLG‐Ag delivery in the DTH and EAE models, where Ag loading and dose‐dependency for effective PLG‐Ag tolerance induction was identified. These mechanistic insights will be useful in the translation of Ag‐loaded NPs for the treatment of immune disorders.
AUTHOR CONTRIBUTIONS
Liam M. Casey, Joseph T. Decker, Laila Rad, Kevin R. Hughes, and Justin A. Rose performed the in vitro assays for this manuscript. Justin A. Roseyan M. Pearson performed the in vivo experiments. Liam M. Casey, Joseph T. Decker, Ryan M. Pearson, Stephen D. Miller, and Lonnie D. Shea were involved in conceptualizing this study. Liam M. Casey, Joseph T. Decker, and Lonnie D. Shea were involved in planning the experiments. Liam M. Casey and Joseph T. Decker analyzed the data. Liam M. Casey, Joseph T. Decker, and Lonnie D. Shea wrote the manuscript. All authors provided feedback on the written manuscript.
CONFLICT OF INTEREST
RMP, SJM, and LDS have a financial interest in Cour Pharmaceuticals Development Company.
Supporting information
Figurementary Figure 1: Heatmap comparing transcription factor activity of NP‐OVA or SP‐OVA treated BMDCs compared to Ag‐free control.
ACKNOWLEDGMENTS
We thank the University of Michigan Cancer Center Immunology Core Facility, the University of Michigan Flow Cytometry Core, and the University of Michigan BioInterfaces Institute for technical support. This study was supported in part by NIH grants R01AI55678 and R01AI48076 (to L. D. S). L. M. C. is supported by the University of Michigan Rackham Predoctoral Fellowship. J. T. D is supported by NIH grant K01EB028877.
Casey, L. M. , Decker, J. T. , Podojil, J. R. , Rad, L. , Hughes, K. R. , Rose, J. A. , Pearson, R. M. , Miller, S. D. , & Shea, L. D. (2023). Nanoparticle dose and antigen loading attenuate antigen‐specific T‐cell responses. Biotechnology and Bioengineering, 120, 284–296. 10.1002/bit.28252
Liam M. Casey and Joseph T. Decker contributed equally to this study.
Liam M. Casey and Joseph T. Decker are co‐first author.
DATA AVAILABILITY STATEMENT
The data that support the findings of this study are available from the corresponding author upon reasonable request.
REFERENCES
- Adami, J. , Gäbel, H. , Lindelöf, B. , Ekström, K. , Rydh, B. , Glimelius, B. , Ekbom, A. , Adami, H. O. , & Granath, F. (2003). Cancer risk following organ transplantation: A nationwide cohort study in Sweden. British Journal of Cancer, 89(7), 1221–1227. [DOI] [PMC free article] [PubMed] [Google Scholar]
- Boonstra, A. , Asselin‐Paturel, C. , Gilliet, M. , Crain, C. , Trinchieri, G. , Liu, Y.‐J. , & O'Garra, A. (2003). Flexibility of mouse classical and plasmacytoid‐derived dendritic cells in directing T helper type 1 and 2 cell development. Journal of Experimental Medicine, 197(1), 101–109. [DOI] [PMC free article] [PubMed] [Google Scholar]
- Brito Baleeiro, R. , Schweinlin, M. , Rietscher, R. , Diedrich, A. , Czaplewska, J. A. , Metzger, M. , Michael Lehr, C. , Scherließ, R. , Hanefeld, A. , Gottschaldt, M. , & Walden, P. (2016). Nanoparticle‐based mucosal vaccines targeting tumor‐associated antigens to human dendritic cells. Journal of Biomedical Nanotechnology, 12(7), 1527–1543. [DOI] [PubMed] [Google Scholar]
- Bryant, J. , Hlavaty, K. A. , Zhang, X. , Yap, W. T. , Zhang, L. , Shea, L. D. , & Luo, X. (2014). Nanoparticle delivery of donor antigens for transplant tolerance in allogeneic islet transplantation. Biomaterials, 35(31), 8887–8894. [DOI] [PMC free article] [PubMed] [Google Scholar]
- Calabrese, L. H. , & Molloy, E. S. (2008). Progressive multifocal leucoencephalopathy in the rheumatic diseases: Assessing the risks of biological immunosuppressive therapies. Annals of the Rheumatic Diseases, 67(Suppl 3), iii64–iii65. 10.1136/ard.2008.097972 [DOI] [PubMed] [Google Scholar]
- Casey, L. M. , Pearson, R. M. , Hughes, K. R. , Liu, J. M. H. , Rose, J. A. , North, M. G. , Wang, L. Z. , Lei, M. , Miller, S. D. , & Shea, L. D. (2017). Conjugation of transforming growth factor beta to antigen‐loaded poly (lactide‐co‐glycolide) nanoparticles enhances efficiency of antigen‐specific tolerance. Bioconjugate Chemistry, 29(3), 813–823. [DOI] [PMC free article] [PubMed] [Google Scholar]
- Cho, J. J. , Stewart, J. M. , Drashansky, T. T. , Brusko, M. A. , Zuniga, A. N. , Lorentsen, K. J. , Keselowsky, B. G. , & Avram, D. (2017). An antigen‐specific semi‐therapeutic treatment with local delivery of tolerogenic factors through a dual‐sized microparticle system blocks experimental autoimmune encephalomyelitis. Biomaterials, 143, 79–92. 10.1016/j.biomaterials.2017.07.029 [DOI] [PMC free article] [PubMed] [Google Scholar]
- Decker, J. T. , Hobson, E. C. , Zhang, Y. , Shin, S. , Thomas, A. L. , Jeruss, J. S. , Arnold, K. B. , & Shea, L. D. (2017). Systems analysis of dynamic transcription factor activity identifies targets for treatment in Olaparib‐resistant cancer cells. Biotechnology and Bioengineering, 114(9), 2085–2095. 10.1002/bit.26293 [DOI] [PMC free article] [PubMed] [Google Scholar]
- Freitag, T. L. , Podojil, J. R. , Pearson, R. M. , Fokta, F. J. , Sahl, C. , Messing, M. , Andersson, L. C. , Leskinen, K. , Saavalainen, P. , Hoover, L. I. , Huang, K. , Phippard, D. , Maleki, S. , King, N. J. C. , Shea, L. D. , Miller, S. D. , Meri, S. K. , & Getts, D. R. (2020). Gliadin nanoparticles induce immune tolerance to gliadin in mouse models of celiac disease. Gastroenterology, 158(6), 1667–1681. [DOI] [PMC free article] [PubMed] [Google Scholar]
- Gabriele, L. , Fragale, A. , Borghi, P. , Sestili, P. , Stellacci, E. , Venditti, M. , Schiavoni, G. , Sanchez, M. , Belardelli, F. , & Battistini, A. (2006). IRF‐1 deficiency skews the differentiation of dendritic cells toward plasmacytoid and tolerogenic features. Journal of Leukocyte Biology, 80(6), 1500–1511. [DOI] [PubMed] [Google Scholar]
- Getts, D. R. , Martin, A. J. , McCarthy, D. P. , Terry, R. L. , Hunter, Z. N. , Yap, W. T. , Getts, M. T. , Pleiss, M. , Luo, X. , King, N. J. , Shea, L. D. , & Miller, S. D. (2012). Microparticles bearing encephalitogenic peptides induce T‐cell tolerance and ameliorate experimental autoimmune encephalomyelitis. Nature Biotechnology, 30(12), 1217–1224. 10.1038/nbt.2434 [DOI] [PMC free article] [PubMed] [Google Scholar]
- Getts, D. R. , McCarthy, D. P. , & Miller, S. D. (2013). Exploiting apoptosis for therapeutic tolerance induction. The Journal of Immunology, 191(11), 5341–5346. [DOI] [PMC free article] [PubMed] [Google Scholar]
- Getts, D. R. , Turley, D. M. , Smith, C. E. , Harp, C. T. , McCarthy, D. , Feeney, E. M. , Getts, M. T. , Martin, A. J. , Luo, X. , Terry, R. L. , King, N. J. C. , & Miller, S. D. (2011). Tolerance induced by apoptotic antigen‐coupled leukocytes is induced by PD‐L1+ and IL‐10–producing splenic macrophages and maintained by T regulatory cells. The Journal of Immunology, 187(5), 2405–2417. [DOI] [PMC free article] [PubMed] [Google Scholar]
- Hosken, N. A. , Shibuya, K. , Heath, A. W. , Murphy, K. M. , & O'Garra, A. (1995). The effect of antigen dose on CD4+ T helper cell phenotype development in a T cell receptor‐alpha beta‐transgenic model. Journal of Experimental Medicine, 182(5), 1579–1584. [DOI] [PMC free article] [PubMed] [Google Scholar]
- Hunter, Z. , McCarthy, D. P. , Yap, W. T. , Harp, C. T. , Getts, D. R. , Shea, L. D. , & Miller, S. D. (2014). A biodegradable nanoparticle platform for the induction of antigen‐specific immune tolerance for treatment of autoimmune disease. ACS Nano, 8(3), 2148–2160. 10.1021/nn405033r [DOI] [PMC free article] [PubMed] [Google Scholar]
- Iruretagoyena, M. I. , Sepúlveda, S. E. , Lezana, J. P. , Hermoso, M. , Bronfman, M. , Gutiérrez, M. A. , Jacobelli, S. H. , & Kalergis, A. M. (2006). Inhibition of nuclear factor‐κB enhances the capacity of immature dendritic cells to induce antigen‐specific tolerance in experimental autoimmune encephalomyelitis. Journal of Pharmacology and Experimental Therapeutics, 318(1), 59–67. [DOI] [PubMed] [Google Scholar]
- Kelly, C. P. , Murray, J. A. , Leffler, D. A. , Getts, D. R. , Bledsoe, A. C. , Smithson, G. , First, M. R. , Morris, A. , Boyne, M. , Elhofy, A. , Wu, T. T. , Podojil, J. R. , Miller, S. D. , Fogel, R. , Freitag, T. L. , Gerber, M. , Haynes, P. K. , Koren, M. , Matson, M. , … Turner, M. (2021). TAK‐101 nanoparticles induce gluten‐specific tolerance in celiac disease: A randomized, double‐blind, placebo‐controlled study. Gastroenterology, 161, 66–80.e8. [DOI] [PMC free article] [PubMed] [Google Scholar]
- Kröger, A. , Köster, M. , Schroeder, K. , Hauser, H. , & Mueller, P. P. (2002). Activities of IRF‐1. Journal of Interferon & Cytokine Research, 22(1), 5–14. [DOI] [PubMed] [Google Scholar]
- Kuo, R. , Saito, E. , Miller, S. D. , & Shea, L. D. (2017). Peptide‐conjugated nanoparticles reduce positive co‐stimulatory expression and T cell activity to induce tolerance. Molecular Therapy, 25, 1676–1685. 10.1016/j.ymthe.2017.03.032 [DOI] [PMC free article] [PubMed] [Google Scholar]
- Lasola, J. J. M. , Cottingham, A. L. , Scotland, B. L. , Truong, N. , Hong, C. C. , Shapiro, P. , & Pearson, R. M. (2021). Immunomodulatory nanoparticles mitigate macrophage inflammation via inhibition of PAMP interactions and lactate‐mediated functional reprogramming of NF‐κB and p38 MAPK. Pharmaceutics, 13(11), 1841. [DOI] [PMC free article] [PubMed] [Google Scholar]
- Lohoff, M. , Ferrick, D. , Mittrücker, H.‐W. , Duncan, G. S. , Bischof, S. , Röllinghoff, M. , & Mak, T. W. (1997). Interferon regulatory factor‐1 is required for a T helper 1 immune response in vivo. Immunity, 6(6), 681–689. [DOI] [PubMed] [Google Scholar]
- Luo, X. , Miller, S. D. , & Shea, L. D. (2016). Immune tolerance for autoimmune disease and cell transplantation. Annual Review of Biomedical Engineering, 18, 181–205. 10.1146/annurev-bioeng-110315-020137 [DOI] [PMC free article] [PubMed] [Google Scholar]
- Luo, X. , Pothoven, K. L. , McCarthy, D. , DeGutes, M. , Martin, A. , Getts, D. R. , Xia, G. , He, J. , Zhang, X. , Kaufman, D. B. , & Miller, S. D. (2008). ECDI‐fixed allogeneic splenocytes induce donor‐specific tolerance for long‐term survival of islet transplants via two distinct mechanisms. Proceedings of the National Academy of Sciences, 105(38), 14527–14532. 10.1073/pnas.0805204105 [DOI] [PMC free article] [PubMed] [Google Scholar]
- Lutterotti, A. , Yousef, S. , Sputtek, A. , Stürner, K. H. , Stellmann, J.‐P. , Breiden, P. , Reinhardt, S. , Schulze, C. , Bester, M. , Heesen, C. , Schippling, S. , Miller, S. D. , Sospedra, M. , & Martin, R. (2013). Antigen‐specific tolerance by autologous myelin peptide–coupled cells: A phase 1 trial in multiple sclerosis. Science Translational Medicine, 5(188), 188ra175. [DOI] [PMC free article] [PubMed] [Google Scholar]
- Maldonado, R. A. , LaMothe, R. A. , Ferrari, J. D. , Zhang, A. H. , Rossi, R. J. , Kolte, P. N. , Griset, A. P. , O'Neil, C. , Altreuter, D. H. , Browning, E. , Johnston, L. , Farokhzad, O. C. , Langer, R. , Scott, D. W. , von Andrian, U. H. , & Kishimoto, T. K. (2015). Polymeric synthetic nanoparticles for the induction of antigen‐specific immunological tolerance. Proceedings of the National Academy of Sciences, 112, E156–E165. 10.1073/pnas.1408686111 [DOI] [PMC free article] [PubMed] [Google Scholar]
- McCarthy, D. P. , Yap, J. W.‐T. , Harp, C. T. , Song, W. K. , Chen, J. , Pearson, R. M. , Miller, S. D. , & Shea, L. D. (2017). An antigen‐encapsulating nanoparticle platform for T H 1/17 immune tolerance therapy. Nanomedicine: Nanotechnology, Biology and Medicine, 13(1), 191–200. [DOI] [PMC free article] [PubMed] [Google Scholar]
- Miller, S. D. , Karpus, W. J. , & Davidson, T. S. (2010). Experimental autoimmune encephalomyelitis in the mouse. Current Protocols in Immunology, 88(1), 15.11. 11–15.11. 20. [DOI] [PubMed] [Google Scholar]
- Miller, S. D. , Turley, D. M. , & Podojil, J. R. (2007). Antigen‐specific tolerance strategies for the prevention and treatment of autoimmune disease. Nature Reviews Immunology, 7(9), 665–677. [DOI] [PubMed] [Google Scholar]
- Miller, S. D. , Wetzig, R. P. , & Claman, H. N. (1979). The induction of cell‐mediated immunity and tolerance with protein antigens coupled to syngeneic lymphoid cells. Journal of Experimental Medicine, 149(3), 758–773. [DOI] [PMC free article] [PubMed] [Google Scholar]
- Muhlethaler‐Mottet, A. , Di Berardino, W. , Otten, L. A. , & Mach, B. (1998). Activation of the MHC class II transactivator CIITA by interferon‐γ requires cooperative interaction between Stat1 and USF‐1. Immunity, 8(2), 157–166. [DOI] [PubMed] [Google Scholar]
- Pearson, R. M. , Casey, L. M. , Hughes, K. R. , Miller, S. D. , & Shea, L. D. (2017). In vivo reprogramming of immune cells: Technologies for induction of antigen‐specific tolerance. Advanced Drug Delivery Reviews, 114, 240–255. [DOI] [PMC free article] [PubMed] [Google Scholar]
- Pearson, R. M. , Casey, L. M. , Hughes, K. R. , Wang, L. Z. , North, M. G. , Getts, D. R. , Miller, S. D. , & Shea, L. D. (2017). Controlled delivery of single or multiple antigens in tolerogenic nanoparticles using peptide‐polymer bioconjugates. Molecular Therapy, 25, 1655–1664. [DOI] [PMC free article] [PubMed] [Google Scholar]
- Pearson, R. M. , Podojil, J. R. , Shea, L. D. , King, N. J. C. , Miller, S. D. , & Getts, D. R. (2019). Overcoming challenges in treating autoimmuntity: Development of tolerogenic immune‐modifying nanoparticles. Nanomedicine: Nanotechnology, Biology and Medicine, 18, 282–291. [DOI] [PMC free article] [PubMed] [Google Scholar]
- Peñalver Bernabé, B. , Shin, S. , Rios, P. D. , Broadbelt, L. J. , Shea, L. D. , & Seidlits, S. K. (2016). Dynamic transcription factor activity networks in response to independently altered mechanical and adhesive microenvironmental cues. Integrative Biology, 8(8), 844–860. 10.1039/c6ib00093b [DOI] [PMC free article] [PubMed] [Google Scholar]
- Prasad, S. , Neef, T. , Xu, D. , Podojil, J. R. , Getts, D. R. , Shea, L. D. , & Miller, S. D. (2018). Tolerogenic Ag‐PLG nanoparticles induce tregs to suppress activated diabetogenic CD4 and CD8 T cells. Journal of Autoimmunity, 89, 112–124. 10.1016/j.jaut.2017.12.010 [DOI] [PMC free article] [PubMed] [Google Scholar]
- Rao, S. S. , Stoehr, J. , Dokic, D. , Wan, L. , Decker, J. T. , Konopka, K. , Thomas, A. L. , Wu, J. , Kaklamani, V. G. , Shea, L. D. , & Jeruss, J. S. (2017). Synergistic effect of eribulin and CDK inhibition for the treatment of triple negative breast cancer. Oncotarget, 8(48), 83925–83939. 10.18632/oncotarget.20202 [DOI] [PMC free article] [PubMed] [Google Scholar]
- Reis, J. , Hassan, F. , Guan, X. Q. , Shen, J. , Monaco, J. J. , Papasian, C. J. , Qureshi, A. A. , Van Way, C. W. , Vogel, S. N. , Morrison, D. C. , & Qureshi, N. (2011). The immunoproteasomes regulate LPS‐induced TRIF/TRAM signaling pathway in murine macrophages. Cell Biochemistry and Biophysics, 60(1‐2), 119–126. [DOI] [PMC free article] [PubMed] [Google Scholar]
- Ritchie, M. E. , Phipson, B. , Wu, D. , Hu, Y. , Law, C. W. , Shi, W. , & Smyth, G. K. (2015). limma powers differential expression analyses for RNA‐sequencing and microarray studies. Nucleic Acids Research, 43(7), e47. [DOI] [PMC free article] [PubMed] [Google Scholar]
- Robertson, J. M. , Jensen, P. E. , & Evavold, B. D. (2000). DO11.10 and OT‐II T cells recognize a C‐terminal ovalbumin 323–339 epitope. The Journal of Immunology, 164(9), 4706–4712. 10.4049/jimmunol.164.9.4706. [DOI] [PubMed] [Google Scholar]
- Smarr, C. B. , Hsu, C. L. , Byrne, A. J. , Miller, S. D. , & Bryce, P. J. (2011). Antigen‐fixed leukocytes tolerize Th2 responses in mouse models of allergy. The Journal of Immunology, 187(10), 5090–5098. 10.4049/jimmunol.1100608 [DOI] [PMC free article] [PubMed] [Google Scholar]
- Taki, S. , Sato, T. , Ogasawara, K. , Fukuda, T. , Sato, M. , Hida, S. , Suzuki, G. , Mitsuyama, M. , Shin, E. H. , Kojima, S. , Taniguchi, T. , & Asano, Y. (1997). Multistage regulation of Th1‐type immune responses by the transcription factor IRF‐1. Immunity, 6(6), 673–679. [DOI] [PubMed] [Google Scholar]
- Tan, L. J. , Kennedy, M. K. , & Miller, S. D. (1992). Regulation of the effector stages of experimental autoimmune encephalomyelitis via neuroantigen‐specific tolerance induction. II. Fine specificity of effector T cell inhibition. The Journal of Immunology, 148(9), 2748–2755. [PubMed] [Google Scholar]
- Tostanoski, L. H. , Chiu, Y.‐C. , Gammon, J. M. , Simon, T. , Andorko, J. I. , Bromberg, J. S. , & Jewell, C. M. (2016). Reprogramming the local lymph node microenvironment promotes tolerance that is systemic and antigen‐specific. Cell Reports, 16(11), 2940–2952. [DOI] [PMC free article] [PubMed] [Google Scholar]
- Truong, N. , Black, S. K. , Shaw, J. , Scotland, B. L. , & Pearson, R. M. (2021). Microfluidic‐generated immunomodulatory nanoparticles and formulation‐dependent effects on lipopolysaccharide‐induced macrophage inflammation. The AAPS Journal, 24, 6. 10.1208/s12248-021-00645-2 [DOI] [PMC free article] [PubMed] [Google Scholar]
- Turley, D. M. , & Miller, S. D. (2007). Peripheral tolerance induction using ethylenecarbodiimide‐fixed APCs uses both direct and indirect mechanisms of antigen presentation for prevention of experimental autoimmune encephalomyelitis. The Journal of Immunology, 178(4), 2212–2220. 10.4049/jimmunol.178.4.2212 [DOI] [PubMed] [Google Scholar]
- Weiss, M. S. , Peñalver Bernabé, B. , Bellis, A. D. , Broadbelt, L. J. , Jeruss, J. S. , & Shea, L. D. (2010). Dynamic, large‐scale profiling of transcription factor activity from live cells in 3D culture. PLoS One, 5(11), e14026. 10.1371/journal.pone.0014026 [DOI] [PMC free article] [PubMed] [Google Scholar]
Associated Data
This section collects any data citations, data availability statements, or supplementary materials included in this article.
Supplementary Materials
Figurementary Figure 1: Heatmap comparing transcription factor activity of NP‐OVA or SP‐OVA treated BMDCs compared to Ag‐free control.
Data Availability Statement
The data that support the findings of this study are available from the corresponding author upon reasonable request.