
Chen et al. 10.1073/pnas.0600938103. |
Supporting Table 3
Supporting Text
Supporting Figure 4
Supporting Figure 5
Supporting Table 4
Supporting Table 5
Supporting Figure 6
Supporting Table 6
Supporting Data Set Legend
Supporting Data Set
Fig. 4. COG categorizations of genes from K12, EDL933, SAKAI, and UTI89 genomes are very similar. COG information for K12, EDL933, and SAKAI is taken from www.ncbi.nlm.nih.gov/COG/new. COG information for UTI89 was assigned by using mutual best BLAST hits against the K12, EDL933, and SAKAI genomes. The "Not in COGs" category was omitted from the calculation of totals and percentages.
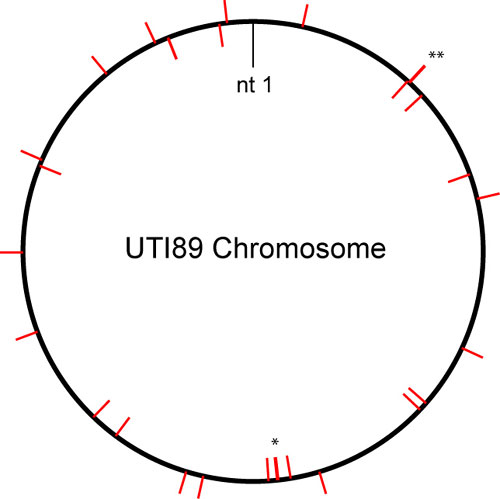
Fig. 5. Chromosomal locations of UPEC-selected genes. The large circle represents the UTI89 chromosome. Nucleotide 1 (nt 1) is arbitrarily assigned. Red tick marks indicate locations of selected genes (outside and inside of circle indicating location on different strands of the chromosomal DNA). An asterisk (*) indicates that two genes are not resolved at the scale of the figure and are therefore represented by a single tick mark. A double asterisk (**) indicates that three genes are not resolved and are represented by a single tick mark.

Fig. 6. Chromosomal locations of pathogenicity islands (PAIs) and chaperone-usher operons.
The large circle represents the UTI89 chromosome. Nucleotide 1 (nt 1) is arbitrarily assigned. Thicker lines with boxed labels indicate the locations of PAIs. Thin lines with italicized labels indicate the locations of chaperone-usher operons.Supporting Text
Features of the UTI89 Genome
Overview
UTI89 is a cystitis isolate taken from a patient suffering from an acute bladder infection. Compared with the genome sequences of a pyelonephritis isolate (CFT073) and other Escherichia coli strains, UTI89 has a minimal complement of toxins and a divergent set of adhesive organelles, as well as a highly recombinogenic plasmid.
Pathogenicity Islands
. We identified four major pathogenicity islands (PAIs) in the UTI89 chromosome based on homology with other sequenced PAIs and named them according to the convention of Blum et al. (Fig. 6).PAI UTI89II spans 119 kb and resembles PAI536II, which carries several genes critical for the virulence of strain 536, a pyelonephritis isolate . In PAIUTI89II, virulence factors are encoded by the pap, hly, and cnf1 operons. The F17-like pilus and flavin mononucleotide-dependent dehydrogenase operons, which are located in a different PAI in strain 536 (PAI536I), are also found in PAIUTI89II. Other putative PAIUTI89II-associated virulence factors include the Hek adhesin, a NhaC homolog (Na+/H+ antiporter from Haemophilus somnus), and a putative autotransporter protein similar to the ShlA/HecA/FhaA exoprotein . Several phage-related and insertion sequence (IS)-associated genes present in this PAI suggest that it may have been recently transferred into the UTI89 genome.
P pili, encoded by the pap operon, are critical adhesive organelles for uropathogenic E. coli (UPEC) strains that cause pyelonephritis . The PAIs containing the pap operon in two pyelonephritis UPEC isolates, CFT073 and J96, differ in their number, insertion location, and gene content from the pap-containing PAIs in strains UTI89 and 536. CFT073 and J96 both contain two copies of the pap operon in two different PAIs. These two pap-containing PAIs are inserted at comparable locations in CFT073 and J96 (near the pheV and pheU tRNA genes). In UTI89 and 536, the single pap-containing PAI is inserted near the leuX tRNA gene.
PAIUTI89III, spanning 61 kb and integrated near the serX tRNA gene, also encodes several putative virulence factors: S pili (encoded by the sfa operon), Salmochelin (encoded by the iro locus) , Antigen 43, and a heme/hemoglobin receptor. S pili are discussed below under Adhesive organelles. Salmochelin is a Salmonella enterica siderophore important for iron acquisition . Antigen 43 is an outer membrane protein important for biofilm formation . Heme/hemoglobin receptors have been suggested to contribute to virulence in other E. coli . Unlike the similarities in pap-containing PAIs in strains UTI89 and 536, the sfa operon and iro locus are found in different PAIs integrated at different locations in these two genomes. The CFT073 genome contains a PAI that closely resembles PAIUTI89III both in gene content and chromosomal location.
PAI UTI89IV contains genes that are homologous to those in the core region of the Yersinia high pathogenicity island (HPI) . PAI UTI89IV is integrated near the asnT tRNA gene; its gene content and chromosomal location are conserved in CFT073 and 536 as well as in many other non-UPEC Enterobacteriaceae species . In Yersinia, the most significant product of the HPI in terms of virulence is yersiniabactin, a siderophore, which is important for iron acquisition.
The UTI89 genome also contains several smaller genomic islands that may contribute to its virulence. One, PAI UTI89V, contains the capsule biosynthesis locus. The genomes of UTI89 (K1 capsule serotype) and CFT073 (K5 serotype) share considerable homology in their capsule biosynthesis loci but differ in their polysialic acid synthase loci (neuDBACES). Genes encoding a putative general Type II secretion system are positioned next to the capsule biosynthesis locus in UTI89; most, but not all, of these genes are absent in the other published E. coli genomes. As no other general secretion systems (Type III or Type IV) have been found in UPEC strains, UTI89 may use its intact Type II secretion system to export virulence factors.
Only genes with previously characterized homologs are mentioned above. Many of the genes with unknown function found in these PAIs are likely to play a role in pathogenesis. Many are also likely to be vestigial and in the process of decay or deletion. Nonetheless, PAIs are the most striking source of diversity among different E. coli isolates and are therefore prime targets for future studies of virulence factors.
Adhesive Organelles.
Attachment to organic or abiotic surfaces confers an advantage for colonization and survival. Many Gram-negative bacteria use a variety of adhesive structures (organelles), such as chaperone-usher pathway pili, to anchor themselves . The best-studied chaperone-usher pilus systems are type 1 and P pili, encoded by the fim and pap operons, respectively . These pilus operons contain a periplasmic chaperone, an outer membrane usher, an adhesin, and a pilus structural gene . Ten such chaperone-usher pilus operons were identified in the UTI89 genome (Table 6 and Fig. 6).The UTI89 genome contains one copy each of the fim and pap operons. The fim operon has been found in all E. coli isolates sequenced to date (Table 6). Type 1 and P pili play an important role in UTI pathogenesis as defined in both animal models and human studies . Consistent with this, both sequenced UPEC strains (UTI89 and CFT073) express functional type 1 pili. In contrast, both sequenced enterohemorrhagic E. coli (EHEC) strains, EDL933 and SAKAI, carry two mutations which inactivate type 1 pilus function and expression: (i) an amino acid mutation in the mannose-binding pocket of FimH (the tip adhesin of type 1 pili) that abolishes binding to mannose (receptor for type 1 pili) ; and (ii) a 16-bp deletion in the upstream promoter for the operon that disrupts an integration host factor (IHF)-binding site and abolishes transcription of the fim operon .
The pap operon has only been found in UPEC and some nonuropathogenic E. coli strains with the K1 capsule serotype . As noted above, in UPEC strains, the pap operon is located within a PAI. Its P pilus adhesin, PapG, can be grouped into three classes: GI, GII, and GIII. PapG proteins from these three classes share only limited sequence homology . Each class is specific for binding to a different member of the globoseries glycolipids . The GII adhesin, which binds to globoside (GbO4) expressed on human kidney epithelial cells, is associated with human pyelonephritic isolates such as CFT073. UTI89 carries a GIII adhesin, which binds to the Forssman antigen (GbO5) found in mouse but not human tissues. This difference may contribute to the difference in tropism of these two sequenced UPEC strains .
Interestingly, the UTI89 cystitis and CFT073 pyelonephritis strains contain related but distinct pilus operons within corresponding PAIs that otherwise have high sequence homology. UTI89 contains the sfa operon encoding S pili, whereas CFT073 contains the foc operon encoding F1C pili. The corresponding PAI (PAI536III) in strain 536 also contains the sfa operon . S pili bind to sulfated glycolipids and sialoglycoproteins on brain endothelial cells and are thought to be important in meningitis-associated E. coli strains. F1C pili are associated with UPEC strains .
UTI89 contains other poorly characterized pilus operons associated with UPEC strains. The auf operon, recently described in CFT073 , is present in the corresponding genomic location in UTI89 as well, between glpD (glycerol-3-phosphate dehydrogenase) and glgP (glycogen phosphorylase). This operon, which is not found in any of the other fully sequenced E. coli strains, does not seem to have a role in the pathogenesis of UTI; mutation of auf in CFT073 does not impair infection of mice , and UTI89 contains a frame-shift mutation in its predicted adhesin, aufG. As noted above, another operon encoding an F17-like pilus is found in the same PAI as the pap operon in UTI89 and in the PAI536I pathogenicity island of strain 536. Little else is known about this pilus or the other pilus operons in UTI89: yad, yfc, yqi, yeh, and fml. Genes in fml were originally annotated in the CFT073 and MG1655 genomes as yde or unnamed. Because of greater sequence homology to the fim operon, we have renamed it as the fim-like operon. The yad, yfc, yeh, and fml operons are present in four of the sequenced E. coli strains (Table 6).
The two UPEC isolates contain similar sets of chaperone-usher pilus operons, which are different from the two similar sets contained in the two EHEC isolates. The pilus operons in MG1655 have only partial overlap with those in the UPEC and EHEC strains (Table 6). Remarkably, the number of chaperone-usher pilus operons present in each genome ranges between 10 and 13. We speculate that adaptation to unique environments relies heavily on specific host-pathogen interactions, biofilm formation, and/or interaction with an abiotic environment, roles known to be played by specific pilus operons present in E. coli genomes.
The UTI89 Plasmid.
Many E. coli strains contain extrachromosomal genetic elements carrying genes involved in DNA transfer, such as plasmids F and R100. Plasmids carried by pathogenic strains, such as pO157 in EHEC isolates, contain genes encoding virulence factors such as toxins, the type III secretion apparatus, and adhesive organelles that contribute to pathogenesis . The UTI89 plasmid, pUTI89, seems to have a hybrid function, because it retains features of plasmid F and carries genes that likely contribute to virulence.The UTI89 plasmid shares two key features with Plasmid F: (i) the entire tra operon, involved in conjugative DNA transfer; and (ii) plasmid replication and regulation genes such as repB, repA6, repA1, ccdA, and ccdB. This suggests that pUTI89 may be conjugatively transferred and replicates extrachromosomally in low copy numbers.
Several genes present on pUTI89 indicate a role in pathogenesis. Four genes, cjrA, cjrB, cjrC, and senB, and their surrounding DNA context are conserved between pUTI89 and the enteroinvasive E. coli (EIEC) O164 large virulence plasmid. The cjrABC operon likely codes for iron uptake proteins . In EIEC strain EI34, mutation of senB results in a 50% reduction in enterotoxicity as measured in a rabbit ileal mucosa model , suggesting that it is a secreted enterotoxin.
Plasmids, such as Plasmid F, are often sites of frequent recombination. Two lines of evidence suggest that pUTI89 also undergoes extensive recombination. First, two pairs of genes are conserved at the nucleotide and gene organization level between pUTI89 and the chromosome: (i) adjacent plasmid genes UTI89_P040 and UTI89_P041 are homologous to adjacent chromosomal genes UTI89_C2258 and UTI89_C2257 and are found within 1.8 kb of sequence sharing 99% nucleotide identity between the plasmid and chromosome; (ii) adjacent plasmid genes UTI89_P042 and UTI89_P043 are homologous to UTI89_C1130 and UTI89_C1129 in a 2.8-kb region of 97% identity. Second, nearly 15% of predicted open reading frames on the UTI89 plasmid are pseudogenes based on high homology to another sequenced gene and disruption by a frameshift, internal nonsense codon, truncation, internal deletion, or insertion. Many of the disruptions were large insertions, resulting in gene fragments separated by one or more other open reading frames. In contrast, less than 3% of predicted open reading frames on the chromosome are pseudogenes. The propensity for recombination and genetic exchange raises the intriguing possibility that combinatorial assortment and exchange of genes via pUTI89 has played an important role in the adaptation of UTI89 to its bladder habitat.
Additional Analysis of the 29 UPEC-Selected Genes.
An elevated mutation rate conservatively biases the prediction of genes under positive selection.
The difference between the M1a model (which does not include positive selection) and the M2a and bsA models (which do include positive selection) is the allowance for a set of codons with dn/ds ratios > 1. dn is the rate of nonsynonymous (amino acid changing) substitutions. ds is the rate of synonymous (nonamino acid changing) substitutions. Because both dn and ds are rates, the difference in the number of nonsynonymous and synonymous sites is already taken into account. Detection of positive selection by the PAML program is not confounded by an elevated mutation rate. In the absence of positive selection, an elevated general mutation rate should affect all sites equally (if mutations are neutral) or preferentially affect synonymous sites (if amino acid mutations are under negative selection), thus making the dn/ds ratio tend toward 1 or toward 0. In both cases, this would decrease the power of the PAML analysis for detecting positive selection and increase the false-negative rate. Simultaneously, it may increase the true positive rate. For elevated mutation in the absence of positive selection to be misinterpreted as positive selection, it would have to act preferentially on nonsynonymous sites. In a given protein-coding gene, nonsynonymous sites are interspersed with synonymous sites: typically, the first two nucleotides in a codon, if changed, result in a nonsynonymous change, whereas mutation of the third nucleotide may result in the same amino acid. Therefore, the elevated mutation rate would have to act preferentially on » 2/3 of the nucleotides within the gene, skipping every third nucleotide, to be misinterpreted as positive selection; in other words, the mutation rate would have to vary with single-nucleotide resolution. Nucleotide context effects on mutation rate may be a mechanism for such fine control of the mutation rate, although this is a highly unlikely scenario.Mutations are shared among isolates from the same patient.
Among the 50 clinical strains analyzed, seven patients were represented by multiple (two to four) isolates: five of these patients had both periurethral and urine isolates; two had multiple urine isolates only. Strains from the same patient had the same DNA sequence (for all six loci analyzed) regardless of the site where the isolate was recovered.Recombination is frequent in E. coli genes.
Using the GENECONV program , 1,046 ortholog sets of 3,470 (30.1%) showed evidence for recombination (P<0.05). Using the RETICULATE program , 699 ortholog sets (20.1%) showed evidence for recombination (P<0.05). As reported in the main text, the number of ortholog sets that showed evidence for recombination using both methods was 443 (12.8%).Methods
Genome sequencing and annotation.
Two whole-genome shotgun (WGS) plasmid libraries were constructed from strain UTI89, one with an average insert size of 4 kb, and the other with an average insert size of 1 kb. A total of 8×≥Q20 sequence coverage was obtained: 14,400 reads (2× coverage) from the 4-kb plasmid library plus 43,200 reads (6× coverage) from the 1-kb plasmid library. The finishing effort began with the program AUTOFINISH , followed by manual manipulation of the assembly to solve repetitive regions. Gap identification was facilitated by aligning sequence contigs to previously sequenced strains using GENOMELINK. All sequence gaps were filled by primer-walking on spanning plasmids and by sequencing PCR fragments. The origin of replication was defined using GENSKEW (http://mips.gsf.de/services/analysis/genskew). Protein-coding genes were identified by combining predictions from GLIMMER , ORPHEUS , CRITICA , and GENEMARKS with BLASTX comparisons against published E. coli and Salmonella genomes. Gene functions were assigned based on BLASTP searches of the nr database (www.ncbi.nlm.nih.gov) and ECOCYC (http://ecocyc.org) . tRNA genes were detected with TRNASCAN-SE , whereas rRNA genes were identified based on sequence conservation. Genome and plasmid sequences have been deposited in GenBank [accession nos. CP000243 (UTI89 Chromosome) and CP000244 (pUTI89)].Estimation of core genome and pan-genome sizes.
Similar to Tettelin et al. , a gene from a given genome was considered conserved if, according to BLASTP, a hit with at least 50% identity over 50% of the encoded protein length was found in another E. coli genome. Genes that were conserved across all genomes were considered shared genes. Each genome was weighted equally and considered independently. The number of shared genes was calculated by using only some or all of the seven genome sequences; this allowed a least-squares fit to an exponential function, Fc = κc exp[-n/τc] + Ω, where n is the number of genomes used to calculate the number of shared genes, Fc is the average number of shared genes for a given n, and κc, τc, and Ω are parameters to be fit that characterize the offset and decay of the function, as in Tettelin et al. . Ω is the predicted size of the core genome (genes present in all E. coli strains). For the E. coli data, the values were: κc = 5,235, τc = 1.000, and Ω = 2,865 (sum of squared error = 13,204; r2 = 0.913).The predicted number of genes added to the pan-genome (set of all genes present in any E. coli) for new genome sequences was calculated by fitting another exponential function, Fs = κs exp[-n/τs] + tg(θ), where n is the number of genomes used in the calculation; Fs is the average number of new genes added by the nth genome; and κs, τs, and tg(θ) are parameters to be fit, as in Tettelin et al. . The value tg(θ) is the predicted number of strain-specific genes added to the pan-genome by each new E. coli genome sequence; if it is positive, the pan-genome is predicted to be open (it grows with each new genome sequence, regardless of the number of existing genome sequences). For the E. coli data, the values were: κs = 1,960, τs = 2.363, and tg(θ) = 440.7 (sum of squared error = 1,083; r2 = 0.991).
Reciprocal best blast hits.
Each annotated protein sequence (A) from a given genome (G) was used as a query for the BLASTP program to search against a second genome (H). The best BLASTP hit (B) was then used as a query for BLASTP to search the first genome (G). If the best BLASTP hit for B in G was A, then A and B were called reciprocal "best BLAST" hits. A and B were required to have a minimum of 80% amino acid sequence identity over at least 80% of their length. All possible pair-wise comparisons between the seven available E. coli genomes were performed, and the results grouped into sets where each gene was a reciprocal best BLAST hit of all the other genes in the set, and where one of the genes was from the UTI89 genome.Sequence alignment.
For a set of reciprocal best BLAST hits, protein sequences were aligned by using CLUSTALW with default parameters. This alignment was then imposed upon the corresponding nucleotide sequences.Phylogenetic trees.
The PHYLIP program DNAPARS was used to generate a maximum parsimony tree. Sequence input order was randomized 1,000 times, and all other options were left at their default values. The first tree reported was used.Sample data.
A compressed file, ‘example_of_analysis_fepE.zip’, containing data for (i) the fepE gene, (ii) control files and instructions for running all the programs used in the analysis, and (iii) corresponding output files is available as Dataset 1. These sample data files show how each step of the analysis of the several genome sequences was performed.Primers for resequencing genes.
The same primers were used for amplification and sequencing of PCR products from genomic DNA. Primers for amiA were 5'-AGGAATGTCGCAAGCCATCG-3' and 5'-CGGTTTTCGCGTTCAGACAG-3'. Primers for fepE were 5'-CTCTGGCGTCGCCCAGTAAT-3' and 5'-GACGAACGGCACCTTCAACC-3'. Primers for ompC were 5'-TGGTTGTCGTCCAGCAGGTT-3' and 5'-TGGTAGCAGGCGCAGCAAAC-3'. Primers for adk were 5'-ATTCTGCTTGGCGCTCCGGG-3' and 5'-CCGTCAACTTTCGCGTATTT-3'. Primers for icd were 5'-ATGGAAAGTAAAGTAGTTGTTCCGGCACA-3' and 5'-GGACGCAGCAGGATCTGTT-3'. Primers for mdh were 5'-CTTCCAGCGCGTTCTGTTCA-3' and 5'-ATGAAAGTCGCAGTCCTCGGCGCTGCTGGCGG-3'.References
1. Blum, G., Ott, M., Lischewski, A., Ritter, A., Imrich, H., Tschape, H. & Hacker, J. (1994) Infect. Immun. 62, 606-614.
2. Blum, G., Ott, M., Cross, A. & Hacker, J. (1991) Microb. Pathog. 10, 127-136.
3. Locht, C., Geoffroy, M.-C. & Renauld, G. (1992) EMBO J. 11, 3175-3183.
4. Rojas, C. M., Ham, J. H., Deng, W. L., Doyle, J. J. & Collmer, A. (2002) Proc. Natl. Acad. Sci. USA 99, 13142-13147.
5. Roberts, J. A., Marklund, B.-I., Ilver, D., Haslam, D., Kaack, M. B., Baskin, G., Louis, M., Mollby, R., Winberg, J. & Normark, S. (1994) Proc. Natl. Acad. Sci. USA 91, 11889-11893.
6. Hantke, K., Nicholson, G., Rabsch, W. & Winkelmann, G. (2003) Proc. Natl. Acad. Sci. USA 100, 3677-3682.
7. Danese, P. N., Pratt, L. A., Dove, S. L. & Kolter, R. (2000) Mol. Microbiol. 37, 424-432.
8. Torres, A. G., Redford, P., Welch, R. A. & Payne, S. M. (2001) Infect. Immun. 69, 6179-6185.
9. Okeke, I. N., Scaletsky, I. C., Soars, E. H., Macfarlane, L. R. & Torres, A. G. (2004) J. Clin. Microbiol. 42, 36-44.
10. Rakin, A., Noelting, C., Schubert, S. & Heesemann, J. (1999) Infect. Immun. 67, 5265-5274.
11. Welch, R. A., Burland, V., Plunkett, G., 3rd, Redford, P., Roesch, P., Rasko, D., Buckles, E. L., Liou, S. R., Boutin, A., Hackett, J., et al. (2002) Proc. Natl. Acad. Sci. USA 99, 17020-17024.
12. Schubert, S., Rakin, A., Fischer, D., Sorsa, J. & Heesemann, J. (1999) FEMS Microbiol. Lett. 179, 409-414.
13. Schubert, S., Rakin, A., Karch, H., Carniel, E. & Heesemann, J. (1998) Infect. Immun. 66, 480-485.
14. Schubert, S., Cuenca, S., Fischer, D. & Heesemann, J. (2000) J. Infect. Dis. 182, 1268-1271.
15. Karch, H., Schubert, S., Zhang, D., Zhang, W., Schmidt, H., Olschlager, T. & Hacker, J. (1999) Infect. Immun. 67, 5994-6001.
16. Koczura, R. & Kaznowski, A. (2003) J. Med. Microbiol. 52, 637-642.
17. Hung, D. L., Knight, S. D., Woods, R. M., Pinkner, J. S. & Hultgren, S. J. (1996) EMBO J. 15, 3792-3805.
18. Sauer, F. G., Barnhart, M., Choudhury, D., Knight, S. D., Waksman, G. & Hultgren, S. J. (2000) Curr. Opin. Struct. Biol. 10, 548-556.
19. Sauer, F. G., Futterer, K., Pinkner, J. S., Dodson, K. W., Hultgren, S. J. & Waksman, G. (1999) Science 285, 1058-1061.
20. Barnhart, M. M., Pinkner, J. S., Soto, G. E., Sauer, F. G., Langermann, S., Waksman, G., Frieden, C. & Hultgren, S. J. (2000) Proc. Natl. Acad. Sci. USA 97, 7709-7714.
21. Dodson, K. W., Pinkner, J. S., Rose, T., Magnusson, G., Hultgren, S. J. & Waksman, G. (2001) Cell 105, 733-743.
22. Langermann, S., Palaszynski, S., Barnhart, M., Auguste, G., Pinkner, J. S., Burlein, J., Barren, P., Koenig, S., Leath, S., Jones, C. H., et al. (1997) Science 276, 607-611.
23. Hung, C.-S., Bouckaert, J., Hung, D., Pinkner, J., Widberg, C., De Fusco, A., Auguste, C. G., Strouse, B., Langerman, S., Waksman, G., et al. (2002) Mol. Microbiol. 44, 903-915.
24. Li, B., Koch, W. H. & Cebula, T. A. (1997) Mol. Cell Probes 11, 397-406.
25. Bingen, E. (1998) Arch. Pediatr. 5, 279S-281S.
26. Stromberg, N., Marklund, B. I., Lund, B., Ilver, D., Hamers, A., Gaastra, W., Karlsson, K. A. & Normark, S. (1990) EMBO J. 9, 2001-2010.
27. Stromberg, N., Nyholm, P.-G., Pascher, I. & Normark, S. (1991) Proc. Natl. Acad. Sci. USA 88, 9340-9344.
28. Striker, R., Nilsson, U., Stonecipher, A., Magnusson, G. & Hultgren, S. J. (1995) Mol. Microbiol.. 16, 1021-1030.
29. Dobrindt, U., Janke, B., Piechaczek, K., Nagy, G., Ziebuhr, W., Fischer, G., Schierhorn, A., Hecker, M., Blum-Oehler, G. & Hacker, J. (2000) Int. J. Med. Microbiol. 290, 307-311.
30. Korhonen, T., Vaisanen-Rhen, V., Rhen, M., Pere, A., Parkkinen, J. & Finne, J. (1984) J. Bacteriol. 159, 762-766.
31. Kunin, C. M., Tong, H. H., Krishnan, C., Van Arsdale White, L. & Hacker, J. (1993) Clin. Infect. Dis. 16, 412-416.
32. Pere, A., Nowicki, B., Saxen, H., Siitonen, A. & Korhonen, T. K. (1987) J. Infect. Dis. 156, 567-574.
33. Buckles, E. L., Bahrani-Mougeot, F. K., Molina, A., Lockatell, C. V., Johnson, D. E., Drachenberg, C. B., Burland, V., Blattner, F. R. & Donnenberg, M. S. (2004) Infect. Immun. 72, 3890-3901.
34. Makino, K., Ishii, K., Yasunaga, T., Hattori, M., Yokoyama, K., Yutsudo, C. H., Kubota, Y., Yamaichi, Y., Iida, T., Yamamoto, K., et al. (1998) DNA Res. 5, 1-9.
35. Burland, V., Shao, Y., Perna, N. T., Plunkett, G., Sofia, H. J. & Blattner, F. R. (1998) Nucleic Acids Res. 26, 4196-4204.
36. Bauer, M. E. & Welch, R. A. (1996) Infect. Immun. 64, 167-175.
37. Tatsuno, I., Horie, M., Abe, H., Miki, T., Makino, K., Shinagawa, H., Taguchi, H., Kamiya, S., Hayashi, T. & Sasakawa, C. (2001) Infect. Immun. 69, 6660-6669.
38. Lathem, W. W., Grys, T. E., Witowski, S. E., Torres, A. G., Kaper, J. B., Tarr, P. I. & Welch, R. A. (2002) Mol. Microbiol. 45, 277-288.
39. Stevens, M. P., Roe, A. J., Vlisidou, I., van Diemen, P. M., La Ragione, R. M., Best, A., Woodward, M. J., Gally, D. L. & Wallis, T. S. (2004) Infect. Immun. 72, 5402-5411.
40. Smajs, D. & Weinstock, G. M. (2001) J. Bacteriol. 183, 3958-3966.
41. Nataro, J. P., Seriwatana, J., Fasano, A., Maneval, D. R., Guers, L. D., Noriega, F., Dubovsky, F., Levine, M. M. & Morris, J. G., Jr. (1995) Infect. Immun. 63, 4721-4728.
42. Yang, Z. (1997) Comput. Appl. Biosci. 13, 555-556.
43. Sawyer, S. (1989) Mol. Biol. Evol. 6, 526-538.
44. Jakobsen, I. B. & Easteal, S. (1996) Comput. Appl. Biosci. 12, 291-295.
45. Gordon, D., Desmarais, C. & Green, P. (2001) Genome Res. 11, 614-625.
46. Delcher, A. L., Harmon, D., Kasif, S., White, O. & Salzberg, S. L. (1999) Nucleic Acids Res. 27, 4636-4641.
47. Frishman, D., Mironov, A., Mewes, H. W. & Gelfand, M. (1998) Nucleic Acids Res. 26, 2941-2947.
48. Badger, J. H. & Olsen, G. J. (1999) Mol. Biol. Evol. 16, 512-524.
49. Besemer, J., Lomsadze, A. & Borodovsky, M. (2001) Nucleic Acids Res. 29, 2607-2618.
50. Keseler, I. M., Collado-Vides, J., Gama-Castro, S., Ingraham, J., Paley, S., Paulsen, I. T., Peralta-Gil, M. & Karp, P. D. (2005) Nucleic Acids Res. 33, D334-D337.
51. Lowe, T. M. & Eddy, S. R. (1997) Nucleic Acids Res. 25, 955-964.
52. Tettelin, H., Masignani, V., Cieslewicz, M. J., Donati, C., Medini, D., Ward, N. L., Angiuoli, S. V., Crabtree, J., Jones, A. L., Durkin, A. S., et al. (2005) Proc. Natl. Acad. Sci. USA 102, 13950-13955.