| This Article | |
| Abstract | |
| Full Text | |
| Services | |
| Alert me to new issues of the journal | |
| Request Copyright Permission | |
| ||||||||||||||||||
|
Keeling and Inagaki. 10.1073/pnas.0404505101. |
Fig. 3. FD sites predicted for eEF-1a NMñEFL comparisons. Corresponding tables for eEF-1aNMñaEF-1a , eEF-1aNMñeRF3, and eEF-1aNMñ eEF-1a M comparisons are available on request from the authors.
Fig. 4. Alignment of representative eEF-1a , EFL, RF3, HBS1, and aEF-1asequences.
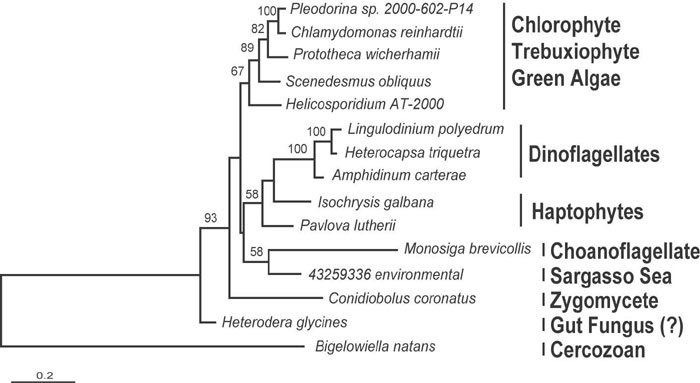
Fig. 5. Bayesian phylogeny of EFL based on 411 positions and 24 taxa. Numbers at nodes correspond to bootstrap support from protein ML (ProML).

Fig. 6. 3D distribution of the FD sites detected across nonmicrosporidian EF-1aand EFL subtrees on yeast EF-1a-EF-1b -GDP complex (Protein Data Bank ID code 1IJF). Crystal structure of yeast eEF-1a and EF-1b are shown in blue and red, respectively. (A) Distribution of the FD sites associated with significant ∆SR (i.e. type I FD sites). Type I FD sites are highlighted in orange. (B) Distribution of type II FD sites (shown in yellow). (C) Distribution of the FD sites overlapped with the putative binding sites. Types I and II FD sites overlapped with the putative binding sites are shown in silver and green, respectively.