Abstract
Shigella spp. are the leading bacterial cause of severe childhood diarrhoea in low- and middle- income countries (LMICs), are increasingly antimicrobial resistant and have no widely available licensed vaccine. We performed genomic analyses of 1,246 systematically collected shigellaesampled from seven countries in sub-Saharan Africa and South Asias as part of the Global Enteric Multicenter Study (GEMS) between 2007 and 2011, to inform control and identify factors that could limit the effectiveness of current approaches. Through contemporaneous comparison among major subgroups, we found that S. sonnei contributes ≥6-fold more disease than other Shigella species relative to its genomic diversity and highlight existing diversity and adaptative capacity among S. flexneri that may generate vaccine escape variants in <6 months. Furthermore, we show convergent evolution of resistance against ciprofloxacin, the current WHO recommended antimicrobial for the treatment of shigellosis, among shigella isolates. This demonstrates the urgent need to integrate existing genomic diversity into vaccine and treatment plans for Shigella, providing a framework for the focused application of comparative genomics for guiding vaccine development, and the optimisation of control and prevention strategies for other pathogens relevant for public health policy considerations.
Introduction
Shigellosis is a diarrhoeal disease responsible for approximately 212,000 annual deaths and accounting for 13.2% of all diarrhoeal deaths globally 1 . The Global Enteric Multicenter Study (GEMS) was a large case-control study conducted between 2007 and 2011, investigating the aetiology and burden of moderate-to-severe diarrhoea (MSD) in children less than five years old in low- and middle-income countries (LMICs) 2 . GEMS revealed shigellosis as the leading bacterial cause of diarrhoeal illness in children, who represent a major target group for vaccination 3 . The aetiological agents are Shigella, a Gram-negative genus comprised of S. flexneri, S. sonnei, S. boydii and S. dysenteriae, with the former two species causing the majority (90%) of attributable shigellosis in children in LMICs 3 . Currently, the disease is primarily managed through supportive care and antimicrobial therapy. However, there has been an increase in antimicrobial resistance (AMR) among Shigella 4 . Particularly concerning is the rise of resistance against the fluoroquinolone antimicrobial ciprofloxacin, the current World Health Organisation (WHO) recommended treatment, such that fluoroquinolone-resistant (FQR) Shigella is one of a dozen pathogens for which WHO notes new antimicrobial therapies are urgently needed 5 . The disease burden and increasing AMR of Shigella call for improvements in treatment and management options for shigellosis, and significant momentum has built to rise to this challenge.
However, there is no licenced vaccine widely available for Shigella and one of the main challenges in its development is the considerable genomic and phenotypic diversity of the organisms 6 . The distinct lipopolysaccharide (LPS) O-antigen structures of Shigella determine its serotype and is responsible for conferring the short to medium term serotype-specific immunity following infection 7-10 . Hence, considerable efforts are focused on generating O-antigen specific vaccines. However, with the exception of the single serotype S. sonnei, each species encompasses multiple diverse serotypes: 14 serotypes/subserotypes for S. flexneri, 19 for S. boydii and 15 for S. dysenteriae 11 . Thus, for serotype-targeted vaccine approaches, multivalent vaccines are proposed to provide broad protection against disease 12 . While O-antigen conjugates are a leading strategy, challenge studies have recently demonstrated poor clinical efficacy 13,14 . An attractive alternative and/or complement to serotype-targeted vaccine formulations are specific subunit vaccines which target highly conserved proteins and may offer broad protection. There are several candidates in development that have demonstrated protection in animal models 15,16 , but the degree of antigenic variation for these targets among the global Shigella population remains unknown. Other strategies being explored include vaccines combining protein and serotype antigens, such as Generalized Modules of Membrane Antigens (GMMA), which involves use of outer membrane particles derived from genetically modified S. sonnei to elicit a stronger immune response 17 . However, GMMA also failed to demonstrate clinical efficacy against shigellosis in a recent challenge study 18 , indicating the continuing challenges of Shigella vaccinology.
Whole-genome sequencing analysis (WGSA) provides sufficient discriminatory power to resolve phylogenetic relationships and characterise diversity of bacterial pathogens, essential to informing vaccine development and other aspects of disease control 19,20 . However, these critical analysis tools are yet to be applied to a pathogen collection appropriate for broadly informing shigellosis control in the critical demographic of children in LMICs. Here, we apply WGSA to Shigella isolates sampled during GEMS, representing 1,246 systematically collected isolates from across seven nations in sub-Saharan Africa and South Asia with some of the greatest childhood mortality rates 2,21 . We found evidence of the potential benefit of genomic subtype-based targeting, characterised pathogen features that will complicate current vaccine approaches, and highlighted regional differences among Shigella diversity, as well as determinants of AMR, including convergent evolution toward resistance against currently recommended treatments. Our analysis of this unparalleled pathogen collection informs the control and prevention of shigellosis in those populations most vulnerable to disease.
Regional diversity of Shigella spp. across LMICs
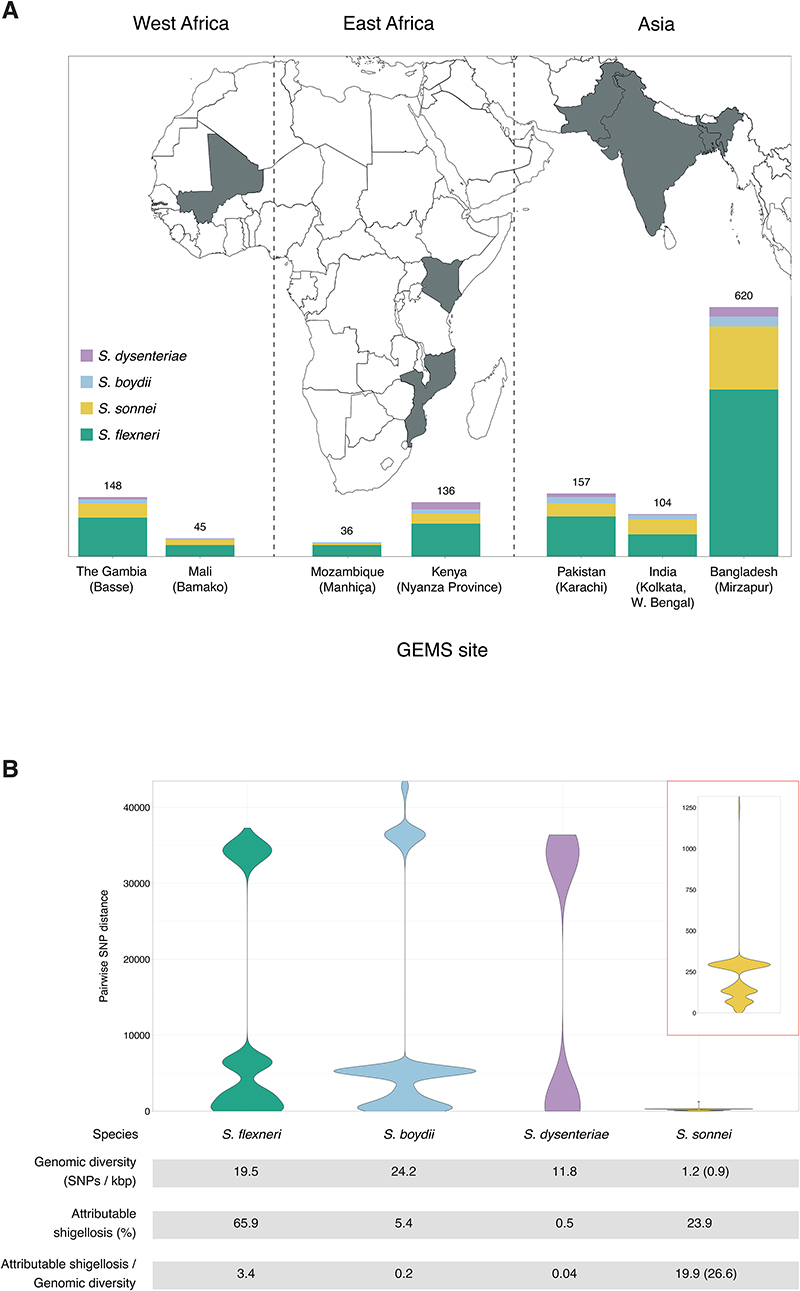
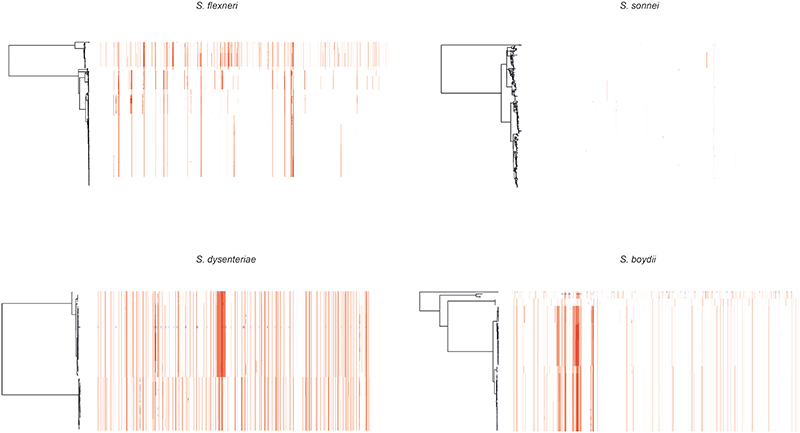
To date, this is the largest representative dataset of Shigella genomes from LMICs (n=1246), collected across seven sites from Asia, West Africa and East Africa, comprised of 806 S. flexneri, 305 S. sonnei, 75 S. boydii and 60 S. dysenteriae (Fig. 1A). To compare the genomic diversity of Shigella species, we determined the distributions of pairwise single-nucleotide polymorphism (SNP) distances and scaled the total detected SNPs against the length of the chromosome (in kbp) for each species (Fig. 1B). This revealed that S. boydii contained the greatest diversity (24.2 SNPs/kbp), followed by S. flexneri (19.5 SNPs/kbp) and S. dysenteriae (11.8 SNPs/kbp), with S. sonnei being >9.8-fold less diverse (1.2 SNPs/kbp) or >13.1-fold less diverse (0.9 SNPs/kbp) excluding two outliers (see below, Fig. 1B). This revealed that S. sonnei caused more disease relative to genomic diversity than S. flexneri (5.9-fold) and either S. dysenteriae (497.5-fold) or S. boydii (99.5-fold) (Fig. 1B). However, when stratified by serotype/subserotype or genomic subtype, S. sonnei had a more comparable diversity and less pronounced increase in disease burden relative to genomic diversity (1.1 – 22.1-fold higher by serotype/subserotype and 1.2 – 4.9-fold higher by genomic subtype) (fig. S1 and fig. S2). Further analyses revealed that the reduced diversity of S. sonnei (measured in chromosomal SNPs) was also reflected by a reduced accessory genome repertoire (Extended data 1) and less recombination events across the genomes (Extended data 2) relative to other species. This indicates the value of vaccination against S. sonnei as a comparatively conserved target relative to disease burden, and its comparability to subtypes of other Shigella spp.
Fig. 1. The diversity of Shigella spp. across seven LMICs.
(A) Stacked bar graphs illustrate the number of isolates from each Shigella spp. sequenced from GEMS and used in the current study, grouped by countries. The seven countries from GEMS are highlighted in grey on the map and the selected field site(s) from each country are shown in brackets. (B) Pairwise genomic distances (in SNPs) among Shigella isolates within subgroups are shown as violin plots. A magnified plot for S. sonnei is displayed inside the red box. Table below the plots demonstrates for each species the genomic diversity (as measure by total number of SNPs per kbp [methods]), the contribution to GEMS shigellosis burden and the shigellosis burden relative to genomic diversity. For S. sonnei, the genomic diversity and shigellosis burden relative to genomic diversity calculated excluding the two outliers are shown in brackets.
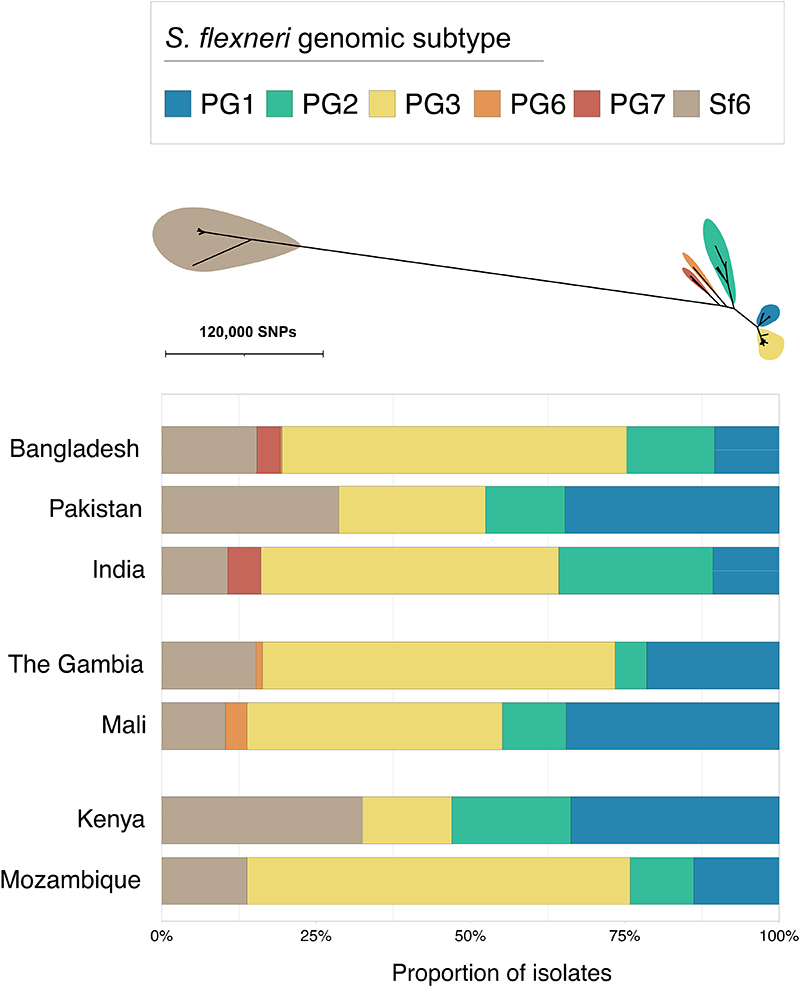
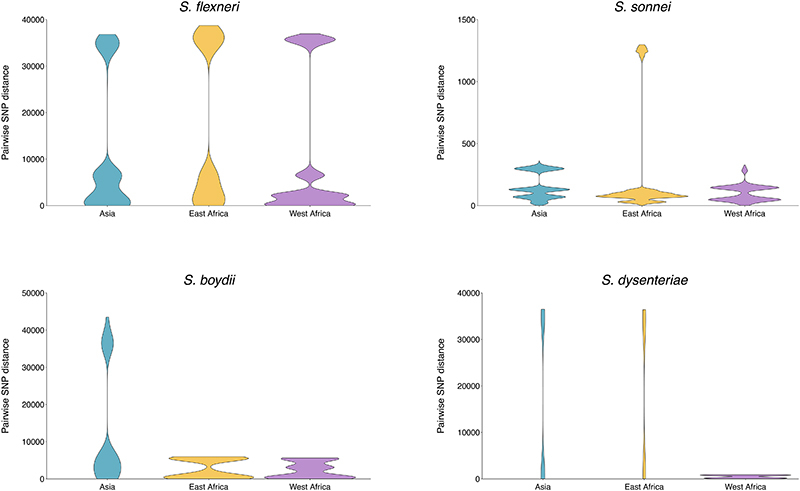
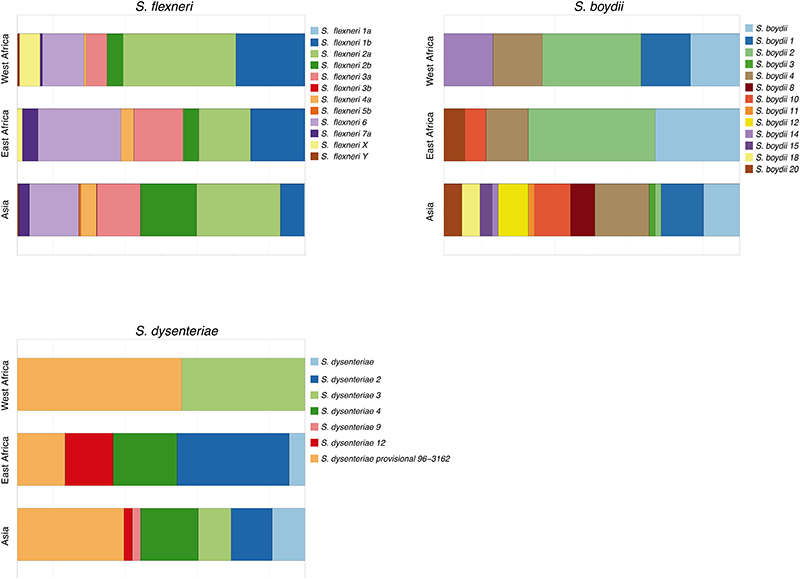
Early global population structure studies revealed that each Shigella species is delineated into multiple WGSA subtypes 22-25 . Specifically, S. flexneri is comprised of seven phylogroups (PGs) 22 and S. sonnei of five lineages 26 . To describe the genomic epidemiology of the GEMS Shigella within existing frameworks we constructed species phylogenetic trees and integrated these with epidemiological metadata and publicly available genomes. The S. flexneri phylogeny revealed two distinct lineages separated by ~34,000 SNPs; one comprising five previously described PGs 22 and a distant clade comprised largely of S. flexneriserotype 6 isolates (herein termed Sf6), contributing distinctly to the disease burden of each country (Fig. 2 and fig. S3). Phylogenetic analysis of S. sonnei revealed that all but two isolates belonged to the globally dominant multidrug resistant (MDR) Lineage III 23 (fig. S4). For S. boydii and S. dysenteriae, a total of three and two previously described phylogenetic clades 25,27 were identified, respectively (fig. S5). Marked phylogenetic association of isolates with country of origin prompted an examination of species genomic diversity by region (East Africa, West Africa and Asia) and revealed that while S. flexneri diversity was comparable across regions, diversity varied by region for the remaining species (Extended data 3). Specifically, S. sonnei was more genomically diverse in East Africa owing to the presence of two Lineage II isolates from Mozambique. For S. boydii, Asia contained greater diversity than African regions, owing to isolates belonging to additional clades. S. dysenteriae diversity was lower in West Africa relative to other regions by virtue of having only one circulating clade. Except for S. sonnei, similar trends were also observed for regional Shigella serotype/subserotype diversity (Extended data 4). These geographical differences highlight the importance of considering regional variations during vaccine development and that vaccine candidates should be evaluated across multiple regions.
Fig. 2. The diversity of S. flexneri genomic subtypes across seven GEMS study sites.
An unrooted ML phylogenetic tree of S. flexneri genomes identified six distinct genomic subtypes, each highlighted in a different colour according to the inlaid key displayed above the tree. The barplot below demonstrates the relative frequencies of the subtypes at each GEMS site.
One limitation of the GEMS dataset is its constraints in geographical regions and time (being sampled between 2007 and 2011). However, several pieces of evidence support the utility of GEMS as being representative of Shigella in time and space. Specifically, the prevalence and regional distribution of Shigella serotypes across African GEMS sites was similar to those observed in the replicate Vaccine Impact of Diarrhea in Africa (VIDA) study conducted between 2015 and 2018 28 . Furthermore, recent largescale genomic analyses of S. sonnei revealed that isolates sampled from a broad range South Asian countries belonged to the same genomic subtype as the majority of GEMS isolates 26 . And finally, publicly available data for S. flexneri from LMICs sampled to 2021 were phylogenetically admixed with GEMS isolates (see below and fig Extended data 7). Thus, GEMS has ongoing relevance as being representative of the diversity of Shigella targeted for control.
Genomic subgroups as an alternative targeting method
As GEMS was a case-control study, the dataset comprised Shigella case isolates derived from patients with MSD and control isolates from children without diarrhoea 2 (see methods). To explore the utility of vaccination targeting genomic subtype (relative to targeting serotype) for S. flexneri, we determined the relative effect size of the dominant subtype on the epidemiological outcome of shigellosis (i.e., isolates derived from case patients rather than from controls). The dominant genomic subtype was PG3, which comprised the majority (47%, 378/806) of total isolates, as well as case (50%, 341/687) isolates, with some regional variation (Fig. 2). This resulted in an increased odds of cases (OR = 2.3, 95% CI = 1.5-3.6, p = 0.0001) for PG3 compared with other genomic subtypes (PGs and Sf6) (methods, table S4). The association of cases with the dominant serotype, S. flexneri serotype 2a (accounting for 29% [234/806] of total isolates and 31% [210/687] of case isolates) also resulted in an increased odds of cases (OR = 1.9, 95% CI = 1.7-3.2, p = 0.0099) (table S4). But the higher prevalence and larger effect size of PG3 relative to serotype 2a on case status offers compelling evidence that targeting vaccination by phylogroup might offer broader coverage per licenced vaccine relative to a serotype-specific approach. Hence, finding common surface exposed antigens that are conserved within phylogroups causing the major burden of disease may be an effective vaccine design approach that can provide greater efficacy than serotype-targeted vaccines.
Diversity of S. flexneri relevant to serotype-targeted vaccines
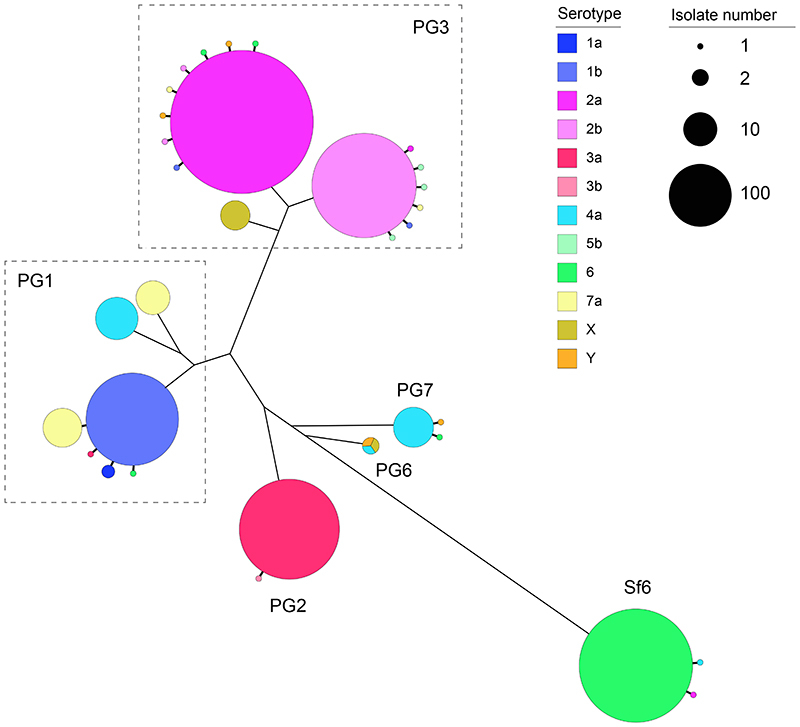
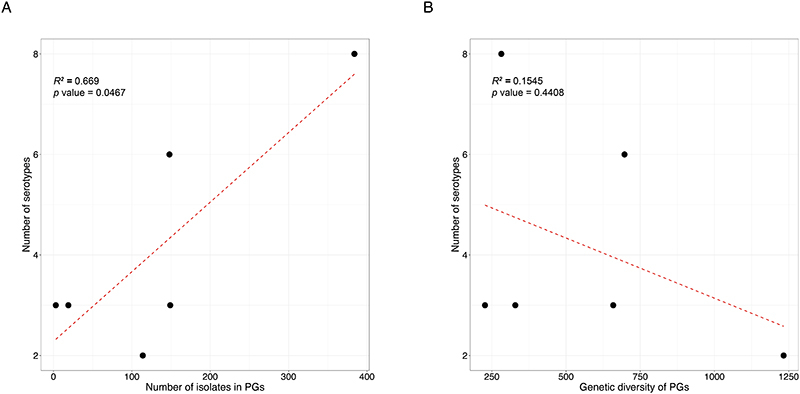
The development of serotype-targeted vaccines is complicated by the diversity and distribution of serotypes, which are heterogenous over time and geography 8,21,29,30 . Furthermore, genetic determinants of O-antigen modification are often encoded on mobile genetic elements 31,32 that can move horizontally among and within bacterial populations, causing the recognised, but poorly quantified phenomenon of serotype switching 22,30,31 . Resulting in the rapid escape of infection induced immunity against homologous serotypes. For our analyses of serotype switching, we focused on S. flexneri owing to its high disease burden and serotypic diversity. Phenotypic serotyping data were overlaid onto the phylogeny and revealed that while generally there was a strong association of genotype (i.e. PG/Sf6) with serotype (Fisher’s exact test; p<2.20E-16), multiple serotypes were observed for each genotype (Fig. 3). The greatest serotype diversity was observed in PG3, comprised of seven distinct serotypes and two subserotypes. Correlation of serotypic diversity (number of serotypes) and genomic diversity (maximum pairwise SNP distance within genotype) revealed no evidence for an association (Extended data 5). However, a significant positive correlation of serotypic diversity with the number of isolates in each genotype was found, indicating that serotype diversity scales with prevalence.
Fig. 3. Diversity of S. flexneri population with respect to serotype switching.
The unrooted S. flexneri phylogenetic tree is shown with the five phylogroups (PG1-PG7) and Sf6 labeled accordingly. For each genomic subtype, monophyletic clusters of the dominant serotype are shown collapsed into bubbles coloured according to the inlaid key. Single isolate or groups of isolates within a subtype of an alternative serotype are represented by further branches, indicating a single serotype switch. The dotted trangles group together subgenomic clusters belonging to the same PG. The number of isolates within a single cluster is represented through bubble size.
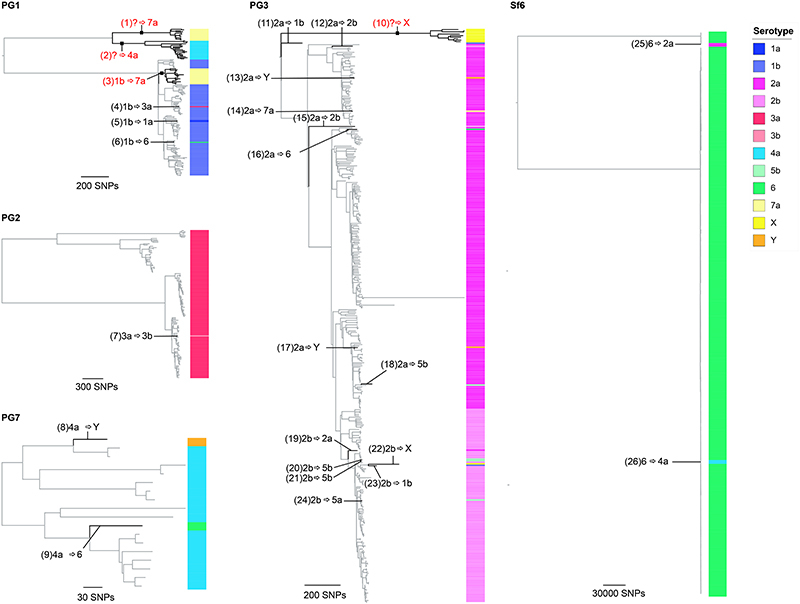
To qualitatively and quantitatively determine serotype switching across S. flexneri, we examined the number of switches occurring within each genotype. A switching event was inferred when a serotype emerged (either as a singleton or monophyletic clade) that was distinct from the majority (>65%) serotype within a genotype (Fig. 3 and Extended data 6). PG6 was excluded from the analysis, as only three isolates from GEMS belonged to this genotype and a dominant serotype could not be inferred. Quantitatively, this revealed serotype switching was infrequent, with only 26 independent switches (3.3% of isolates) identified across the five S. flexneri genotypes. Although the frequency of switching varied across the genotypes, statistical support for an association of serotype switching with genotype fell short of significance (Fisher’s exact test; p = 0.09). Qualitatively, the majority (22/26) of switching resulted in a change of serotype, with few (4/26) resulting in a change of subserotype. Examination of O-antigen modification genes revealed that serotype switching was facilitated by changes in the presence or absence of various phage-encoded gtr and oac genes in the genomes, as well as point mutations in these genes (table S5). Our data also revealed that few (4/26) switching events resulted in more than two descendant isolates (Extended data 6). This indicates that while natural immunity drives the fixation of relatively few serotype-switched variants in the short term, the potential pool of variants that could be driven to fixation by vaccine-induced selective pressure following a serotype-targeted vaccination program is much larger.
In order to estimate the likely timeframe over which serotype switching events might be expected to occur, we estimated the divergence time of the phylogenetic branch giving rise to each switching event. To streamline the analysis, we focused on two subclades of PG3, the most prevalent phylogroup, in which seven independent serotype switching events were detected (fig. S6). Based on the timeframes observed within our sample (spanning 4 years from 2007 to 2010), serotype switching was estimated to occur within an average of 348 days, ranging from 159 days (95% highest posterior density [HPD]: 16 - 344) to 10206 days (28 years) (95% HPD: 5494 - 15408) (table S6). Taken together, our data shows that although serotype-switching frequency is low, it can occur over relatively short timeframesand lead to serotype replacement such that non-vaccine serotypes could replace vaccine serotypes following a vaccination program, as has been observed for Streptococcus pneumoniae 33,34 . Consequently, serotype switching may impact the long-term effectiveness of vaccines that only provide serotype-specific protection against O-antigens. This highlights the advantages of protein-based or multivalent component approaches, such as the Invaplex or live attenuated vaccines that target both carbohydrates and protein antigens 6,35 .
Heterogeneity among Shigella vaccine protein antigens
Although conserved antigen-targeted vaccines can overcome some hurdles of serotype-targeted vaccines, they are also subject to complications arising from genetic diversity. Hence, we performed detailed examination of six protein antigens that are currently in development and have demonstrated protection in animal models (table S1). First, we assessed the distribution of the candidates among GEMS Shigella isolates which revealed that the proportional presence of antigens varied across species and with genetic context (fig. S7A). Specifically, genes encoded on the virulence plasmid (ipaB, ipaC, ipaD, icsP) were present in >85% of genomes for each species, with the exception of S. sonnei. The low proportion (≤5%) of virulence plasmid encoded genes detected among S. sonnei was caused by a similarly low detection of the virulence plasmid among S. sonnei (6%) (fig. S7B), which likely arose due to loss during sub-culture 36 . In contrast, the chromosomally encoded ompA was present in >98% of all isolates. While the sigA gene (carried on the chromosomally integrated SHI-1 pathogenicity island) was present in 99% of S. sonnei genomes, it was identified in only 63% of S. flexneri genomes. Notably, among S. flexneri genomes, the sigA gene was exclusively found in PG3 and Sf6, and present in >96% of isolates in each genotype (fig. S3), indicating an appropriate distribution for targeting the two genotypes. Second, we assessed the antigens for amino acid variation and modelled the likely impact of detected variants, since antigen variation may also lead to vaccine escape, as demonstrated for the P1 variant of SARS-CoV2 37,38 . We determined the distribution of pairwise amino acid (aa) sequence identities per antigen against S. flexneri vaccine strains for each species (see methods). Overall, sequence identities were >90% but varied with antigen (fig. S7A). For example, OmpA was present in the highest proportion of genomes, but showed ~5% sequence divergence, while SigA was present in fewer genomes, but exhibited little divergence (<0.5%) among species. The least conserved sequence was IpaD, ranging from 3 to 7% divergence within species.
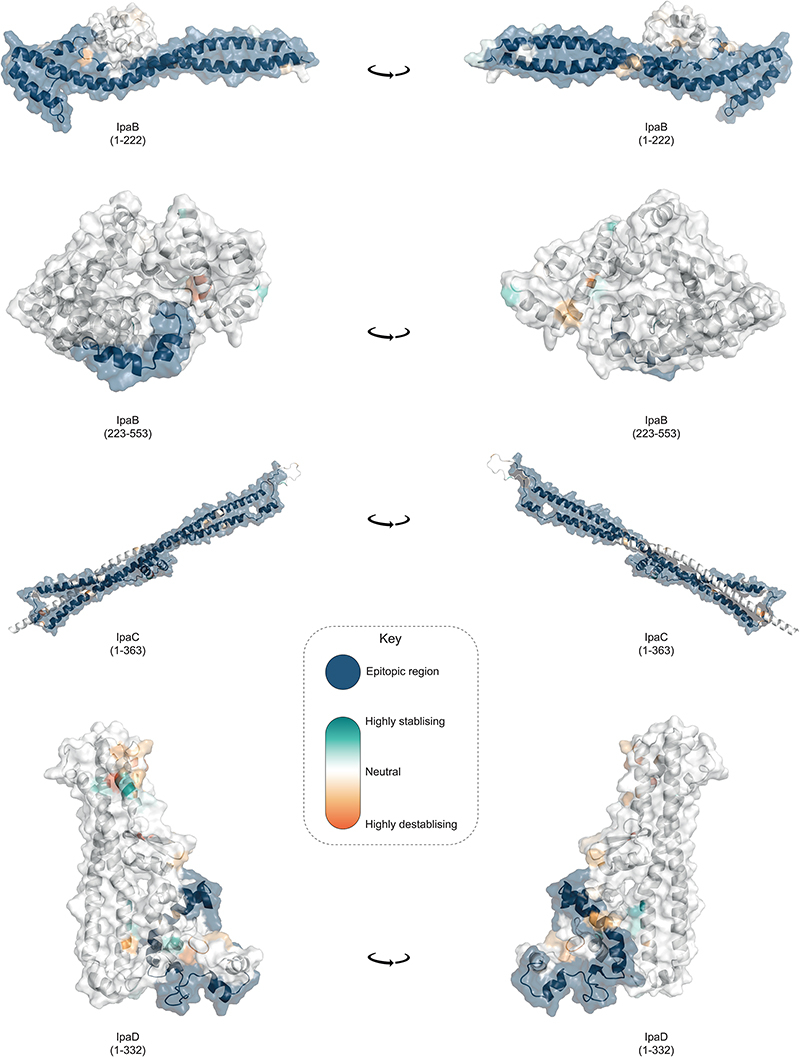
Not all antigenic variation will affect antibody binding, so we performed in silico analyses of the detected variants to assess whether they may compromise the antigens as vaccine targets. Again, we focused our analyses on S. flexneri owing to its high disease burden and the likely complication of serotype-based vaccination strategies for this species. Furthermore, as Shigella vaccines are likely to be used broadly across LMICs, we expanded the analyses to include an additional 236 publicly available S. flexneri genomes (collected from 2007 and 2021, and sampled from various countries across Asia and Africa) which were phylogenetically admixed with the GEMS isolates (Extended data 7). A total of 148 aa variants were detected across the six antigens, 58 (39%) of which are associated with genotype (i.e. belonging to either PGs 1-5 or Sf6). Among the total variants detected, only 15 (10%) were unique to the publicly available genomes (Extended data 7 and table S8), indicating that GEMS dataset captured the majority of the diversity across LMICs. We then determined if aa variants were located in immunogenic regions (i.e. epitope/peptide fragment) (fig. S8) and assessed their potential destabilization of protein structure through in silico protein modelling. For IpaB, IpaC and IpaD, the epitopes have been empirically determined 39,40 . The sequence and location of peptide fragments of SigA, IcsP and OmpA used in vaccine development are available 41,42 . Variants located within the immunogenic regions were identified for all antigens relative to PG3 reference sequences (methods, Fig. 4). Only 5 of 148 variants were predicted to be highly destabilising to protein structure, and these occurred in: OmpA (residue 89) at a periplasmic turn, SigA (residues 1233 and 1271) in adjacent extracellular turns in the translocator domain (fig. S9), IcsP (residue 191) within the extracellular region of the beta barrel, and in IpaD (residue 247) within a beta-turn-beta motif flanking the intramolecular coiled-coil (Fig. 4). None of the five destabilising variants were located within the epitope/peptide region of the vaccine candidates.
Fig. 4. Visualization of mutations and its predicted effect on modeled IpaB, IpaC and IpaD protein antigens.
Visualisation of mutations on modelled proteins IpaB, IpaC and IpaD. The protein residue ranges modelled are shown in brackets. Blue region represents empirically determined epitopes. Mutations identified within the proteins are coloured using the scale shown in the inlaid key, where highly destabilising mutations are dark orange and highly stabilising mutations are dark green.
While it remains possible that mutations could affect antigenicity through the disruption of folding or global stability, it is less likely than if they occurred in immunogenic regions. Our results thus indicate that it is less likely that existing natural variation will compromise antigen-based vaccine candidates for Shigella compared with serotype-based vaccines. However, any in silico approaches have limitations and functional immunological experiments will be required to determine the true impact of these variations on the antigen structure and its antigenicity. Furthermore, the knowledge base regarding the antigens structure is currently incomplete. For example, there was no suitable template available for IpaC, and some epitopes were predicted to be in membrane regions which should be inaccessible to antibodies, indicating the need for more accurate publicly available protein structures to be developed for many of the vaccine antigen candidates. Finally, 90% of the antigenic variants were captured by GEMS, further supporting the representativeness of this dataset across time and space. Nevertheless, the presence of an additional destabilising mutation in the more recent publicly available data highlight the need for ongoing surveillance across LMICs.
Region-specific details of antimicrobial resistance
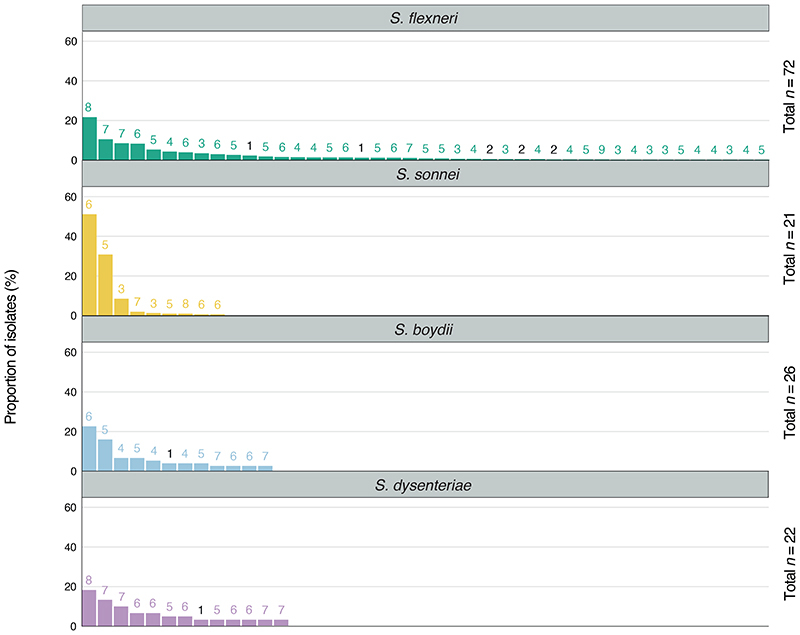
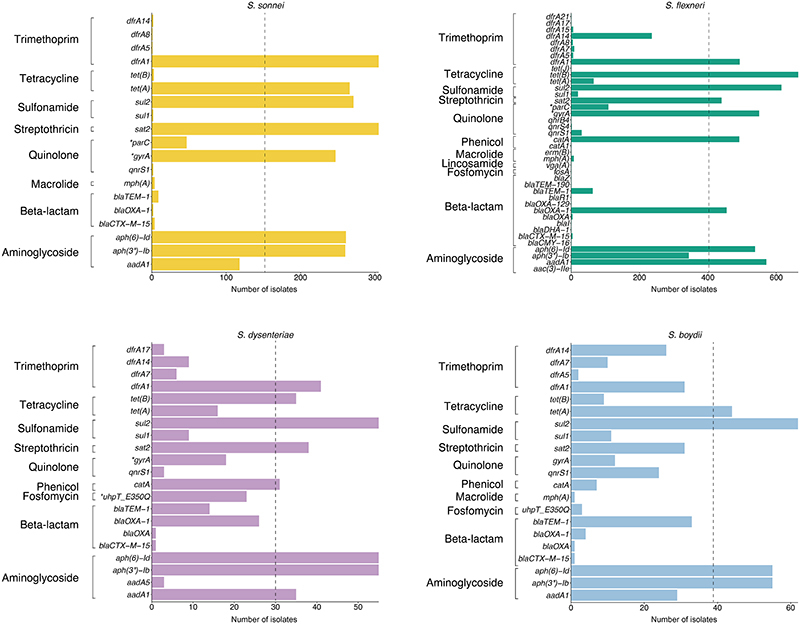
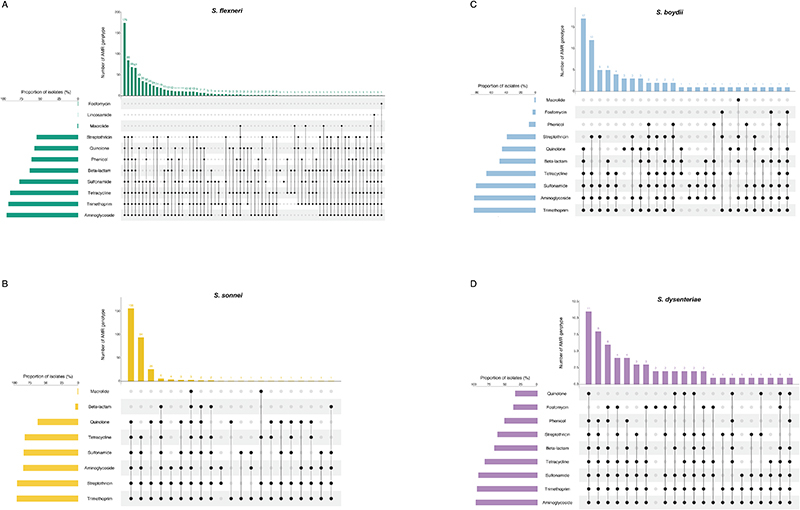
Until a licensed vaccine is available, we must continue to treat shigellosis with supportive care and antimicrobials, for which the current WHO recommendation is the fluoroquinolone, ciprofloxacin 43 . However, FQR Shigella is currently on the rise and spreading globally 44 . To examine AMR prevalence among GEMS isolates for evaluating treatment recommendations, we screened for known genetic determinants (horizontally acquired genes and point mutations) conferring resistance or reduced susceptibility to antimicrobials. Although we used only minimal phenotypic data, phenotypic resistance and genotypic prediction correlate well in S. flexneri and S. sonnei 45,46 . Our analysis revealed that 95% (1189/1246) of isolates were multidrug resistant (MDR), carrying AMR determinants against three or more antimicrobial classes (Fig 5). S. flexneri exhibited the greatest diversity of AMR determinants, with a total of 45 identified determinants across the population, comprising of 38 AMR genes and 7 point mutations (Extended data 8 and table S2), and an extensive AMR genotype diversity of 72 unique resistance profiles (Fig. 5 and Extended data 9). In contrast, S. sonnei exhibited the least diversity, with only 23 AMR determinants and 21 unique resistance profiles. An intermediate and comparable degree of AMR diversity was observed for both S. dysenteriae and S. boydii.
Fig. 5. AMR genotypic profile diversity among Shigella spp.
Each barplot represents the frequencies of AMR genotypic profiles among individual Shigella species. The number of bars shown along the x-axis represents the number of unique genotypic AMR profiles detected in each species and plotted against the proportion of isolates belonging to each profile (y-axis). The numbers displayed above each profile indicate the number of antimicrobial classes impacted by the genotype. Profiles that impact only one or two antimicrobial classes (i.e. are not MDR) are highlighted in black. AMR profiles identified in only a single isolate were not plotted and are displayed in Extended data 9. The total number of profiles detected within each species are displayed on the right-hand side of each plot.
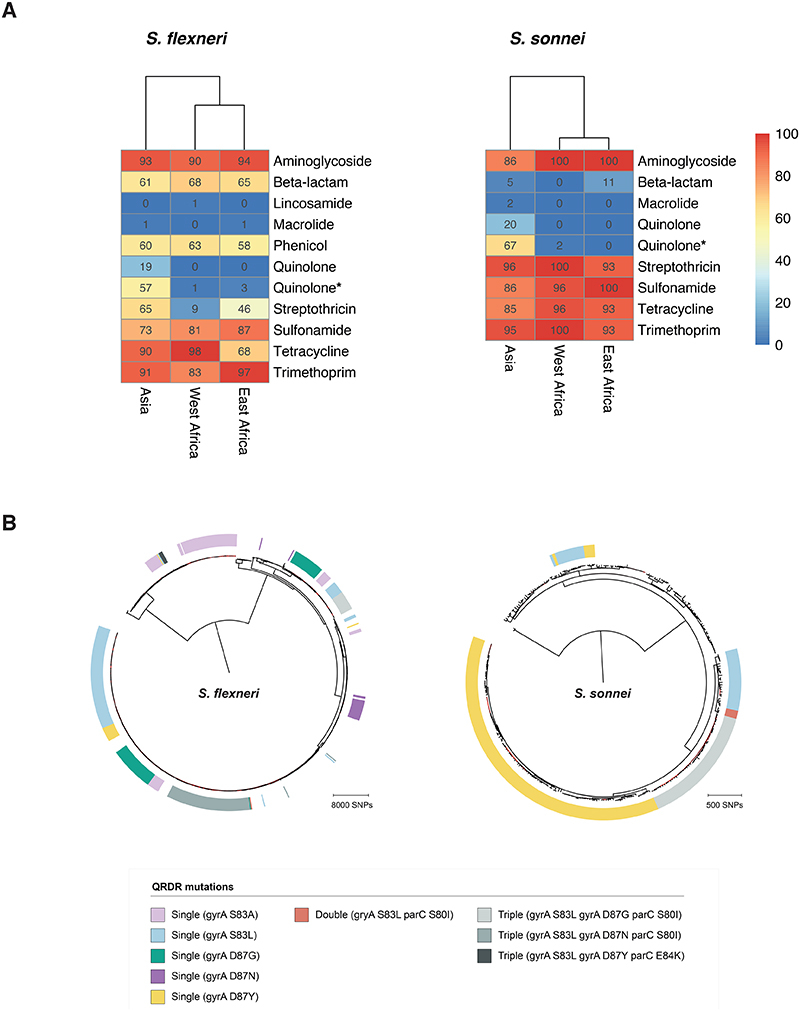
Overall, a high frequency of AMR genes conferring resistance against aminoglycoside, tetracycline, trimethoprim, and sulphonamide antimicrobials was observed, while resistance against other antimicrobial classes varied with region and species (Fig. 6A and fig. S10A). The extended spectrum beta-lactamase gene blaCTX-M-15 was detected in a small (9/1246) percentage of isolates, and genes conferring resistance to macrolides and lincosamides were also infrequent (Extended data 8), indicating that the recommended second-line treatments likely remain effective antimicrobials 47 .
Fig. 6. AMR genotype grouped by region and convergent evolution of ciprofloxacin resistance.
(A) Detection of known AMR genetic determinants associated with drug class grouped by region. Each cell in the heatmap represents the percentage of isolates from a region containing genetic determinants associated with resistance to a drug class. Genetic determinant conferring reduced susceptibility to quinolone is indicated with an asterisk. (B) The genetic convergent evolution of ciprofloxacin resistance in S. flexneri and S. sonnei. The presence of multiple monophyletic clades of QRDR mutations (single, double, or triple according to the inlaid key) conferring reduced susceptibility or resistance to ciprofloxacin is shown in the outer ring. Figures for S. boydii and S. dysenteriae are shown elsewhere (fig. S10).
However, higher rates of resistance were found against the first-line treatment. FQR in Shigella can be conferred through the acquisition of FQR-genes or, more typically, by point mutations in the chromosomal Quinolone Resistance Determining Region (QRDR) within the DNA gyrase (gryA) and the topoisomerase IV (parC) genes. Single and double QRDR mutations are known to confer reduced susceptibility to ciprofloxacin and are evolutionary intermediates on the path to resistance, conferred by triple mutations in this region 45,48 . Overall, FQR-genes were uncommon in S. flexneri (4%, 33/806), S. sonnei (1%, 3/305) and S. dysenteriae (7%, 4/60), but were present in 32% (24/75) of S. boydii. QRDR mutations were identified in all species (Extended data 8), but were more common among S. sonnei (65%, 199/305) and S. flexneri (54%, 435/806) than compared with S. boydii (15%, 11/75) and S. dysenteriae (30%, 18/60). Among these, triple QRDR mutations were identified in 13% (106/806) of S. flexneri and 14% (44/305) of S. sonnei. Analysis of the QRDR mutants across the phylogenies indicate marked convergent evolution toward resistance across the genus. Specifically, all triple QRDR mutant S. sonnei belonged to one monophyletic subtype (previously described as globally emerging from Southeast Asia 49 ), while three distinct triple QRDR mutational profiles were found across three polyphyletic S. flexneri genotypes (Fig. 6B). Thus, the polyphyletic distribution of single, double, and triple QRDR mutants indicates continued convergent evolution of lineages with reduced susceptibility or resistant to FQR.
We then stratified the dataset by geographic region which revealed that FQR were largely associated with isolates from Asia where fluoroquinolones are more frequently used compared to African sites (Fig. 6A and fig. S10A) 50 , which is consistent with trends observed in atypical enteropathogenic Escherichia coli isolated from GEMS 50 . Furthermore, analysis of African Shigella isolates from VIDA collected between 2015 and 2018 revealed that all species across West Africa and East Africa remained susceptible to ciprofloxacin 28 . Our analyses thus suggest that for the period of GEMS trial (2007 – 2011), 17% (150/881) of Shigella isolates from Asia were resistant and 58% (508/881) had reduced susceptibility to the WHO recommended antimicrobial. The high level of reduced susceptibility together with marked convergent evolution toward resistance suggests that management of shigellosis with fluroquinolones at these sites may soon be ineffective and regional antimicrobial treatment guidelines may require updating. These results indicate the value of AMR and genomic surveillance in LMICs for the control and management of shigellosis, and will be improved by initiatives such as the Africa Pathogen Genomics Initiative 51 and the WHO Global Antimicrobial Resistance Surveillance System 52 .
Conclusions
Pathogen genomics is a powerful tool that has a wide range of applications to help combat infectious diseases. Here, we have applied this tool to an unparalleled systematically collected Shigella dataset to characterise the relevant population diversity of this pathogen across LMICs in a pre-vaccine era. This study has highlighted the urgent need to continue the development of Shigella vaccines for children in endemic areas. The genomic diversity in Shigella presents a major hurdle in controlling the disease and we have demonstrated the anticipated pitfalls of current vaccination approaches, emphasising the importance of considering the local and global diversity of the pathogens in vaccine design and implementation. The relatively low heterogeneity among protein vaccine antigens in the S. flexneri population, and the lack of mutations predicted to be destabilising, supports the use of conserved antigens, and/or their inclusion alongside serotype-specific approaches for improved vaccine design. Our results also revealed that current antimicrobial treatment guidelines for shigellosis should be updated, particularly in Asia, and that improved and ongoing surveillance is essential to guide antimicrobial stewardship. Taken together, this study demonstrates the benefit of genomics in guiding prevention and control of shigellosis, providing further impetus to continue working to overcoming the challenges associated with the implementation of WGS for pathogen surveillance in LMICs. Finally, our results suggest that annual Shigella surveillance would likely identify serotype switching, which would be especially important following the introduction of a vaccination programme. Although our results are focused on shigellosis, our approach is translatable to other bacterial pathogens which is particularly relevant as we enter the era of vaccines for AMR.
Methods
Dataset, bacterial isolates and sequencing
A total of 1,264 Shigella isolates from both cases and controls collected during GEMS were under investigation in this study 2,3 . According to the GEMS study design, case enrolment required each child with diarrhoea seeking care at a selected sentinel hospital or health centres, by which diarrhoea was defined as three or more loose stools within the previous 24h, and the patient to fulfilled at least one the criteria for moderate-to-severe diarrhoea (MSD) 2 . Controls were enrolled with children without diarrhoea, matched to every individual patient with MSD by age, sex and residential area. All isolates were derived from stool samples/rectal swabs: their identification, confirmation and isolation have been described previously 21 . A total of 1,344 isolates were sequenced at the Earlham institute, with genomic DNA extraction, sequencing library construction and whole genome sequencing carried out according to the Low Input Transposase Enabled (LITE) pipeline described by Perez-Sepulveda et al 53 . Among these, 225 isolates failed QC with a mean sample depth of coverage <10x and an assembly size of <4MB and were re-sequenced. For these isolates, genomic DNA was re-extracted at the University of Maryland School of Medicine (Baltimore, Maryland) from cultures grown in Lysogeny Broth overnight. DNA was extracted in 96-well format from 100 μL of sample using the MagAttract PowerMicrobiome DNA/RNA Kit (Qiagen, Hilden, Germany) automated on a Hamilton Microlab STAR robotic platform. Bead disruption was conducted on a TissueLyser II (20 Hz for 20 min) instrument in a 96 deep well plate in the presence of 200 μL phenol/chloroform. Genomic DNA was eluted in 90 μl water after magnetic bead clean up and the resulting genomic DNA was quantified by Pico Green. The genomic DNA was shipped to the Centre for Genomic Research (University of Liverpool) for whole genome sequencing. Sequencing library was constructed using NEBNext® Ultra™ II FS DNA Library Prep Kit for Illumina and sequenced on the Illumina® NovaSeq 6000 platform, generating 150bp paired-end reads.
An additional 125 publicly available Shigella and E. coli reference genomes were included in the phylogenetic analyses and further 236 S. flexneri genomes were included in the assessment of vaccine protein antigens. Details of GEMS and reference genomes analysed in this study are listed in table S2 and table S3, respectively.
Sequence mapping and variant calling
Adaptors and low-quality bases were trimmed with Trimmomatic v0.38 54 , reads qualities were assessed using FastQC v0.11.6 (https://www.bioinformatics.babraham.ac.uk/projects/fastqc/) and MultiQC v1.7 55 . Filtered reads were mapped against Shigella reference genomes with BWA mem v0.7.17 56 using default parameters. S. flexneri, S. sonnei, S. boydii and S. dysenteriae sequencing reads were mapped against reference genomes from Sf2a strain 301 (accession NC_004337), Ss046 (accession NC_007384), Sb strain CDC 3083-94 (accession NC_010658) and Sd197 (accession NC_007606), respectively. Mappings were filtered and sorted using the SAMtools suite v1.9-47 57 , and optical duplicate reads were marked using Picard v2.21.1-SNAPSHOT MarkDuplicates (http://broadinstitute.github.io/picard/). QualiMap v2.2.2 58 was used to evaluate mapping qualities and estimate mean sample depth of coverage. Sequencing reads for isolates sequenced using the LITE pipeline and resequenced at CGR were combined to increase overall sample depth of coverage. Sequence variants were identified against reference using SAMtools v1.9-47 mpileup and bcftools v1.9-80 57 . Low quality SNPs were filtered if mapping quality <60, Phred-scaled quality score <30 and read depth <4.
Phylogenetic reconstruction, inference of genomic diversity, and genotyping
Filtered SNP variants were used to generate a reference-based pseudogenome for each sample, where regions with depth of coverage >4x were masked in the pseudogenome. Additionally, regions containing phage (identified using PHASTER 59 web server) and insertion sequences were identified from the reference genomes, and co-ordinates were used to mask these sites on the pseudogenomes using BEDTools v2.28.0 maskfasta 60 . For each species, chromosome sequences from the masked pseudogenomes were extracted and concatenated. Gubbins v2.3.4 61 was used to remove regions of recombination and invariant sites from the concatenated pseudogenomes (fig. S4). This generated a chromosomal SNP alignment length of 78,251 bp for S. flexneri (n=806), 5,081 bp for S. sonnei (n=305), 98,842 bp for S. boydii (n=75) and 45,031 bp for S. dysenteriae (n=60). Maximum-likelihood phylogenetic reconstruction was performed independently for each species and inferred with IQ-TREE v2.0-rc2 62 using the FreeRate nucleotide substitution, invariable site and ascertainment bias correction model, with 1000 bootstrap replicates. In order to contextualise GEMS isolates within the established genomic subtypes and to infer the most appropriate root for each species tree, phylogenetic trees were reconstructed including publicly available reference genomes of isolates from previously defined lineages/phylogroups/clades and E. coli isolates (table S3). Phylogenetic tree for S. flexneri, S. boydii and S. dysenteriae was rooted using E. coli strain IAI1-117 (accession SRR2169557) as an outgroup, respectively. Phylogenetic tree for S. sonnei was midpoint rooted. Visualizations were performed using interactive Tree of Life (iTOL) v6.1.1 63 . Assignment of S. sonnei genomes to hierarchical genotypes was performed using the script sonnei_genotype.py (https://github.com/katholt/sonneityping) based on mapping files, and according to the genotyping scheme described in Hawkey et al 26 .
To measure the extent of Shigella genomic diversity among GEMS population, pairwise SNP distance was determined from the alignment of core genome SNPs identified outside regions of recombination using snp-dists v0.7.0 (https://github.com/tseemann/snp-dists). For each species, the genomic diversity, measured by SNPs per kbp, was determined by dividing the core genome SNP alignment length by the core genome size (S. flexneri 4,015,307 bp, S. sonnei 4,177,070 bp, S. boydii 4,088,693 bp and S. dysenteriae 3,821,602 bp). Scaling the proportion of disease burden attributable by the genome diversity of each species, the percentage of species contribution to GEMS shigellosis disease burden was divided by the number of SNPs per kbp.
Serotype switching time frame inference
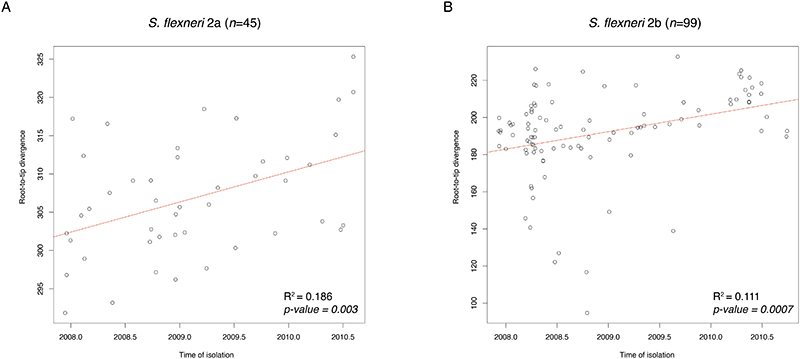
To estimate the likely time frame of serotype switching, we performed temporal phylogenetic reconstruction in order to infer the time of divergence along branches exhibiting serotype switching. We streamlined the analysis and focused on isolates belonging to two subclades of S. flexneri PG3. First, for each of the two subclades (n=99 and n=45), a maximum-likelihood phylogeny was reconstructed based on genome multiple sequence alignments (described above). Then, TempEst v1.5.3 64 was used determine if there is sufficient temporal signal in the data by inferring linear relationship between root-to-tip distances of the phylogenetic branches with the year of sample isolation. Data from both subclades revealed positive correlation between sampling time and phylogenetic root-to-tip divergence, with R2 of 0.186 and 0.111 (Extended data 10). Once temporal signals within each of the two datasets were confirmed, core genome SNP alignments of length 559 bp and 1,244 bp were analysed independently using BEAST2 v2.6.1 65 . The parameters were as follows: dates specified as days, bModelTest 66 implemented in BEAST2 was used to infer the most appropriate substitution model, a relaxed log normal clock rate with a coalescent Bayesian skyline model for population growth. Beauti v2.6.3 65 was used to general xml configuration files. A total of five independent chains were performed, each with chain length of 250,000,000, logging every 1,000 and accounting for invariant sites. Convergence of each run was visually assessed with Tracer v1.7.1 67 , with all parameter effective sampling sizes ≥200. Tree files were sampled and combined using LogCombiner v2.6.1, the combined files were then summarised using TreeAnnotator v2.6.0 with 10% burn-in to generate Maximum Clade Credibility tree 68 . Divergence time was inferred by reading the branch length from the most recent common ancestor to the first sampled isolate that serotype-switched.
Genome assembly and annotation
Draft genome sequences were assembled using Unicycler v0.4.7 69 with –min_fasta_length set to 200. QUAST v5.0.2 70 was used to assess the qualities of the assemblies. Assemblies with total assembly length outside the range of <4Mbp and >6.4Mbp were removed. Resulting in an average length of 4,275,508 bp (range: 4 4,004,109 – 4,538,734 bp) for S. flexneri, 4,264,097 bp (range: 4,008,630 – 4,779,279 bp) for S. sonnei, 4,227,671 bp (range: 4,000,714 – 4,689,815 bp) for S. boydii and 4,297,921 bp (range: 4,040,642 – 4,659,860 bp) for S. dysenteriae. An average N50 value of 29,804 bp (range: 6,810 – 34,658 bp) was generated for S. flexneri, 23,961 bp (range: 11,547 – 30,008 bp) for S. sonnei, 20,835 bp (range: 15,323 – 40,119 bp) for S. boydii and 22,137 bp (range: 14,090 – 31,358 bp) for S. dysenteriae. Draft genomes were annotated using Prokka v1.13.3 71 .
Pangenome analysis
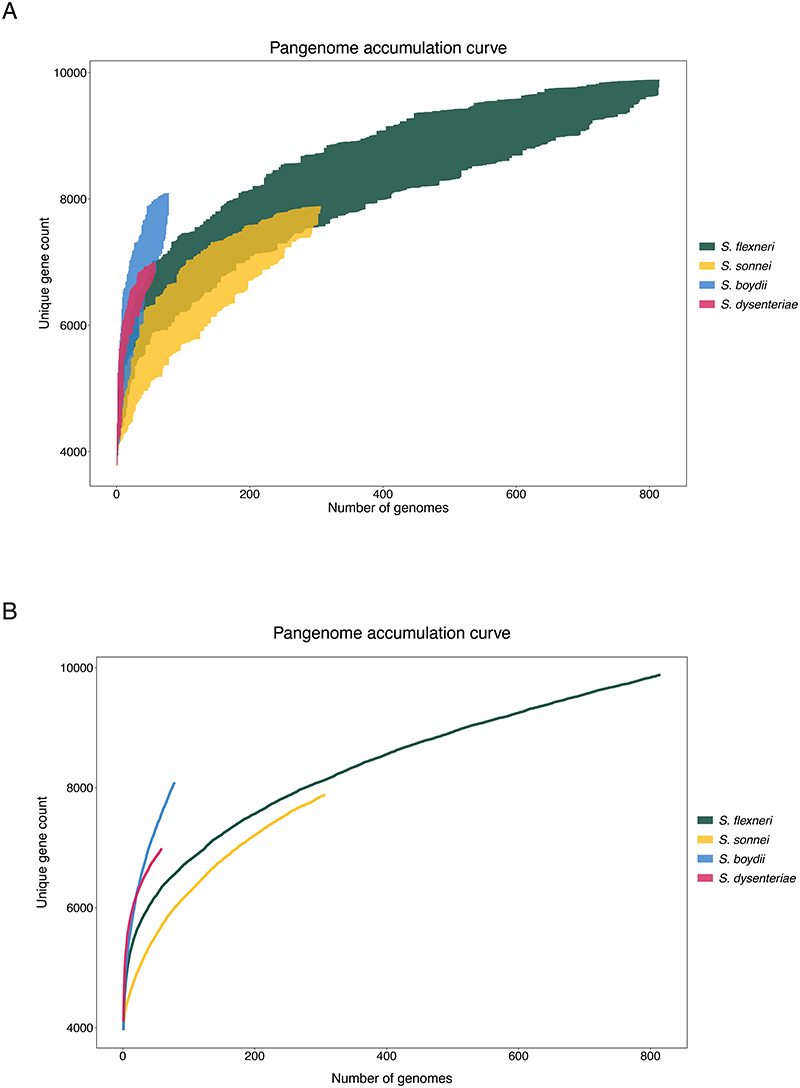
The pangenome of each species was defined using Roary v3.12.0 72 without splitting paralogues. The pangenome accumulation curves were generated separately for each species using the specaccum function from Vegan v2.5-7 (https://github.com/vegandevs/vegan/), with 100 permutations and random subsampling. Inspections of the variable gene content showed that all four species had open pangenomes, implying that the number of unique gene count increases with the addition of newly sequenced genomes.
Shigella flexneri molecular serotyping
Shigella serotype data was provided by collaborators at the University of Maryland School of Medicine (Baltimore, Maryland), serotyping was performed as previously describe 21 . In silico serotyping of S. flexneri genomes was performed using ShigaTyper v1.0.6 73 which detects the presence of serotype-determining genetic elements from sequencing reads to predict serotype. ShigaTyper predictions were 84% concordant to the serotype data provided. SRST2 v2 74 was used to detect mutations within serotype-determining genetic elements, run against ShigaTyper sequence database with default parameters.
Protein antigen screening
To determine the presence of antigen vaccine candidates among GEMS Shigella isolates, genes of the antigen vaccine candidates was screened against draft genome assemblies using screen_assembly 19 with a threshold of ≥80% identity and ≥70% coverage to the reference sequence. Reference sequences for ipaB, ipaC, ipaD and icsP were derived from S. flexneri 5a strain M90T (accession GCA_004799585) and ompA and sigA was derived from S. flexneri 2a strain 2457T (accession NC_004741), both strains are commonly used in the laboratory for vaccine development. Antigen sequence variations were determined by examining the BLASTp 75 percentage identity against relevant query reference sequence. Allelic variations of antigen vaccine candidates among S. flexneri population were identified manually by visualising amino acid sequence alignments using AliView v1.26 76 . Publicly available S. flexneri genomes were also integrated into the analysis, by which assembled genomes were downloaded from EnteroBase (Access date: 25th Aug 2021) including all isolates sampled between 2007 and 2021 from across LMICs (Asia n = 155 and Africa n = 81). No samples from Latin America met these criteria.
Protein antigen modelling
In order to assess the effect of point mutations on protein stability and vaccine escape, six antigen candidates from S. flexneri PG3 were modelled: OmpA, SigA, IcsP, IpaB, IpaC and IpaD (table S1). PG3 was selected as it is the most prevalent phylogroup and is therefore the target of current vaccine development. To model the antigen targets, we first searched for a suitable template using HHPred 77,78 . Five of the six proteins (OmpA, SigA, IcsP, IpaB and IpaD) had suitable homologues available. To improve the performance of the comparative modelling, the signal peptides for OmpA, SigA and IcsP were removed and OmpA, SigA and IpaB were modelled in two parts to make use of optimal templates. RosettaCM source relase-188 79 was used to generate 200 models for each of the five proteins using the single best available template. For IpaC, where no suitable templates were available, trRosetta 80 was used to create five de novo predicted models. The best model for each antigen candidate was selected using QMEAN’s v4.2.0 average local score. QMEANbrane v4.2.0 81,82 was used for suitable membrane proteins (IpaB, IpaC & IpaD), otherwise QMEANDisCo v4.2.0 81 was used (table S7). Full details of the modelling and ranking are shown in table S8. The effect of point mutations on the stability of the antigen candidates was assessed using PremPS 83 , and the default criterion of (ΔΔG > 1 kcal mol-1) used to defining highly destabilising mutations.
Detection of AMR genetic determinants and AMR testing
To detect the presence of known genetic determinants for AMR, AMRFinderPlus v3.9.3 84 was used to screen draft genome assemblies against the AMRFinderPlus database, which is derived from the Pathogen Detection Reference Gene Catalog (https://www.ncbi.nlm.nih.gov/pathogens/). AMRFinderPlus was performed with the organism-specific option for Escherichia, to screen for both point mutations and genes, and filter out uninformative genes that were nearly universal in a group. Output was then filtered to remove genetic determinants identified with ≤80% coverage and ≤90% identity. The presence of S. sonnei virulence plasmid was confirmed using short-read mapping using BWA mem (as described above) against the reference virulence plasmid from Ss046 (GenBank accession CP000039.1). Presence of the plasmid was defined by mapping of >60% breadth of coverage across the reference. Visualisations of AMR resistance profiles were performed with UpSetR v2.1.3 85 . Four S. flexneri isolates with triple QRDR mutations were phenotypically tested for ciprofloxacin resistance using the Kirby-Bauer standardized disk diffusion method 86 .
Statistical analyses
The strength of association between S. flexneri genomic subtype and serotype with the occurrence of case outcome was calculated using MedCalc Software Ltd’s Odds ratio calculator v20 (https://www.medcalc.org/calc/odds_ratio.php) to report the odds ratio, 95% confidence interval and statistical association. Association of genomic subtype with serotype and serotype switching was tested using Fisher’s exact test. Linear regression analysis was used to determine the correlation between serotype diversity to various properties of genomic subtype. Both analyses were performed using R v4.0.3.
Extended Data
Extended Data Fig. 1. Pangenome accumulation curve of S. flexneri, S. sonnei, S. boydii and S. dysenteriae .
Each curve demonstrates the number of unique protein coding genes in the pangenome as a new genome is randomly added. Random permutation of the data were subsampled 100 times, in which genomes are subsampled without replacement at each iteration. The x-axis display the number of genomes and the y-axis shows the minimum and maximum range of unique gene count after each iteration in (A) and the mean value in (B).
Extended Data Fig. 2. Detection of recombination among Shigella genomes.
ML phylogenetic tree of each species are displayed on the left. Coloured columns represents regions of putative recombination with elevated SNP density detected across the genome. Columns highlighted in red represents recombination detected in multiple isolates and blue represents recombination detected in a single isolate.
Extended Data Fig. 3. Regional genomic diversity of GEMS Shigella .
Comparison of regional genomic diversity of Shigella spp, as measured by pairwise core SNP distance (x-axis) across GEMS study sites (Asia: Bangladesh, India and Pakistan; East Africa: Kenya and Mozambique; West Africa: The Gambia and Mali) for S. flexneri, S. sonnei, S. boydii and S. dysenteriae.
Extended Data Fig. 4. Regional serotypes/subserotypes diversity of GEMS Shigella .
Regional serotypes/subserotypes diversity of Shigella spp across GEMS study sites for S. flexneri, S. boydii and S. dysenteriae. Each barplot represents the relative frequencies of serotypes/subserotypes at each region according to the inlaid key.
Extended Data Fig. 5. Association of S. flexneri serotype diversity with different properties of a genomic subtype.
Each of the six subtypes identified among S. flexneri (PG1-PG7 and Sf6), the number of different serotypes is displayed along the y-axis and plotted against (A) the number of isolates within the subtype and (B) the genetic diversity of the subtype, as measured by pairwise core SNP distance and plotted along the x-axis. Linear regression analysis was performed to assess the association between serotype diversity and the different properties of subtypes. The regression coefficient of determination (R2) and p-value are displayed on the top left of each plot.
Extended Data Fig. 6. Serotype switching events across S. flexneri genomic subtypes.
ML phylogenetic tree of each subtype was generated based on core genome SNPs. Serotypes determined through biochemical serotyping are displayed on the right-hand side of each tree, and coloured according to the inlaid key. The 26 inferred serotype switching events occurring along the phylogenetic branches are labelled accordingly. Numbers inside each backets represents switch IDs, with further details provided in table S4. Where the dominant serotype cannot be determined, a question mark is displayed, indicating switch from unknown ancestral type. Serotype switching events resulting in more than two descendant isolates are highlighted in red.
Extended Data Fig. 7. Vaccine antigen variation among S. flexneri subtypes.
ML phylogenetic tree of 806 S. flexneri GEMS and 236 publicly available genomes, based on core genome SNPs is displayed on the left. The six subtypes identified among the population are highlighted in different colours according to the inlaid key. The alternating grey and purple colour blocks displayed above the top panel represents the six antigen vaccine candidates assessed in the current study. The matrix in the center demonstrates presence (in black) of aa variation for each antigen vaccine. Only variable sites are displayed. The full list of variable sites represented are available in table S8.
Extended Data Fig. 8. Prevalence of genetic determinants conferring AMR among Shigella spp.
Barplots shows the number of genetic determinants detected in S. sonnei, S. flexneri, S. dysenteriae and S. boydii isolates that confer resistance or reduced susceptibility to various antimicrobials. Genes and point mutations (indicated with an asterisk) are plotted along the y-axis and grouped by drug class (displayed on the left). The dashed lines highlight genetic determinants identified in half or more of the isolates for each species.
Extended Data Fig. 9. Diversity of AMR genotype resistance profiles.
UpSet plots illustrate the AMR genotype resistance profiles for (A) S. flexneri, (B) S. sonnei, (C) S. boydii and (D) S. dysenteriae. Genotypic AMR profiles are shown in the combination matrix in the center panel. Each column represents a unique genotypic profile, where each black dot represents presence of a genetic determinant conferring resistance or reduced susceptibility to a drug class (displayed on the left). The vertical the barplot above the matrix displays the number of isolates with a particular profile, with the exact number of isolates displayed above each bar. The horizontal barplot on the left of the matrix illustrates the proportion of isolates containing AMR genetic determinants associated with a drug class.
Extended Data Fig. 10. Temporal phylogenetic signal for S. flexneri.
Correlation between isolate sampling time in months (x-axis) and phylogenetic root-to-tip divergence (y-axis), as estimated by TempEst based on ML phylogeny of each subclade. The two datasets correspond to S. flexneri serotype 2a isolates belonging to node A (A) and S. flexneri serotype 2b isolates belonging to node B (B) from PG3 in fig. S12. The linear regression line is coloured in red, with the coefficient of determination (R2) and p-value displayed for each plot.
Supplementary Material
Acknowledgements
We acknowledge and thank members of Baker group and Lab H at the University of Liverpool, and Rodrigo Bacigalupe at KU Leuven for invaluable discussions. We also thank Jay Hinton and Blanca Perez Sepulveda for logistical support orchestrating the thermolysate shipping. The authors are grateful to Sam Haldenby, Matthew Gemmell and Richard Gregory and the Centre for Genomics Research, University of Liverpool for technical support. The authors acknowledge Dr. Irene Kasumba, Ms. Jennifer Jones, Mr. Sunil Sen and Ms. Jasnehta-Permala-Booth for preparing GEMS Shigella isolates for sequencing and antimicrobial testing. This work was supported by a UKRI MRC NIRG award (MR/R020787/1, KSB), the National Institute of Allergy and Infectious Diseases, National Institutes of Health, Department of Health and Human Services (U19AI110820, DR), and by both a Global Challenges Research Fund (GCRF) data and resources grant (BBS/OS/GC/000009D, NH) and the BBSRC Core Capability Grant to the Earlham Institute (BB/CCG1720/1, NH). Next-generation sequencing and library construction were delivered via the BBSRC National Capability in Genomics and Single Cell (BB/CCG1720/1, NH) at Earlham Institute, by members of the Genomics Pipelines Group. KSB was supported by a Wellcome Trust Clinical Research Career Development Award (106690/A/14/Z, KSB) and an Academy of Medical Sciences Springboard award (SBF002/1114, KSBs) and is affiliated to the National Institute for Health Research Health Protection Research Unit (NIHR HPRU, KSB) in Gastrointestinal Infections at University of Liverpool in partnership with Public Health England (PHE) and collaboration with University of Warwick. The views expressed are those of the author(s) and not necessarily those of the NHS, the NIHR, the Department of Health and Social Care or Public Health England.
Footnotes
Author contributions
R.J.B performed majority of the data analysis and interpretation of the results under the scientific guidance of K.S.B. A.J.S and D.J.R performed in silico protein antigens modelling and prediction of the impacts of amino acid substitutions on protein stability. C.V.P supported Bayesian Evolutionary Analysis by Sampling Trees. S.M.T. prepared and provided GEMS Shigella isolates and metadata and provided feedback on intermediary results. DR contributed to sample preparation. N.H. and R.L. generated sequencing data and conducted quality control for sequencing performed at the Earlham Institute. R.J.B and K.S.B drafted the manuscript. All authors contributed to editing of the manuscript.
Competing interests
The authors declare no competing interests.
Data availability
Short read sequences supporting the findings of this study have been deposited in the European Nucleotide Archive (https://www.ebi.ac.uk/ena/) under the project accession number PRJEB45383. Accession numbers for isolates used in this study are listed in table S2. Publicly available sequences were downloaded from GenBank (https://www.ncbi.nlm.nih.gov/genbank/), Sequence Read Archive (https://www.ncbi.nlm.nih.gov/sra) or European Nucleotide Archive (https://www.ebi.ac.uk/ena) and EnteroBase (http://enterobase.warwick.ac.uk/). Accession numbers of publicly available genomes are listed in table S3. Phylogenetic trees, antigen protein models and BEAST input and output files have been deposited in FigShare: (DOI: 10.6084/m9.figshare.14743833).
Code availability
All codes used in this study have been described in the materials and methods, no custom algorithms were used for analyses.
References
- 1.Khalil IA, et al. Morbidity and mortality due to shigella and enterotoxigenic Escherichia coli diarrhoea: the Global Burden of Disease Study 1990-2016. Lancet Infect Dis. 2018;18:1229–1240. doi: 10.1016/S1473-3099(18)30475-4. [DOI] [PMC free article] [PubMed] [Google Scholar]
- 2.Kotloff KL, et al. Burden and aetiology of diarrhoeal disease in infants and young children in developing countries (the Global Enteric Multicenter Study, GEMS): a prospective, case-control study. Lancet. 2013;382:209–22. doi: 10.1016/S0140-6736(13)60844-2. [DOI] [PubMed] [Google Scholar]
- 3.Liu J, et al. Use of quantitative molecular diagnostic methods to identify causes of diarrhoea in children: a reanalysis of the GEMS case control study. Lancet. 2016;388:1291–301. doi: 10.1016/S0140-6736(16)31529-X. [DOI] [PMC free article] [PubMed] [Google Scholar]
- 4.Kotloff KL, Riddle MS, Platts-Mills JA, Pavlinac P, Zaidi AKM. Shigellosis. Lancet. 2018;391:801–812. doi: 10.1016/S0140-6736(17)33296-8. [DOI] [PubMed] [Google Scholar]
- 5.Shrivastava SR, Shrivastava PS, Ramasamy J. World health organization releases global priority list of antibiotic-resistant bacteria to guide research, discovery, and development of new antibiotics. Journal of Medical Society. 2018;32:76. [Google Scholar]
- 6.Barry EM, et al. Progress and pitfalls in Shigella vaccine research. Nat Rev Gastroenterol Hepatol. 2013;10:245–55. doi: 10.1038/nrgastro.2013.12. [DOI] [PMC free article] [PubMed] [Google Scholar]
- 7.Cohen D, Green MS, Block C, Slepon R, Ofek I. Prospective study of the association between serum antibodies to lipopolysaccharide O antigen and the attack rate of shigellosis. J Clin Microbiol. 1991;29:386–9. doi: 10.1128/jcm.29.2.386-389.1991. [DOI] [PMC free article] [PubMed] [Google Scholar]
- 8.Ferreccio C, et al. Epidemiologic patterns of acute diarrhea and endemic Shigella infections in children in a poor periurban setting in Santiago, Chile. Am J Epidemiol. 1991;134:614–27. doi: 10.1093/oxfordjournals.aje.a116134. [DOI] [PubMed] [Google Scholar]
- 9.Formal SB, et al. Effect of prior infection with virulent Shigella flexneri 2a on the resistance of monkeys to subsequent infection with Shigella sonnei. J Infect Dis. 1991;164:533–7. doi: 10.1093/infdis/164.3.533. [DOI] [PubMed] [Google Scholar]
- 10.Kotloff KL, et al. A modified Shigella volunteer challenge model in which the inoculum is administered with bicarbonate buffer: clinical experience and implications for Shigella infectivity. Vaccine. 1995;13:1488–94. doi: 10.1016/0264-410x(95)00102-7. [DOI] [PubMed] [Google Scholar]
- 11.Levine MM, Kotloff KL, Barry EM, Pasetti MF, Sztein MB. Clinical trials of Shigella vaccines: two steps forward and one step back on a long, hard road. Nat Rev Microbiol. 2007;5:540–53. doi: 10.1038/nrmicro1662. [DOI] [PMC free article] [PubMed] [Google Scholar]
- 12.Mani S, Wierzba T, Walker RI. Status of vaccine research and development for Shigella. Vaccine. 2016;34:2887–2894. doi: 10.1016/j.vaccine.2016.02.075. [DOI] [PubMed] [Google Scholar]
- 13.Talaat KR, et al. Human challenge study with a Shigella bioconjugate vaccine: Analyses of clinical efficacy and correlate of protection. EBioMedicine. 2021;66:103310. doi: 10.1016/j.ebiom.2021.103310. [DOI] [PMC free article] [PubMed] [Google Scholar]
- 14.Passwell JH, et al. Age-related efficacy of Shigella O-specific polysaccharide conjugates in 1-4-year-old Israeli children. Vaccine. 2010;28:2231–2235. doi: 10.1016/j.vaccine.2009.12.050. [DOI] [PMC free article] [PubMed] [Google Scholar]
- 15.Turbyfill KR, Kaminski RW, Oaks EV. Immunogenicity and efficacy of highly purified invasin complex vaccine from Shigella flexneri 2a. Vaccine. 2008;26:1353–64. doi: 10.1016/j.vaccine.2007.12.040. [DOI] [PubMed] [Google Scholar]
- 16.Martinez-Becerra FJ, et al. Broadly protective Shigella vaccine based on type III secretion apparatus proteins. Infect Immun. 2012;80:1222–31. doi: 10.1128/IAI.06174-11. [DOI] [PMC free article] [PubMed] [Google Scholar]
- 17.Berlanda Scorza F, et al. High yield production process for Shigella outer membrane particles. PLoS One. 2012;7:e35616. doi: 10.1371/journal.pone.0035616. [DOI] [PMC free article] [PubMed] [Google Scholar]
- 18.Frenck RW, Jr, et al. Efficacy, safety, and immunogenicity of the Shigella sonnei 1790GAHB GMMA candidate vaccine: Results from a phase 2b randomized, placebo-controlled challenge study in adults. EClinicalMedicine. 2021;39:101076. doi: 10.1016/j.eclinm.2021.101076. [DOI] [PMC free article] [PubMed] [Google Scholar]
- 19.Davies MR, et al. Atlas of group A streptococcal vaccine candidates compiled using large-scale comparative genomics. Nat Genet. 2019;51:1035–1043. doi: 10.1038/s41588-019-0417-8. [DOI] [PMC free article] [PubMed] [Google Scholar]
- 20.Telford JL. Bacterial genome variability and its impact on vaccine design. Cell Host Microbe. 2008;3:408–16. doi: 10.1016/j.chom.2008.05.004. [DOI] [PubMed] [Google Scholar]
- 21.Livio S, et al. Shigella isolates from the global enteric multicenter study inform vaccine development. Clin Infect Dis. 2014;59:933–41. doi: 10.1093/cid/ciu468. [DOI] [PMC free article] [PubMed] [Google Scholar]
- 22.Connor TR, et al. Species-wide whole genome sequencing reveals historical global spread and recent local persistence in Shigella flexneri. Elife. 2015;4:e07335. doi: 10.7554/eLife.07335. [DOI] [PMC free article] [PubMed] [Google Scholar]
- 23.Holt KE, et al. Shigella sonnei genome sequencing and phylogenetic analysis indicate recent global dissemination from Europe. Nat Genet. 2012;44:1056–9. doi: 10.1038/ng.2369. [DOI] [PMC free article] [PubMed] [Google Scholar]
- 24.Njamkepo E, et al. Global phylogeography and evolutionary history of Shigella dysenteriae type 1. Nat Microbiol. 2016;1:16027. doi: 10.1038/nmicrobiol.2016.27. [DOI] [PubMed] [Google Scholar]
- 25.Kania DA, Hazen TH, Hossain A, Nataro JP, Rasko DA. Genome diversity of Shigella boydii. Pathog Dis. 2016;74:ftw027. doi: 10.1093/femspd/ftw027. [DOI] [PMC free article] [PubMed] [Google Scholar]
- 26.Hawkey J, et al. Global population structure and genotyping framework for genomic surveillance of the major dysentery pathogen, Shigella sonnei. Nature Communications. 2021;12:2684. doi: 10.1038/s41467-021-22700-4. [DOI] [PMC free article] [PubMed] [Google Scholar]
- 27.Sahl JW, et al. Defining the phylogenomics of Shigella species: a pathway to diagnostics. J Clin Microbiol. 2015;53:951–60. doi: 10.1128/JCM.03527-14. [DOI] [PMC free article] [PubMed] [Google Scholar]
- 28.Badji H, et al. Prevalence, antimicrobial resistance, and distribution of Shigella among children under five in three sub-Saharan African countries in the Vaccine Impact on Diarrhea in Africa Study. American Society of Tropical Medicine and Hygiene [Google Scholar]
- 29.von Seidlein L, et al. A multicentre study of Shigella diarrhoea in six Asian countries: disease burden, clinical manifestations, and microbiology. PLoS Med. 2006;3:e353. doi: 10.1371/journal.pmed.0030353. [DOI] [PMC free article] [PubMed] [Google Scholar]
- 30.Ye C, et al. Emergence of a new multidrug-resistant serotype X variant in an epidemic clone of Shigella flexneri. J Clin Microbiol. 2010;48:419–26. doi: 10.1128/JCM.00614-09. [DOI] [PMC free article] [PubMed] [Google Scholar]
- 31.Allison GE, Verma NK. Serotype-converting bacteriophages and O-antigen modification in Shigella flexneri. Trends Microbiol. 2000;8:17–23. doi: 10.1016/s0966-842x(99)01646-7. [DOI] [PubMed] [Google Scholar]
- 32.Sun Q, et al. A novel plasmid-encoded serotype conversion mechanism through addition of phosphoethanolamine to the O-antigen of Shigella flexneri. PLoS One. 2012;7:e46095. doi: 10.1371/journal.pone.0046095. [DOI] [PMC free article] [PubMed] [Google Scholar]
- 33.Weinberger DM, Malley R, Lipsitch M. Serotype replacement in disease after pneumococcal vaccination. Lancet. 2011;378:1962–73. doi: 10.1016/S0140-6736(10)62225-8. [DOI] [PMC free article] [PubMed] [Google Scholar]
- 34.Brueggemann AB, Pai R, Crook DW, Beall B. Vaccine escape recombinants emerge after pneumococcal vaccination in the United States. PLoS Pathog. 2007;3:e168. doi: 10.1371/journal.ppat.0030168. [DOI] [PMC free article] [PubMed] [Google Scholar]
- 35.Riddle MS, et al. Safety and immunogenicity of an intranasal Shigella flexneri 2a Invaplex 50 vaccine. Vaccine. 2011;29:7009–19. doi: 10.1016/j.vaccine.2011.07.033. [DOI] [PubMed] [Google Scholar]
- 36.McVicker G, Tang CM. Deletion of toxin-antitoxin systems in the evolution of Shigella sonnei as a host-adapted pathogen. Nat Microbiol. 2016;2:16204. doi: 10.1038/nmicrobiol.2016.204. [DOI] [PubMed] [Google Scholar]
- 37.Garcia-Beltran WF, et al. Multiple SARS-CoV-2 variants escape neutralization by vaccine-induced humoral immunity. Cell. 2021 doi: 10.1016/j.cell.2021.04.006. [DOI] [PMC free article] [PubMed] [Google Scholar]
- 38.Zhou D, et al. Evidence of escape of SARS-CoV-2 variant B.1.351 from natural and vaccine-induced sera. Cell. 2021 doi: 10.1016/j.cell.2021.02.037. [DOI] [PMC free article] [PubMed] [Google Scholar]
- 39.Mills JA, Buysse JM, Oaks EV. Shigella flexneri invasion plasmid antigens B and C: epitope location and characterization with monoclonal antibodies. Infect Immun. 1988;56:2933–41. doi: 10.1128/iai.56.11.2933-2941.1988. [DOI] [PMC free article] [PubMed] [Google Scholar]
- 40.Turbyfill KR, Mertz JA, Mallett CP, Oaks EV. Identification of epitope and surface-exposed domains of Shigella flexneri invasion plasmid antigen D (IpaD) Infect Immun. 1998;66:1999–2006. doi: 10.1128/iai.66.5.1999-2006.1998. [DOI] [PMC free article] [PubMed] [Google Scholar]
- 41.Czerkinsky C, Kim DW. Shigella protein antigens and methods. US Patent 8168203; 2012. [Google Scholar]
- 42.Pore D, Mahata N, Pal A, Chakrabarti MK. Outer membrane protein A (OmpA) of Shigella flexneri 2a, induces protective immune response in a mouse model. PLoS One. 2011;6:e22663. doi: 10.1371/journal.pone.0022663. [DOI] [PMC free article] [PubMed] [Google Scholar]
- 43.Organization WH. Guidelines for the control of shigellosis, including epidemics due to Shigella dysenteriae type 1. 2005.
- 44.Chung The H, Baker S. Out of Asia: the independent rise and global spread of fluoroquinolone-resistant Shigella. Microb Genom. 2018;4 doi: 10.1099/mgen.0.000171. [DOI] [PMC free article] [PubMed] [Google Scholar]
- 45.Sadouki Z, et al. Comparison of phenotypic and WGS-derived antimicrobial resistance profiles of Shigella sonnei isolated from cases of diarrhoeal disease in England and Wales, 2015. J Antimicrob Chemother. 2017;72:2496–2502. doi: 10.1093/jac/dkx170. [DOI] [PubMed] [Google Scholar]
- 46.Baker KS, et al. Intercontinental dissemination of azithromycin-resistant shigellosis through sexual transmission: a cross-sectional study. Lancet Infect Dis. 2015;15:913–21. doi: 10.1016/S1473-3099(15)00002-X. [DOI] [PubMed] [Google Scholar]
- 47.Williams PCM, Berkley JA. Guidelines for the treatment of dysentery (shigellosis): a systematic review of the evidence. Paediatr Int Child Health. 2018;38:S50–S65. doi: 10.1080/20469047.2017.1409454. [DOI] [PMC free article] [PubMed] [Google Scholar]
- 48.Chung The H, et al. South Asia as a Reservoir for the Global Spread of Ciprofloxacin-Resistant Shigella sonnei: A Cross-Sectional Study. PLoS Med. 2016;13:e1002055. doi: 10.1371/journal.pmed.1002055. [DOI] [PMC free article] [PubMed] [Google Scholar]
- 49.Chung The H, et al. Dissecting the molecular evolution of fluoroquinolone-resistant Shigella sonnei. Nat Commun. 2019;10:4828. doi: 10.1038/s41467-019-12823-0. [DOI] [PMC free article] [PubMed] [Google Scholar]
- 50.Ingle DJ, Levine MM, Kotloff KL, Holt KE, Robins-Browne RM. Dynamics of antimicrobial resistance in intestinal Escherichia coli from children in community settings in South Asia and sub-Saharan Africa. Nat Microbiol. 2018;3:1063–1073. doi: 10.1038/s41564-018-0217-4. [DOI] [PMC free article] [PubMed] [Google Scholar]
- 51.Makoni M. Africa’s $100-million Pathogen Genomics Initiative. The Lancet Microbe. 2020;1:e318. doi: 10.1016/S2666-5247(20)30206-8. [DOI] [PubMed] [Google Scholar]
- 52.AMR N G.H.R.U.o.G.S.o. Whole-genome sequencing as part of national and international surveillance programmes for antimicrobial resistance: a roadmap. BMJ Global Health. 2020;5:e002244. doi: 10.1136/bmjgh-2019-002244. [DOI] [PMC free article] [PubMed] [Google Scholar]
- 53.Perez-Sepulveda BM, et al. An accessible, efficient and global approach for the large-scale sequencing of bacterial genomes. BioRxiv. 2020 doi: 10.1186/s13059-021-02536-3. [DOI] [PMC free article] [PubMed] [Google Scholar]
- 54.Bolger AM, Lohse M, Usadel B. Trimmomatic: a flexible trimmer for Illumina sequence data. Bioinformatics. 2014;30:2114–2120. doi: 10.1093/bioinformatics/btu170. [DOI] [PMC free article] [PubMed] [Google Scholar]
- 55.Ewels P, Magnusson M, Lundin S, Kaller M. MultiQC: summarize analysis results for multiple tools and samples in a single report. Bioinformatics. 2016;32:3047–8. doi: 10.1093/bioinformatics/btw354. [DOI] [PMC free article] [PubMed] [Google Scholar]
- 56.Li H. Aligning sequence reads, clone sequences and assembly contigs with BWA-MEM. arXiv preprint. 2013:arXiv:1303.3997 [Google Scholar]
- 57.Li H, et al. The Sequence Alignment/Map format and SAMtools. Bioinformatics. 2009;25:2078–9. doi: 10.1093/bioinformatics/btp352. [DOI] [PMC free article] [PubMed] [Google Scholar]
- 58.Garcia-Alcalde F, et al. Qualimap: evaluating next-generation sequencing alignment data. Bioinformatics. 2012;28:2678–9. doi: 10.1093/bioinformatics/bts503. [DOI] [PubMed] [Google Scholar]
- 59.Arndt D, et al. PHASTER: a better, faster version of the PHAST phage search tool. Nucleic Acids Res. 2016;44:W16–21. doi: 10.1093/nar/gkw387. [DOI] [PMC free article] [PubMed] [Google Scholar]
- 60.Quinlan AR. BEDTools: The Swiss-Army Tool for Genome Feature Analysis. Curr Protoc Bioinformatics. 2014;47:11 12 1-34. doi: 10.1002/0471250953.bi1112s47. [DOI] [PMC free article] [PubMed] [Google Scholar]
- 61.Croucher NJ, et al. Rapid phylogenetic analysis of large samples of recombinant bacterial whole genome sequences using Gubbins. Nucleic Acids Res. 2015;43:e15. doi: 10.1093/nar/gku1196. [DOI] [PMC free article] [PubMed] [Google Scholar]
- 62.Nguyen LT, Schmidt HA, von Haeseler A, Minh BQ. IQ-TREE: a fast and effective stochastic algorithm for estimating maximum-likelihood phylogenies. Mol Biol Evol. 2015;32:268–74. doi: 10.1093/molbev/msu300. [DOI] [PMC free article] [PubMed] [Google Scholar]
- 63.Letunic I, Bork P. Interactive Tree Of Life (iTOL) v4: recent updates and new developments. Nucleic Acids Res. 2019;47:W256–W259. doi: 10.1093/nar/gkz239. [DOI] [PMC free article] [PubMed] [Google Scholar]
- 64.Rambaut A, Lam TT, Max Carvalho L, Pybus OG. Exploring the temporal structure of heterochronous sequences using TempEst (formerly Path-O-Gen) Virus Evol. 2016;2:vew007. doi: 10.1093/ve/vew007. [DOI] [PMC free article] [PubMed] [Google Scholar]
- 65.Bouckaert R, et al. BEAST 2: a software platform for Bayesian evolutionary analysis. PLoS Comput Biol. 2014;10:e1003537. doi: 10.1371/journal.pcbi.1003537. [DOI] [PMC free article] [PubMed] [Google Scholar]
- 66.Bouckaert RR, Drummond AJ. bModelTest: Bayesian phylogenetic site model averaging and model comparison. BMC Evol Biol. 2017;17:42. doi: 10.1186/s12862-017-0890-6. [DOI] [PMC free article] [PubMed] [Google Scholar]
- 67.Rambaut A, Drummond AJ, Xie D, Baele G, Suchard MA. Posterior Summarization in Bayesian Phylogenetics Using Tracer 1.7. Syst Biol. 2018;67:901–904. doi: 10.1093/sysbio/syy032. [DOI] [PMC free article] [PubMed] [Google Scholar]
- 68.Bouckaert R, et al. BEAST 2.5: An advanced software platform for Bayesian evolutionary analysis. PLoS Comput Biol. 2019;15:e1006650. doi: 10.1371/journal.pcbi.1006650. [DOI] [PMC free article] [PubMed] [Google Scholar]
- 69.Wick RR, Judd LM, Gorrie CL, Holt KE. Unicycler: resolving bacterial genome assemblies from short and long sequencing reads. PLoS computational biology. 2017;13:e1005595. doi: 10.1371/journal.pcbi.1005595. [DOI] [PMC free article] [PubMed] [Google Scholar]
- 70.Gurevich A, Saveliev V, Vyahhi N, Tesler G. QUAST: quality assessment tool for genome assemblies. Bioinformatics. 2013;29:1072–5. doi: 10.1093/bioinformatics/btt086. [DOI] [PMC free article] [PubMed] [Google Scholar]
- 71.Seemann T. Prokka: rapid prokaryotic genome annotation. Bioinformatics. 2014;30:2068–9. doi: 10.1093/bioinformatics/btu153. [DOI] [PubMed] [Google Scholar]
- 72.Page AJ, et al. Roary: rapid large-scale prokaryote pan genome analysis. Bioinformatics. 2015;31:3691–3. doi: 10.1093/bioinformatics/btv421. [DOI] [PMC free article] [PubMed] [Google Scholar]
- 73.Wu Y, Lau HK, Lee T, Lau DK, Payne J. In Silico Serotyping Based on Whole-Genome Sequencing Improves the Accuracy of Shigella Identification. Appl Environ Microbiol. 2019;85 doi: 10.1128/AEM.00165-19. [DOI] [PMC free article] [PubMed] [Google Scholar]
- 74.Inouye M, et al. SRST2: Rapid genomic surveillance for public health and hospital microbiology labs. Genome Med. 2014;6:90. doi: 10.1186/s13073-014-0090-6. [DOI] [PMC free article] [PubMed] [Google Scholar]
- 75.Altschul SF, et al. Gapped BLAST and PSI-BLAST: a new generation of protein database search programs. Nucleic Acids Res. 1997;25:3389–402. doi: 10.1093/nar/25.17.3389. [DOI] [PMC free article] [PubMed] [Google Scholar]
- 76.Larsson A. AliView: a fast and lightweight alignment viewer and editor for large datasets. Bioinformatics. 2014;30:3276–8. doi: 10.1093/bioinformatics/btu531. [DOI] [PMC free article] [PubMed] [Google Scholar]
- 77.Hildebrand A, Remmert M, Biegert A, Soding J. Fast and accurate automatic structure prediction with HHpred. Proteins. 2009;77(Suppl 9):128–32. doi: 10.1002/prot.22499. [DOI] [PubMed] [Google Scholar]
- 78.Zimmermann L, et al. A Completely Reimplemented MPI Bioinformatics Toolkit with a New HHpred Server at its Core. J Mol Biol. 2018;430:2237–2243. doi: 10.1016/j.jmb.2017.12.007. [DOI] [PubMed] [Google Scholar]
- 79.Song Y, et al. High-resolution comparative modeling with RosettaCM. Structure. 2013;21:1735–42. doi: 10.1016/j.str.2013.08.005. [DOI] [PMC free article] [PubMed] [Google Scholar]
- 80.Yang J, et al. Improved protein structure prediction using predicted interresidue orientations. Proceedings of the National Academy of Sciences. 2020;117:1496–1503. doi: 10.1073/pnas.1914677117. [DOI] [PMC free article] [PubMed] [Google Scholar]
- 81.Studer G, et al. QMEANDisCo-distance constraints applied on model quality estimation. Bioinformatics. 2020;36:2647. doi: 10.1093/bioinformatics/btaa058. [DOI] [PMC free article] [PubMed] [Google Scholar]
- 82.Studer G, Biasini M, Schwede T. Assessing the local structural quality of transmembrane protein models using statistical potentials (QMEANBrane) Bioinformatics. 2014;30:i505-11. doi: 10.1093/bioinformatics/btu457. [DOI] [PMC free article] [PubMed] [Google Scholar]
- 83.Chen Y, et al. PremPS: Predicting the impact of missense mutations on protein stability. PLoS Comput Biol. 2020;16:e1008543. doi: 10.1371/journal.pcbi.1008543. [DOI] [PMC free article] [PubMed] [Google Scholar]
- 84.Feldgarden M, et al. Validating the AMRFinder Tool and Resistance Gene Database by Using Antimicrobial Resistance Genotype-Phenotype Correlations in a Collection of Isolates. Antimicrob Agents Chemother. 2019;63 doi: 10.1128/AAC.00483-19. [DOI] [PMC free article] [PubMed] [Google Scholar]
- 85.Conway JR, Lex A, Gehlenborg N. UpSetR: an R package for the visualization of intersecting sets and their properties. Bioinformatics. 2017;33:2938–2940. doi: 10.1093/bioinformatics/btx364. [DOI] [PMC free article] [PubMed] [Google Scholar]
- 86.Hudzicki J. Kirby-Bauer disk diffusion susceptibility test protocol. 2009.
Associated Data
This section collects any data citations, data availability statements, or supplementary materials included in this article.
Supplementary Materials
Data Availability Statement
Short read sequences supporting the findings of this study have been deposited in the European Nucleotide Archive (https://www.ebi.ac.uk/ena/) under the project accession number PRJEB45383. Accession numbers for isolates used in this study are listed in table S2. Publicly available sequences were downloaded from GenBank (https://www.ncbi.nlm.nih.gov/genbank/), Sequence Read Archive (https://www.ncbi.nlm.nih.gov/sra) or European Nucleotide Archive (https://www.ebi.ac.uk/ena) and EnteroBase (http://enterobase.warwick.ac.uk/). Accession numbers of publicly available genomes are listed in table S3. Phylogenetic trees, antigen protein models and BEAST input and output files have been deposited in FigShare: (DOI: 10.6084/m9.figshare.14743833).
All codes used in this study have been described in the materials and methods, no custom algorithms were used for analyses.


