Abstract
Many oligodendrocyte precursor cells (OPCs) do not differentiate to form myelin, suggesting additional roles of this cell population. The zebrafish optic tectum contains OPCs in regions devoid of myelin. Elimination of these OPCs impaired precise control of retinal ganglion cell axon arbor size during formation and maturation of retinotectal connectivity, and degraded functional processing of visual stimuli. Therefore, OPCs fine-tune neural circuits independently of their canonical role to make myelin.
Oligodendrocytes play crucial roles in modulating information processing through regulation of axon conduction and metabolism 1,2 . Myelinating oligodendrocytes arise by differentiation of oligodendrocyte precursor cells (OPCs), which are uniformly distributed across the CNS and tile the tissue with their elaborate process networks 3 . The formation of new myelin through oligodendrocyte differentiation continues into adulthood and can dynamically change to shape axonal myelination 4–6 . However, the CNS comprises more OPCs than ever differentiate, making about 5% of all CNS cells lifelong 7 . How this persistent population of resident CNS cells affects the CNS apart from being the cellular source of new myelin is largely unclear.
OPCs are a heterogenous population with different properties 8,9 . Clonal analyses have shown that a large proportion of OPCs does not directly generate myelinating oligodendrocytes, suggesting that these cells may have additional physiological functions in the healthy CNS 10 . Indeed, OPCs express molecules that can affect form and function of neurons 11–13 , and altered gene expression in OPCs has recently been linked to mood disorders in humans. However, as changes in OPCs also affect myelination, it remains unclear if roles in the formation of a functional neural circuit can be directly attributed to OPCs that are independent of myelination.
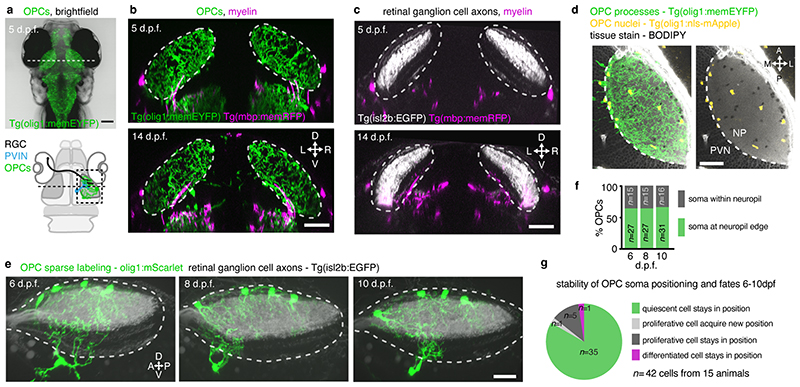
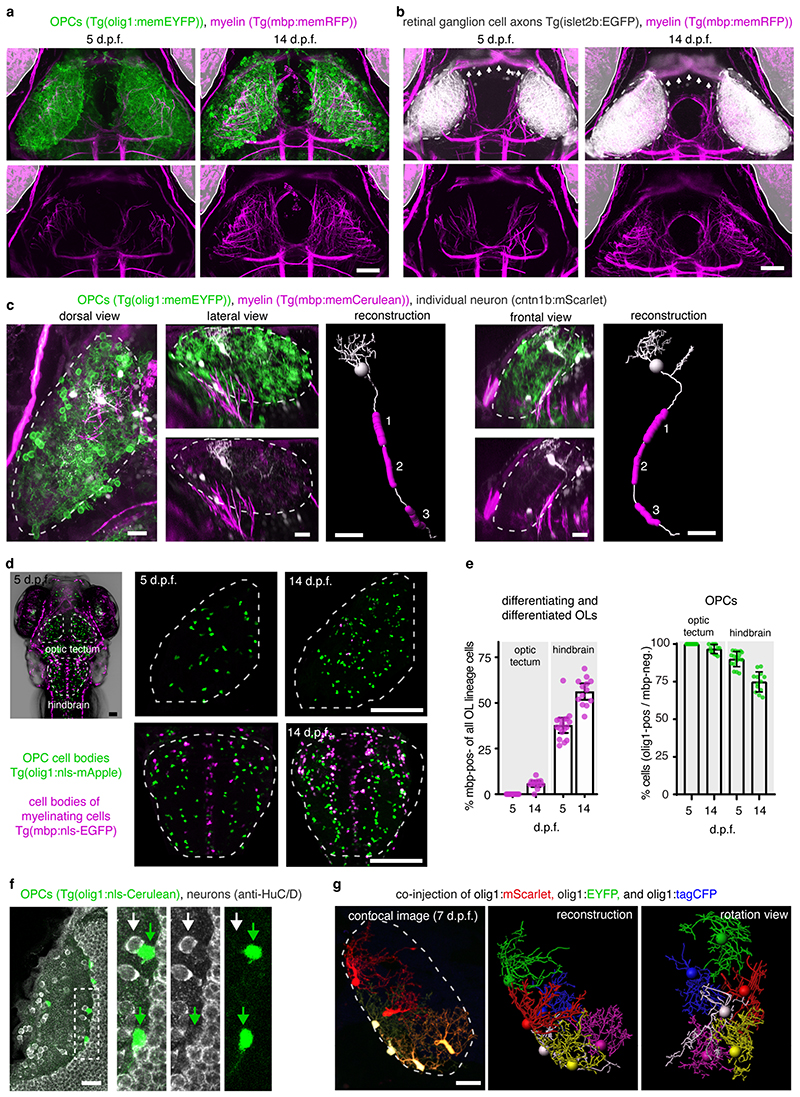
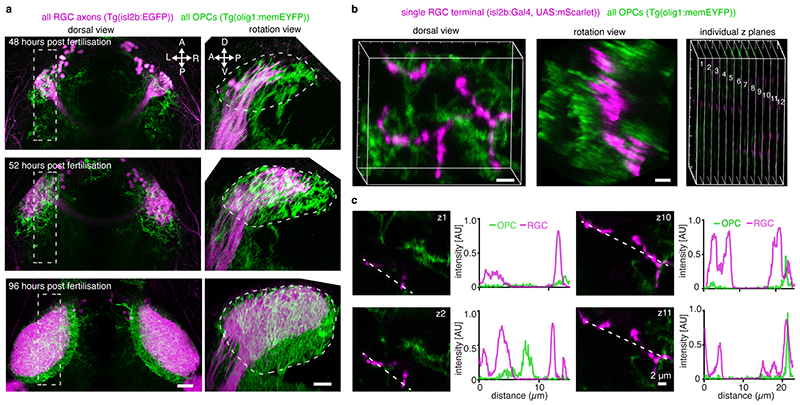
To reveal myelination-independent roles for OPCs, we have identified the optic tectum of larval zebrafish as a brain area which is densely interspersed with OPCs that rarely differentiate to oligodendrocytes (Fig. 1, Extended Data Fig. 1a-c, Supplementary Videos 1 and 2). Transgenic lines labeling retinal ganglion cell (RGC) axons as primary input to the tectum (Tg(isl2b:EGFP)), OPCs (Tg(olig1:memEYFP)), and myelin (Tg(mbp:memRFP)) allowed to carry out high-resolution, whole brain imaging of neuron-oligodendrocyte interactions. Myelination of RGC axons was observed along the optic nerve and along tectal neuron axons projecting to deep brain areas (Extended Data Fig. 1a-c). However, the tectal neuropil where RGC axons connect to tectal neuron dendrites remained largely devoid of myelin until at least 14 days post fertilization (d.p.f.) despite being interspersed with OPC processes throughout (Fig. 1b, c). Quantification of oligodendrocyte numbers confirmed that no more than 6% of oligodendrocyte lineage cells differentiated by 14 d.p.f., in strong contrast to hindbrain regions showing 56% differentiation (Extended Data Fig. 1d, e). Within the tectum, OPCs localized their soma either at the border between neuropil and periventricular zone containing the majority of tectal neurons or right within the neuropil (Fig. 1d-f, Extended Data Fig. 1f), and claimed non-overlapping territories, similar to previous studies (Extended Data Fig. 1g, Supplementary Video 3) 10,14,15 . OPCs can be highly dynamic and potentially migrate, proliferate, or differentiate. However, sparse labeling revealed that soma positioning of individual tectal OPCs remained largely stable with a low rate of division and differentiation between 6-10 dpf (Fig. 1f-g).
Fig. 1. The tectal neuropil of larval zebrafish is interspersed with OPC processes but largely devoid of myelin.
a) Transgenic zebrafish showing OPC processes throughout the brain. Dashed line indicates cross-sectional plane shown in b and c. Schematic of zebrafish brain delineates RGC axons, dendrites of periventricular interneurons (PVINs), and OPCs in tectal neuropil.
b and c) Cross sectional views of transgenic zebrafish showing that OPC processes intersperse the tectal neuropil (dashed lines) while myelin is largely absent. Scale bars: 50 μm.
d) Subprojection of OPC reporter lines (dorsal view) stained with BODIPY to outline tectal neuropil (NP) and the periventricular zone (PVZ) where cell bodies of PVINs reside. Dashed lines indicate border between NP and PVZ. Scale bar: 40 μm.
e)Time-lapse of four individual OPCs (lateral rotation view). Dashed lines depict tectal neuropil. Scale bar: 20 μm.
f and g) Quantifications of individual OPCs as shown in e showing low rates of soma position changes, division and differentiation.
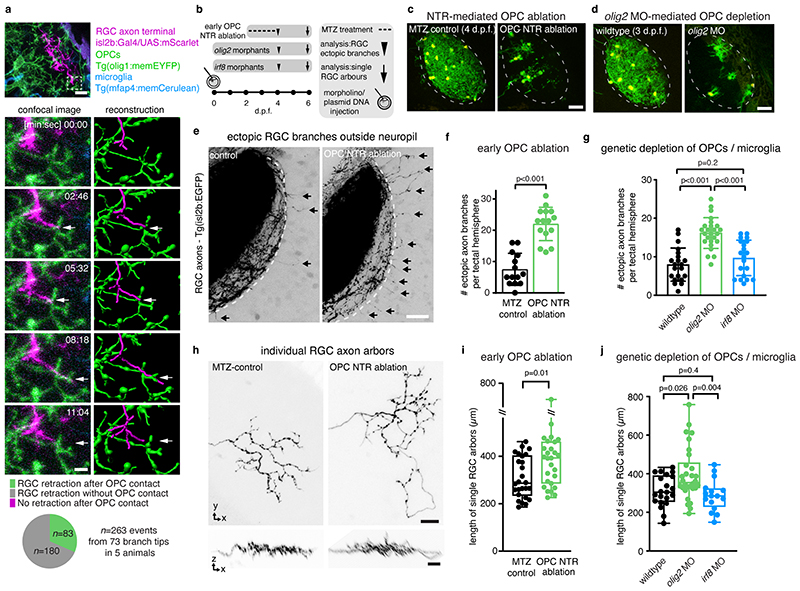
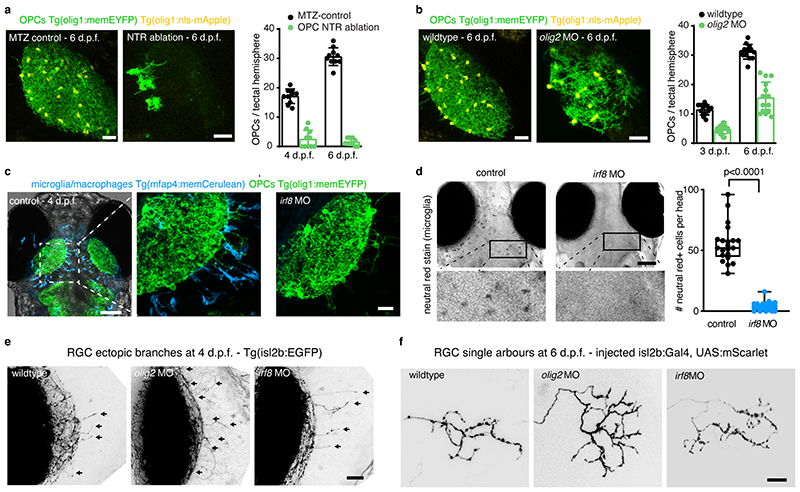
The appearance of OPCs coincided with the time when RGC axons arrive in the developing tectum and establish their terminal arborizations (Extended Data Fig. 2a). Time-lapse imaging revealed that RGC arbors dynamically interact with OPC processes and that interactions frequently preceded retractions of arbor tips (Fig. 2a, Extended Data Fig. 2b, c, Supplementary Videos 4-7). This correlation prompted us to ask whether OPCs influence the organization of RGC arbors. We tested this using an inducible Nitroreductase (NTR)-mediated cell ablation system specifically targeted to OPCs (Tg(olig1:CFP-NTR)) (Fig. 2b, c, Extended Data Fig. 3a). Early OPC ablation from 2dpf when RGC axons arrive at the tectum led to formation of erroneous axon branches reaching outside the tectal neuropil, as well as enlarged sizes of individual RGC arbors (Fig. 2e, f, h, i). To exclude that this phenotype was mediated indirectly by microglia clearing dying OPCs, or by diverting microglial activities which have an established role at eliminating synapses 16 , we carried out two controls: genetic depletion of OPCs without causing inflammation by morpholino injection against olig2, and depletion of microglia using a morpholino against interferon regulatory factor 8 (irf8) (Fig. 2d, Extended Data Fig. 3b-d). While olig2 morphants also exhibited ectopic branching and enlarged RGC arbors, none of these phenotypes were seen irf8 morphants (Fig. 2g, j, Extended Data Fig. 3e, f). Therefore, erroneous RGC arborizations and enlarged RGC arbors resulted directly from the absence of OPCs.
Fig. 2. Early OPC depletion causes formation of aberrant RGC arborizations.
a) Time-lapse showing dynamic interactions between RGC axon arbors and OPC processes. Dashed box indicates position of timelapse shown. Arrows indicate when extending RGC process interdigitates with OPC process and subsequently retracts (see Supplementary Video 6 for 3D rotation to demonstrate contact). Pie chart shows frequency of RGC retractions with and without prior OPC contact. Scale bars: 10 μm (top), 2μm (bottom).
b)Timelines of manipulations in this figure.
c and d) Example images of NTR-mediated OPC ablation (c) and olig2 morpholino-mediated OPC depletion. Dashed lines indicate neuropil. Scale bars: 25μm.
e and f) Increased formation of ectopic RGC axon branches extending outside tectal neuropil (arrows) upon early ablation of OPCs (mean 7.5±5.1 S.D. in control vs. 22.0±5.3 in OPC-NTR ablation, n=14/15 animals from four experiments, unpaired two-tailed t test, t=7.466, d.f.=27)._Dashed lines indicate border between NP and PVZ. Scale bar: 20 μm.
g) Increased formation of ectopic RGC axon branches upon genetic OPC reduction (olig2 morphants) but not upon microglial depletion (irf8 morphants) (mean 7.9±4.3 S.D. in control vs. I6.2±3.9 in olig2 MO vs. 9.7±4.6 in irf8 MO, n=21/25/20 animals from three experiments, one-way ANOVA, F(2, 63)=23.69).
h and i) Increased size of single RGC arbors upon early OPC ablation (top) whilst maintaining single lamina layering (bottom) (median 287±403/235 I.Q.R. in control vs. 393±46l/286 in OPC-NTR ablation, n=26/27 axons in 24/23 animals from three experiments, two-tailed Mann-Whitney U test, U=210). Scale bars: 10 μm.
j) Increased size of single RGC arbors upon genetic OPC depletion (olig2 morphants) but not upon microglial depletion (irf8 morphants) (median 304±39l/255 I.Q.R. in control vs. 355±458/326 in olig2 MO vs. 285±323/229 in irf8 MO, n=21/30/16 axons in 11/14/12 animals from five experiments, Kruskal Wallis test, test statistic=9.9)
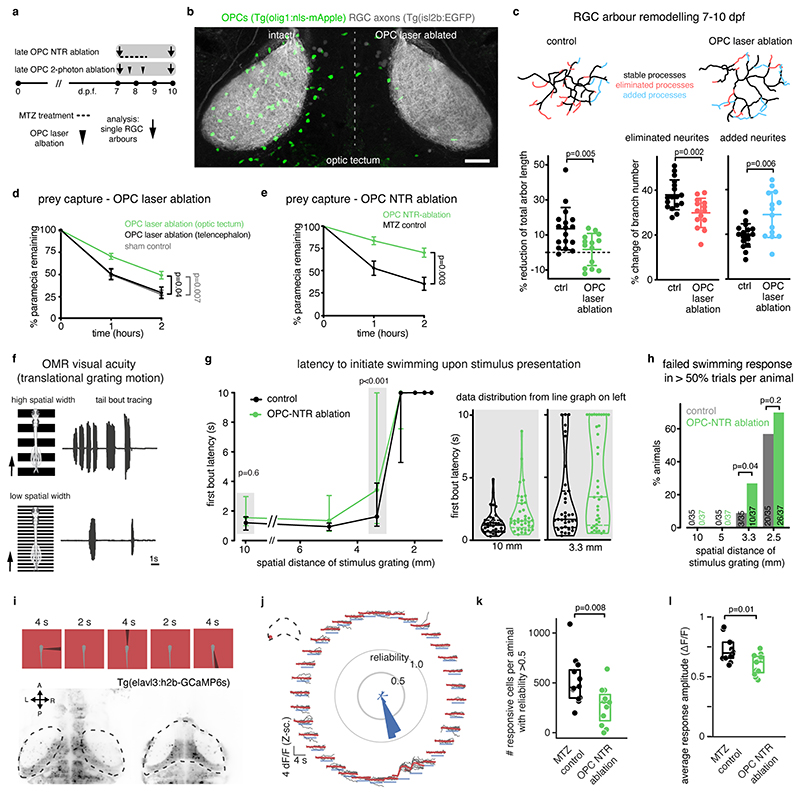
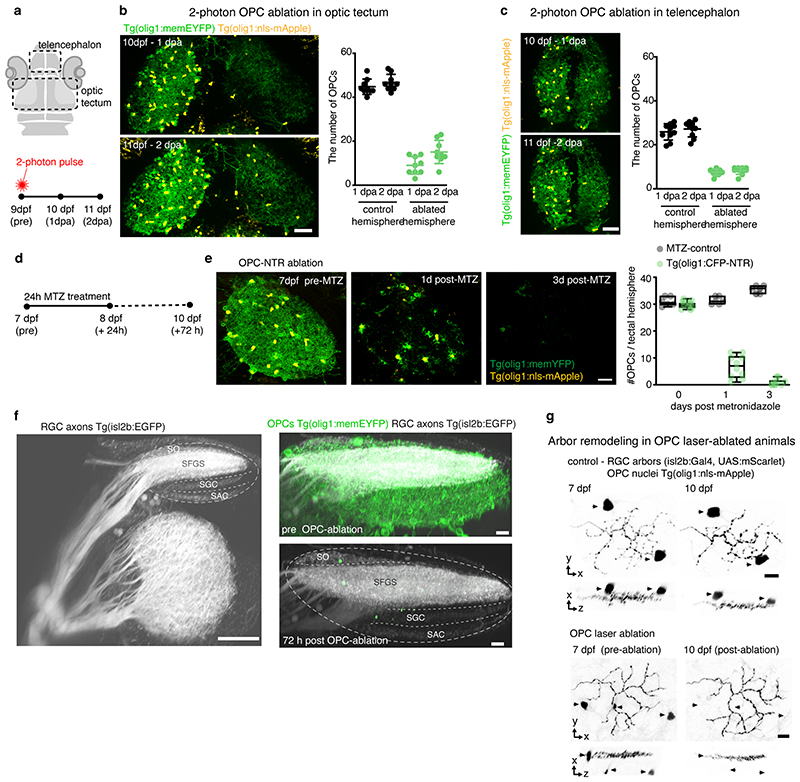
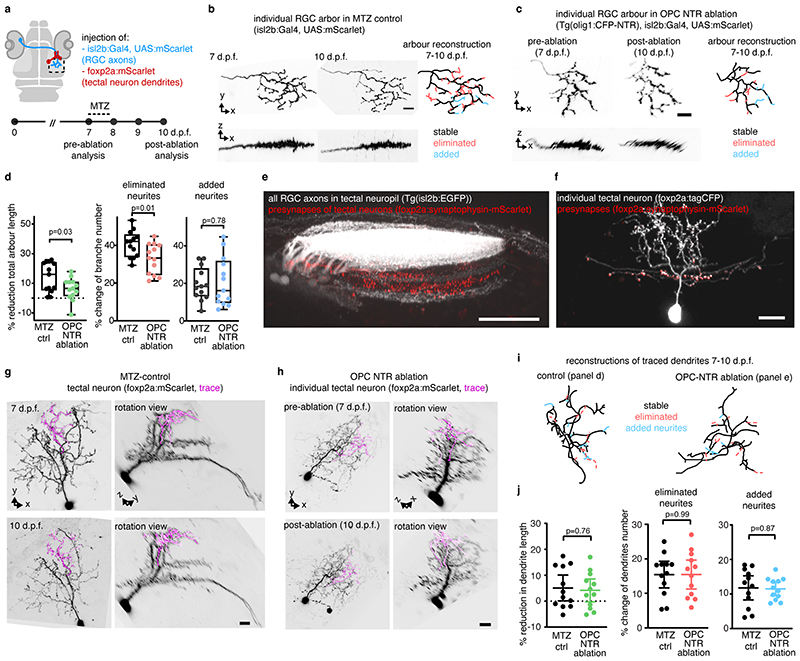
Following their formation, RGC arbors undergo a phase of developmental pruning during larval stages when retinotectal connectivity is refined 17,18 . To test whether OPCs also play a long-lasting role during the refinement of RGC arbors as they continue to persist and interact with each other, we carried out late OPC ablations starting from 7 d.p.f. when zebrafish have a functional visual system. Ablations were carried out analogously using NTR-mediated chemogenetics, or by 2-photon-mediated cell ablation to specifically eliminate OPCs from the tectum (Fig. 3, Extended Data Fig. 4). In control animals, individual RGC arbors underwent process remodeling with additions and eliminations of multiple neurites that lead to a net reduction in arbor size by about 14% between 7 and 10 d.p.f., similar to previous reports (Fig. 3c, Extended Data Fig. 4g, 5a-d) 18 . This reduction in arbor size was significantly decreased in OPC-ablated animals (1.7 % after OPC laser ablation, 6% after OPC NTR ablation), with some arbors even increasing in size due to a reduction in neurite eliminations and an increase in neurite additions following laser-mediated OPC ablation (Fig. 3c, Extended Data Fig. 4g, 5a-d). Despite changes in size, individual arbors remained stratified (Extended Data Fig. 4g, 5b, c). Furthermore, the effects on neurite remodeling were specific to axonal processes because remodeling of tectal neuron dendrites in the same tissue was unaffected upon OPC ablation, further corroborating that the effects observed did not result from unspecific collateral damage induced by our manipulations (Extended Data Fig. 5e-j).
Fig. 3. Late OPC ablation impairs RGC arbor remodeling and circuit function.
a) Timelines of manipulations for late OPC ablations.
b) Examples showing unilateral laser ablation of OPCs in the tectum. Scale bar: 20 μm.
c) Reconstructions of time-projected RGC arbors highlighting stable, eliminated, and added processes. Quantifications show diminished developmental reduction of RGC arbors between 7 and 10 dpf in OPC-ablated animals (left graph), mediated by decreased branch eliminations (middle) and enhanced additions (right) (left: mean 13.6 ±12.1 S.D. in control vs. I.7±9.2 in OPC laser ablation; middle: 37.9±6.7 vs. 29.9±6.6; right: I9.5±5.2 vs. 28.8±I0.2; n=17/14 cells in 11/9 animals from four experiments, unpaired two-tailed t test, left: t=3.022, d.f.=29; middle: t=3.372, d.f.=29; right: t=3.089, d.f.=18.44).
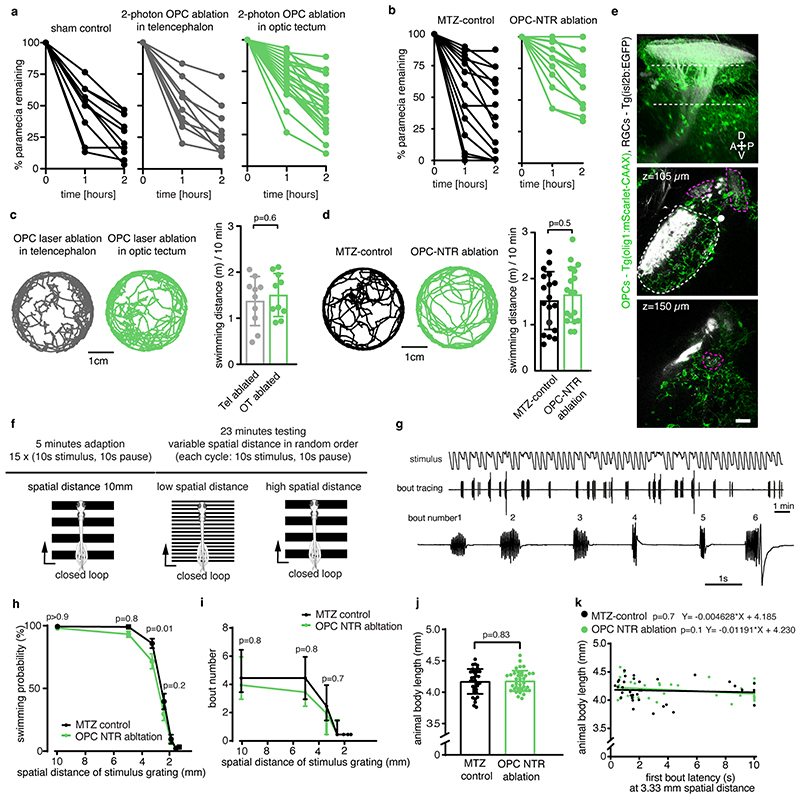
d and e) Impaired paramecium capture rates upon tectal OPC laser ablation (d) and OPC NTR ablation (e); (d: mean 27.6±4.9 S.E.M. in sham control vs. 29.7±6.3 in telencephalic OPC ablation vs. 49.2±4.2 in tectal OPC ablation at two-hour time point, n=11/10/23 animals from four experiments, two-way ANOVA, F(4,123)=3.369); (e: mean 35.2±7.3 S.E.M. in MTZ control vs. 70.2±5.l in OPC NTR ablation at two-hour time point, n=18 animals per group from four experiments, two-way ANOVA, F(2,102=6.759).
f) Experimental setup of OMR elicited by moving gratings of different spatial widths and example trace of tail bout recording.
g) First bout latencies in OMR assays. Violin plots show distribution of individual data points at 10 mm and 3.3 mm spatial frequency (10mm: median 1.2 ±1.6/0.7 I.Q.R. in control vs. 1.5±2.9/1.O in OPC-NTR ablation; 3.3mm: median 1.6±3.9/0.9 in control vs. 3.4±9.9/1.1 in OPC-NTR ablation; n=35/37 animals from six experiments, two-way ANOVA, F(6, 490=1.853)
h) Enhanced possibility of failure to initiate swimming in response to narrow moving gratings upon OPC NTR ablation (one-tailed Fisher’s exact test).
i) Top: visual stimulation protocol for analyzing responses of tectal neurons. Bottom: example anatomies obtained from calcium imaging in two different planes. Dashed lines indicate optic tectum.
j) Visual responses from an example neuron. Each plot reports individual (black) and average responses (red), plot position indicates position of the stimulus (top=frontal). Polar histogram represents the reliability score for this neuron to each stimulus position.
k) Decreased number of reliably responsive neurons in OPC ablated animals (median 457± 351/633 I.Q.R. in control vs. 307±123/386 in OPC-NTR ablation, two-tailed Mann–Whitney U test, U=2.6465, n =12/11 animals from three experiments).
l) Decreased response amplitudes in OPC ablated animals (median 0.700±0.658/0.791, I.Q.R. in control vs. 0.624±0.536/0.672 in OPC-NTR ablation, two-tailed Mann–Whitney U test, U=2.4618, n=12/11 animals from three experiments).
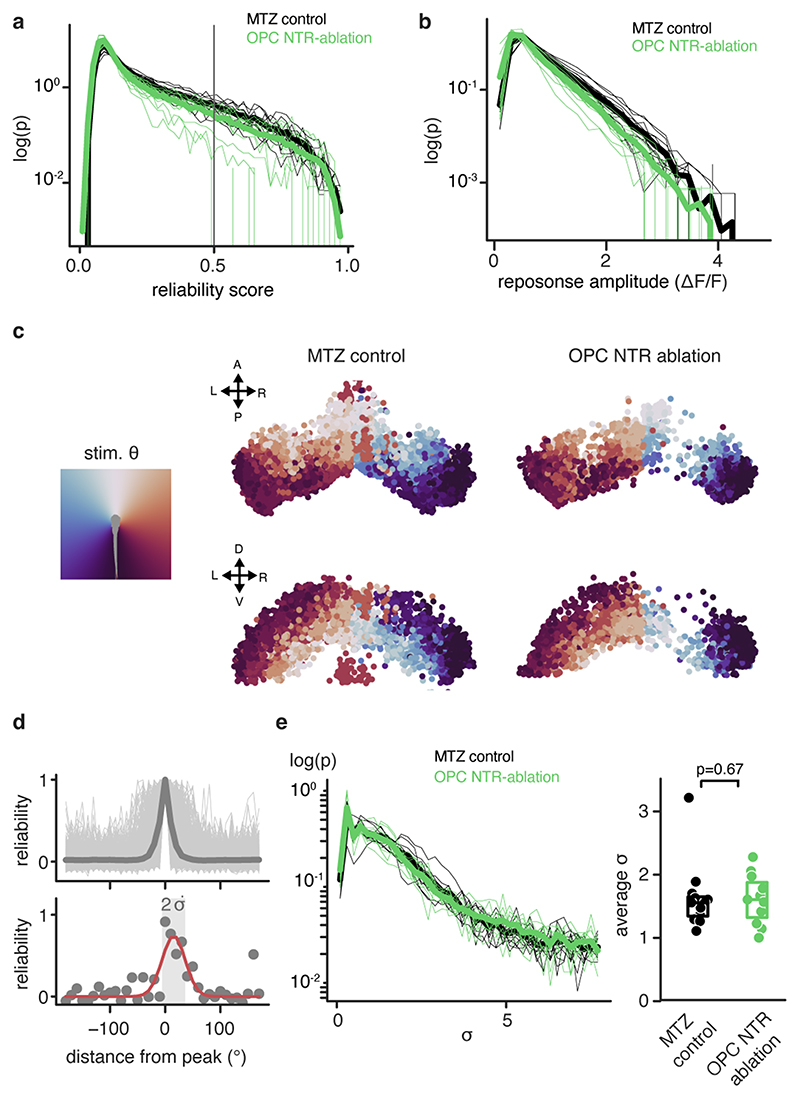
It has been reported that enlarged RGC arbors impair visual processing 19 . To test if OPC ablation affects functional performance as the visual system matures, we first carried out prey capture assays in late ablations from 7 d.p.f. onwards. These experiments showed that about two times more paramecia remained uncaptured in OPC NTR-ablated animals, and about 70% more paramecia remained uncaptured after unilateral laser ablation of tectal OPCs (Fig. 3d, e, Extended Data Fig. 6a, b). This effect was specific to tectal OPCs as OPC laser ablation from telencephalic regions did not impair paramecium capture (Fig. 3d, Extended Data Fig. 6a). None of our manipulations affected overall swimming activity, ruling out that gross locomotor defects account for reduced hunting (Extended Data Fig. 6c, d). Furthermore, we performed optomotor response (OMR) assays stimulated by moving gratings of different widths Extended Data Fig. 6f, g, Supplementary Video 8). Narrower gratings become increasingly difficult to resolve, leading to longer latencies and ultimate failure to elicit OMR (Fig. 3f). After global NTR-mediated OPC ablation, animals were able to robustly elicit OMR in response to wide gratings (10mm width), but there was a significantly increased probability of failure to initiate OMR when narrow gratings (3.3mm) were presented (Fig. 3g, h, Extended Data Fig. 6h-k). It is known that OMR does not primarily require the tectum but rather pretectal areas to where RGC axons can extend collaterals in addition to the tectum 20,21 , and in which OPCs also reside (Extended Data Fig. 6e). However, to test if OPCs within the tectum are of direct importance for functional sensory integration, we carried out in vivo calcium imaging of tectal neurons using Tg(elavl3:h2b-GCaMP6s) in response to light flashes in random positions around the visual field (Fig. 3i, j). Visual responses in OPC NTR-ablated animals were less reliable (Fig. 3k) and smaller in amplitude (Fig. 3l), while receptive field size and overall retinotopy along the tectum remained intact (Extended Data Fig. 7). Together, these data show that OPC ablation impairs visual processing.
In summary, our data reveal a physiological role for OPCs in fine-tuning the structure and function of neural circuits that is independent of their traditional role in myelin formation, and which is mediated by regulating growth and remodeling of axon arbors. It remains an open question if regulation of arbor growth and remodeling by OPCs at different developmental stages might be mediated by different mechanisms, as OPCs constantly express growth-inhibitory molecules such as chondroitin sulfate proteoglycans 22 , but have also been reported to phagocytose axons 23 , similar to how microglia can prune axons 24 . Do OPCs guide or prune axons, or both? Independent of the glial mechanism, how do changes in axon arbors translate into impaired neuronal connectivity underlying visual processing? Future work will reveal these mechanisms.
Methods
Zebrafish lines and husbandry
We used the following existing zebrafish lines and strains: Tg(mbp:nls-EGFP)zf3078tg 25, Tg(mbp:memRFP)tum101tg 26, Tg(mbp:memCerulean)tum102tg 26, Tg(olig1:memEYFP)tum107tg 10, Tg(olig1:nls-mApple)tum109tg 10, Tg(olig1:mScarlet-CAAX) 27 Tg(olig1:nls-Cerulean)tum108tg 10, Tg(mfap4:memCerulean)tum104tg 10, Tg(isl2b:EGFP)zc7tg 28, Tg(elavl3:h2b-GCaMP6)jf5tg 29, AB and nacre. The transgenic line Tg(olig1:CFP-NTR) has been newly generated for this study. All animals were kept at 28.5 °C with a 14h-10h light-dark cycle according to local animal welfare regulations. All experiments carried out with zebrafish at protected stages have been approved by the government of Upper Bavaria (Regierung Oberbayern - Sachgebiet 54; ROB-55.2-1-54-2532.Vet_02-18-153, ROB-55.2-2532.Vet_02-15-199, and ROB-55.2-2532.Vet_02-15-200 to T.C.) and the Animals in Science Regulation Unit of the UK Home Office (PP5258250 to Prof. David Lyons).
Transgenesis constructs
To generate the middle entry clone pME_EYFP, the coding sequence was PCR amplified from a template plasmid using the primers attB1_YFP_F (GGGGACAAGTTTGTACAAAAAAGCAGGCTGCCACCATGCTGTGCTGC) and attB2R_YFP_R (GGGGACCACTTTGTACAAGAAAGCTGGGTCTTACTTGTACAGCTCGTCCATGC). The PCR product was recombination cloned into pDONR221 using BP clonase (Invitrogen).
The expression constructs pTol2_olig1:mScarlet, pTol2_olig1:EYFP, pTol2_olig1:tagCFP, pTol2_olig1:tagCFP-NTR, pTol2_cntn1b:mScarlet, pTol2_foxp2A:mScarlet, and pTol2_foxp2A:Synaptophysin-mScarlet were generated in multisite LR recombination reactions with the entry clone described above, p5E_olig1 26 , p5E_cntn1b 30 , p5E_foxp2A (gift from Dr. Meyer M.P., King’s College London) 31 , pME_tagCFP 26 , pME_mScarlet 10 , pME_Synaptophysin-nostop 10 , p3E_NTR-pA 25 , p3E_pA and pDestTol2_pA of the Tol2Kit 32 . The expression construct pTol2_isl2b:Gal4 using a published isl2b promoter clone 33 was a kind gift of Dr. Leanne Godinho (TU Munich) and originally provided by Dr. Rachel Wong (Washington University); pTol2_olig1:memEYFP, and pTol2_10xUAS:mScarlet have been published previously 10 .
DNA microinjection for sparse labeling and generation of transgenic lines
Fertilized eggs at one-cell stage were microinjected with 1 nl of a solution containing 5-20 ng/μl DNA plasmid and 20 ng/μl Tol2 transposase mRNA. Injected F0 animals were either used for single-cell analysis or raised to adulthood to generate full transgenic lines. For this, adult F0 animals were outcrossed with wild-type zebrafish, and F1 offspring were screened for presence of the reporter transgene under a fluorescence stereo dissecting microscope (Nikon SMZ18). “Tg(promoter:reporter)” denotes a stable transgenic line, whereas “promoter:reporter” alone indicates that a respective plasmid DNA was injected for sparse labeling of individual cells.
OPC ablation using Nitroreductase (NTR)
For NTR mediated OPC ablation at early developmental stages, Tg(olig1:CFP-NTR) zebrafish at 2dpf were incubated in 10mM metronidazole (MTZ) dissolved with 0.2% DMSO in 0.3× Danieau’s solution for 48h at 28°C in the dark, with a change of solution after 24h. After MTZ incubation, embryos were rinsed and kept in 0.3×Danieau’s solution until analysis.
For NTR-mediated OPC ablation at later larval stages, Tg(olig1:CFP-NTR) zebrafish at 7dpf were incubated in 10mM metronidazole (MTZ) dissolved with 0.2% DMSO in 0.3× Danieau’s solution for 24h at 28°C in the dark. After MTZ incubation, larvae were rinsed and kept in nursery tanks with standard diet until 10 dpf. Non NTR-expressing zebrafish treated with 10 mM MTZ were used as controls in all experiments.
OPC ablation using two-photon lasers
OPCs were laser ablated from Tg(olig1:nls-mApple) using an Olympus FV1000/MPE equipped with a MaiTai DeepSee HP (Newport/Spectra Physics) and a 25x 1.05 NA MP (XLPLN25XWMP) water immersion objective. Continuous confocal scans using a 559nm laser were taken to locate individual OPC nuclei in the optic tectum, which was identified by additional transgenic genetic markers (Tg(olig1:memYFP) or Tg(isl2b:EGFP)). Each cell was ablated using a 500 ms line scan across the cell nucleus using the MaiTai laser tuned to 770nm (1.75W output). The wavelength was incrementally increased for ablating OPCs in deeper tissue. After successful ablation, previously bright, round nuclei appeared dim, irregular or fragmented. The ablation procedure was repeated when cells did not show this signature. Unilateral OPC ablations took 60-90min in the tectum. For analysis of axon remodeling after OPC laser ablation, surviving and/or repopulating OPCs were ablated again on the second day.
Morpholino-mediated depletion of microglia and OPCs
Microglia were depleted from zebrafish embryos by microinjection of 4.5pg of a previously published morpholino targeting the start codon of irf8 (5′-TCAGTCTGCGACCGCCCGAGTTCAT-3′) 34 . OPCs were depleted by microinjection of 7.5pg of a previously published morpholino targeting the start codon of olig2 (5’-ACACTCGGCTCGTGTCAGAGTCCAT-3’) 35 . Both morpholinos were synthesized by Gene Tools.
Neutral red staining
Zebrafish embryos were incubated for 2.5 h in the dark in 2.5μg/ml neutral red solution (Sigma Aldrich, n2889) diluted in Danieau’s solution. Afterwards, embryos were washed 3 times 10 minutes with Danieau’s solution. Brightfield images of the head of the fish were taken using a Leica DFC300 FX Digital Color Camera.
Prey capture assay
2 ml 0.3×Danieau’s solution with 30 Paramecium multimicronucleatum were added to a 35mm dish, along with a single zebrafish larva. The number of remaining paramecia was determined at hourly intervals for 2 hours. To rule out batch dependent effects resulting from “natural” paramecia death followed by their disintegration, a control containing paramecia but no fish was run alongside each experiment. Spontaneous paramecia death occurred only rarely in 0-3%.
Locomotor activity assay
For all experiments, testing occurred between 9 am and 5 pm using a randomized trial design to eliminate systematic effects due to the time of day. A tracking chamber was prepared by using a 35 mm petri dish mold surrounded by 1% agarose situated in the center of a 85 mm petri plate to eliminate mirroring that occurs at the wall of a plastic petri dish. Single zebrafish were placed into the well filled with 2 ml 0.3× Danieau’s solution. The plate was positioned above an LED light stage to maximize contrast for facilitating zebrafish tracking (two dark eyes and swim bladder of zebrafish larva on a light background), with a high-speed camera (XIMEA MQ013MG-ON) equipped with a Kowa LM35JC10M objective positioned above the dish. The larvae acclimated to the recording arena for 5 min before the start of video acquisition. The center of mass of two eyes and swim bladder was taken as the center of the fish. Subsequently, video of spontaneous freely-swimming was recorded for 10 min at 100 Hz using a custom written Python script and the Stytra package 36 .
Optomotor response assay
Zebrafish larvae were embedded in 1% agarose in a 35 mm petri dish. After allowing the agarose to set, the dish was filled with 0.3× Danieau’s solution and the agarose around the tail was removed with a scalpel, leaving the tail of fish free to move (hereby referred to as a head-restrained preparation) 37 . Visual stimuli were presented on the screen from below using an Asus P3E micro projector and an infrared light (Osram 850 nm high power LED). The fish’s tail was tracked using a high-speed camera (XIMEA MQ013MG-ON) and a 50mm telecentric objective (Navitar TC.5028). A square-wave grating with variable spatial period and maximal contrast achieved by the projector (black and white bars), and online tail tracking and stimulus control was performed using Stytra software 0.8.26 36 . Experiments were performed in closed-loop, meaning that the behavior of fish was fed back to the visual stimulus to provide the fish with visual feedback. Therefore, when the fish swam, the grating accelerated backward at a rate proportional to swim power, i.e., [stimulus velocity] = 10 – [gain] × [swim power]. Swim power was defined as the standard deviation of the tail oscillation in a rolling window of 50 ms. To obtain a feedback that mimics the visual feedback the animal would receive when freely swimming, the gain multiplication factor was chosen to result in an average fictive velocity of about 25 mm/s during the bout. When the fish was not swimming [swim power] = 0, the grating moved in a caudal to rostral (forward) direction at a baseline speed of 10 mm/s. The stimulus scene was a square window that was centered on the head of fish and spanned a field of total 60 × 60 mm. For analysis, individual bouts were counted as episodes where the swim power was above 0.1 rad for at least 100 ms. Then latency to first bout and total number of bouts were quantified for each trial (Latency was set a default value equal to the stimulus duration, when fish did not respond). Analysis was performed with custom scripts written in Python.
Zebrafish mounting for live-cell microscopy
Zebrafish larvae were anaesthetized with 0.2 mg/ml 3-aminobenzoic acid ethyl ester (MS-222). For confocal microscopy, animals were mounted ventral side up in 1% ultrapure low melting point agarose (Invitrogen) onto a glass-bottom 3-cm Petri dish (MatTek). For two-photon microscopy, embryos were mounted ventral side up in low melting point agarose on a glass coverslip. The coverslip was then flipped over on a glass slide with a ring of high-vacuum grease filled with a drop of 0.2 mg/ml MS-222 to prevent drying out of the agarose. After imaging, the animals were either euthanized or released from the agarose using microsurgery forceps and kept individually until further use.
Immunohistochemistry
Samples were fixed overnight at 4°C in a solution of 4% paraformaldehyde in phosphate-buffered saline (PBS) solution containing 1% Tween-20 (PBST). After fixation, the samples were washed in the same solution without fixative and blocked for 1.5 h at room temperature in PBS buffer, 0.1% Tween20, 10% FCS, 0.1% BSA and 3% normal goat serum. Primary antibody incubation was conducted at 4°C overnight in blocking solution. Afterwards, samples were washed three times in PBS with 0.1% Tween20 and then incubated with Alexa Fluor 633-conjugated secondary antibody. Stained samples were washed three times in PBS with 0.1% Tween20, and subsequently mounted with ProLong Diamond Antifade Mountant (Thermo Fisher Scientific). Primary antibody rabbit anti-HuC/D (abcam ab210554) were used at a dilution of 1/100. Goat anti-rabbit secondary antibody (Thermo Fisher) were used at a dilution of 1:1000. Images were obtained using a confocal microscope (Leica TCS SP8).
Confocal microscopy
Images of embedded zebrafish were taken at a Leica TCS SP8 confocal laser scanning microscope (LASX 3.5.2.18963). We used 458 nm for excitation of Cerulean and tagCFP; 458 and 488 nm for EGFP; 514 nm for EYFP; 561 nm for mApple and mScarlet; 633 nm for AF633 and BODIPY630/650. For overview images and analysis of cell numbers based on nuclear transgenes, we used a 10× /0.4 NA objective (acquisition with 568 nm pixel size (xy) and 2 μm z-spacing). For all other analyses, we acquired 8 or 12 bit confocal images using a 25× /0.95 NA H2O objective with 114–151 nm pixel size (xy) and 1 or 1.5 μm z-spacing.
Analysis of contact-mediated retraction between RGC axons and OPC processes
For analyzing dynamic interactions between RGC axon arbors and OPC processes, images were taken over 2 hours within 2 min intervals and 1 μm z-spacing. Three-dimensional movies were subsequently generated for analyzing RGC retraction using Imaris software. Contact-mediated repulsion was classified as every event in which the tip of an extending RGC process directly opposed or apposed an OPC process, followed by RGC process retraction to resolve this apposition within the following 7 frames. RGC processes which changed from extension to retraction without such prior contact to OPC processes were categorized as contact-independent retraction.
Analysis of axonal and dendritic arbor remodeling
Only RGC axons that arborized within the tectal neuropil and which could be traced back to the optic nerve were included for analysis. The neurites of PVIN extending to the superficial layers were randomly selected for analysis, as the dendrites of PVIN located in the superficial layers and their axons are located in deeper layers 38 . Individual axonal and dendritic arbors were analyzed using the segmentation tool of 3D tracing in the simple neurite tracer plugin in Fiji/ImageJ 39 . Each arbor was traced from its first branch point out to all branch tips, and each branch segment was counted from the branch point to the next branch point or branch tips. From this tracing, we extracted the measurement of total branch length and the total number of branch segments. The eliminated/added branch segment was obtained by comparing the tracing of the same neuron at two time points.
Lightsheet imaging for functional calcium imaging of tectal neurons
For lightsheet imaging, MTZ-treated Tg(olig1:CFP-NTR), Tg(elavl3:h2b-GCaMP6s) with late OPC ablation and MTZ-treated control Tg(elavl3:h2b-GCaMP6s) fish were embedded at the center of a custom built plastic chamber using 2-2.5% low-melting point agarose. The chamber was then placed onto the stage of a custom-built lightsheet microscope, already described in 40 . In brief, light from a 473 nm laser (Cobolt) was scanned with galvanometric mirrors (Sigmann Electronic) horizontally to create a ~5um thick excitation sheet. The sheet was then moved vertically together with the light collection objective, controlled with a piezo controller (Piezosystem Jena). The eyes were protected from the incoming light by two plastic screens positioned at the conjugate plane of the scanning laser focus. Two orthogonal sheets were generated: one impinged on the brain from the side, and the other one from the front, to ensure extensive coverage of the whole brain without hitting the eyes. The image was filtered with a band-pass 525/50 filter and acquired using an Orca Flash v4.0 camera (Hamamatsu Photonics). The microscope was controlled using the Sashimi package (https://zenodo.org/record/4122062#.YQl7yC0RpQI). We acquired volumes of ~130 x 400 x 340 um (dorso-ventral, left-right, anterior-posterior axes, respectively), at a resolution of 15 x 0.6 x 0.6 um and a framerate of 3 Hz.
Visual stimuli were projected on a white plastic screen placed below the fish. The protocol consisted of a sequence of dark flashes on a red background, spanning 10° circular sectors of the area around the fish for a total of 36 different locations. Flashes were shown for 4 seconds, with a pause of 2 seconds of flat red background between them, and presented 10 times each in a sequence randomized differently for every fish. The script for generating the experimental protocol in Stytra is available in the code repository. Synchronization between the imaging and the stimulus presentation was achieved by ZMQ-mediated triggering between Stytra and Sashimi.
Imaging data preprocessing for calcium imaging
Raw stacks from the lightsheet imaging were inspected and fish with excessive drift were discarded, blindly to experimental group. 2/25 fish were excluded, and all the remaining fish (n=12 MTZ-control fish and n=11 OPC-ablated fish) were included for all subsequent analyses. The data was fed into suite2p for alignment and region of interest (ROI) segmentation. Suite2p parameters were kept mostly at their standard values, adjusting values for cell side and temporal sampling frequency. The cell classification and the deconvolution steps were skipped in the suite2p pipeline, and Z-scored raw fluorescence extracted from all detected ROIs were used in all subsequent analyses. The script used for running the data pre-processing with suite2p is available in the code repository.
After alignment, a mask delineating the optic tectum was drawn manually for each fish using pipra 41 , to include only ROI in this region for further analysis. However, responsiveness of all the best scoring ROI for this stimulus were located in the optic tectum, and the conclusions hold regardless of this selection criterion and the exact boundaries of the masks.
Analysis of calcium responses to visual stimulus
To quantify responses of neurons to individual stimuli, the activity from individual ROI was detrended (subtracting difference between first and last point), Z-scored, and chunked in a window of -2 to 5 s from the stimulus onset. To compute the reliability score, we obtained the cross-correlation matrix across all stimuli repetitions and averaged all its off-diagonal values. For the average amplitude, the absolute value of the difference was calculated between the integral of the response in the 4 seconds of the stimulus and during the 2 seconds of the pre-stimulus pause. For the estimation of the receptive field size, “visually responsive” (reliability score > 0.5) ROI were selected, and a gaussian curve to the array of reliability scores were fit over stimulus positions. The variance of the gaussian was taken as a measure of the width of the tuning curve. All statistical comparisons were performed using Mann-Whitney U test (with the implementation in scipy.stats.ranksums 42 ).
Image and data presentation
Images were analyzed with Fiji and Imaris. Morphology reconstructions were carried out with the Imaris FilamentTracer module. Data were prepared and assembled using Graphpad Prism 7, 8, and 9 Fiji, and Adobe Illustrator CS6 and 2021.
Statistics and reproducibility
For analyses that involved cohorts of animals or treatment groups, zebrafish embryos of all conditions were derived from the same clutch and selected at random before treatment. No additional randomization was used during data collection. For time-course analyses of OPCs and RGC, zebrafish were screened for single-cell labeling before imaging, and all animals with appropriate expression were used in the experiment. Two fish with excessive drift were discarded for calcium imaging, blindly to experimental group, no other data were excluded from the analyses. We selected sample sizes based on similar sample sizes that have previously reported 18,37,43,44 . No statistical analysis was used to pre-determine sample sizes. Data collection and analysis were not performed blind to the conditions of the experiments unless stated. Analysis was performed using Microsoft Excel and GraphPad Prism. All data were tested for normal distribution using the Shapiro–Wilk normality test before statistical testing. In the figures, bar graphs are shown as mean ± standard deviation (S.D.); line plots are shown as mean ± S.E.M., or median ± interquartile range (I.Q.R.); box and whiskers plots are expressed as median ± I.Q.R., minimum and maximum values; violin plots represent the median ± I.Q.R., minimum and maximum values. For statistical tests of normally distributed data that compared two groups, we used unpaired t-tests. Non-normally distributed data were tested for statistical significance using the Mann–Whitney U test (unpaired data). For multiple comparisons test, one-way analysis of variance (ANOVA) was used for parametric data and the Kruskal-Wallis test for non-parametric data (both with Benjamini-Krieger and Yekutieli correction). Repeated measurements were tested using two-way ANOVA with Sidak’s corrections. We used Fisher’s exact test to analyze contingency tables.
Extended Data
Extended Data Fig. 1.
Extended Data Fig. 2.
Extended Data Fig. 3.
Extended Data Fig. 4.
Extended Data Fig. 5.
Extended Data Fig. 6.
Extended Data Fig. 7.
Supplementary Material
Acknowledgments
We are grateful to Wenke Barkey for technical assistance, and to Thomas Misgeld for providing generous access to 2-photon microscopy equipment. We thank Rafael Almeida, David Lyons, and all members of the Czopka lab for discussion of the manuscript. We thank Martin Meyer (King’s College London) for the foxp2A plasmid, David Lyons (University of Edinburgh) for the olig2 morpholino, and Leanne Godinho/Rachel Wong (TU Munich/Washington University) for the isl2b:Gal4 plasmid. This work was funded by an ERC Starting grant (MecMy #714440) to TC, the German Research Foundation (DFG) SFB870/TP A14 (#118803580) and the Emmy Noether Programme (Cz226/1-1 and Cz226/1-2) to TC, the DFG under Germany’s Excellence Strategy within the framework of the Munich Cluster for Systems Neurology (EXC 2145 SyNergy #390857198) to TC and RP, and the TRR 274/1 2020 (#408885537) to RP. The funders had no role in study design, data collection and analysis, decision to publish or preparation of the manuscript.
Footnotes
Author contributions
Conceptualization: TC; Methodology: YX, LP, LJH; Software: LP and RP; Investigation: YX, LP, and LJH; Formal analysis: YX, LP, LJH; Supervision: RP and TC; Visualization: YX, LP, and TC; Writing: YX and TC; Funding acquisition: RP and TC.
Competing Interests Statement
The authors declare no competing interests
Data and materials availability
All data underlying this study will be made available upon reasonable request. Raw data for functional analysis have been deposited at http://doi.org/10.5281/zenodo.5894603
Code availability
The codes used for running and analyzing behavioral and imaging experiments are available at http://doi.org/10.5281/zenodo.5894770
References
- 1.Xin W, Chan JR. Nat Rev Neurosci. 2020;21:682–694. doi: 10.1038/s41583-020-00379-8. [DOI] [PMC free article] [PubMed] [Google Scholar]
- 2.Simons M, Nave K-A. Cold Spring Harbor perspectives in biology. 2015;8:a020479. doi: 10.1101/cshperspect.a020479. [DOI] [PMC free article] [PubMed] [Google Scholar]
- 3.Bergles DE, Richardson WD. Cold Spring Harbor perspectives in biology. 2015;8:a020453. doi: 10.1101/cshperspect.a020453. [DOI] [PMC free article] [PubMed] [Google Scholar]
- 4.McKenzie IA, et al. Science. 2014;346:318–322. doi: 10.1126/science.1254960. [DOI] [PMC free article] [PubMed] [Google Scholar]
- 5.Hill RA, Li AM, Grutzendler J. Nature Neuroscience. 2018;21:683–695. doi: 10.1038/s41593-018-0120-6. [DOI] [PMC free article] [PubMed] [Google Scholar]
- 6.Hughes EG, Orthmann-Murphy JL, Langseth AJ, Bergles DE. Nature Neuroscience. 2018;21:696–706. doi: 10.1038/s41593-018-0121-5. [DOI] [PMC free article] [PubMed] [Google Scholar]
- 7.Dawson MRL, Polito A, Levine JM, Reynolds R. Mol Cell Neurosci. 2003;24:476–488. doi: 10.1016/s1044-7431(03)00210-0. [DOI] [PubMed] [Google Scholar]
- 8.Spitzer SO, et al. Neuron. 2019;101:1–13. [Google Scholar]
- 9.Dimou L, Simons M. Current Opinion in Neurobiology. 2017;47:73–79. doi: 10.1016/j.conb.2017.09.015. [DOI] [PubMed] [Google Scholar]
- 10.Marisca R, et al. Nature Neuroscience. 2020;23:363–374. doi: 10.1038/s41593-019-0581-2. [DOI] [PMC free article] [PubMed] [Google Scholar]
- 11.Sakry D, et al. PLoS Biology. 2014;12:e1001993. doi: 10.1371/journal.pbio.1001993. [DOI] [PMC free article] [PubMed] [Google Scholar]
- 12.Goldberg JL, et al. Journal of Neuroscience. 2004;24:4989–4999. doi: 10.1523/JNEUROSCI.4390-03.2004. [DOI] [PMC free article] [PubMed] [Google Scholar]
- 13.Birey F, et al. Neuron. 2015;88:941–956. doi: 10.1016/j.neuron.2015.10.046. [DOI] [PMC free article] [PubMed] [Google Scholar]
- 14.Kirby BB, et al. Nature Neuroscience. 2006;9:1506–1511. doi: 10.1038/nn1803. [DOI] [PubMed] [Google Scholar]
- 15.Hughes EG, Kang SH, Fukaya M, Bergles DE. Nature Neuroscience. 2013;16:668–676. doi: 10.1038/nn.3390. [DOI] [PMC free article] [PubMed] [Google Scholar]
- 16.Schafer DP, et al. Neuron. 2012;74:691–705. doi: 10.1016/j.neuron.2012.03.026. [DOI] [PMC free article] [PubMed] [Google Scholar]
- 17.Hua JY, Smith SJ. Nature Neuroscience. 2004;7:327–332. doi: 10.1038/nn1218. [DOI] [PubMed] [Google Scholar]
- 18.Meyer MP, Smith SJ. Journal of Neuroscience. 2006;26:3604–3614. doi: 10.1523/JNEUROSCI.0223-06.2006. [DOI] [PMC free article] [PubMed] [Google Scholar]
- 19.Smear MC, et al. Neuron. 2007;53:65–77. doi: 10.1016/j.neuron.2006.12.013. [DOI] [PMC free article] [PubMed] [Google Scholar]
- 20.Roeser T, Baier H. Journal of Neuroscience. 2003;23:3726–3734. doi: 10.1523/JNEUROSCI.23-09-03726.2003. [DOI] [PMC free article] [PubMed] [Google Scholar]
- 21.Robles E, Laurell E, Baier H. Current biology : CB. 2014;24:2085–2096. doi: 10.1016/j.cub.2014.07.080. [DOI] [PubMed] [Google Scholar]
- 22.Filous AR, et al. J Neurosci. 2014;34:16369–16384. doi: 10.1523/JNEUROSCI.1309-14.2014. [DOI] [PMC free article] [PubMed] [Google Scholar]
- 23.Buchanan J, et al. Biorxiv. 2021:2021.05.29.446047. doi: 10.1101/2021.05.29.446047. [DOI] [Google Scholar]
- 24.Lim TK, Ruthazer ES. Elife. 2021;10:e62167. doi: 10.7554/eLife.62167. [DOI] [PMC free article] [PubMed] [Google Scholar]
- 25.Karttunen MJ, Czopka T, Goedhart M, Early JJ, Lyons DA. PLoS ONE. 2017;12:e0178058. doi: 10.1371/journal.pone.0178058. [DOI] [PMC free article] [PubMed] [Google Scholar]
- 26.Auer F, Vagionitis S, Czopka T. Current Biology. 2018;28:549–559.:e3. doi: 10.1016/j.cub.2018.01.017. [DOI] [PubMed] [Google Scholar]
- 27.Vagionitis S, et al. Biorxiv. 2021:2021.06.25.449890. doi: 10.1101/2021.06.25.449890. [DOI] [Google Scholar]
- 28.Pittman AJ, Law M-Y, Chien C-B. Development (Cambridge, England) 2008;135:2865–2871. doi: 10.1242/dev.025049. [DOI] [PMC free article] [PubMed] [Google Scholar]
- 29.Freeman J, et al. Nature Methods. 2014;11:941–950. doi: 10.1038/nmeth.3041. [DOI] [PubMed] [Google Scholar]
- 30.Czopka T, ffrench-Constant C, Lyons DA. Developmental Cell. 2013;25:599–609. doi: 10.1016/j.devcel.2013.05.013. [DOI] [PMC free article] [PubMed] [Google Scholar]
- 31.Nikolaou N, Meyer MP. Neuron. 2015;88:999–1013. doi: 10.1016/j.neuron.2015.10.020. [DOI] [PMC free article] [PubMed] [Google Scholar]
- 32.Kwan KM, et al. Dev Dyn. 2007;236:3088–3099. doi: 10.1002/dvdy.21343. [DOI] [PubMed] [Google Scholar]
- 33.Fredj NB, et al. Journal of Neuroscience. 2010;30:10939–10951. doi: 10.1523/JNEUROSCI.1556-10.2010. [DOI] [PMC free article] [PubMed] [Google Scholar]
- 34.Li L, Jin H, Xu J, Shi Y, Wen Z. Blood. 2011;117:1359–1369. doi: 10.1182/blood-2010-06-290700. [DOI] [PubMed] [Google Scholar]
- 35.Zannino DA, Appel B. Journal of Neuroscience. 2009;29:2322–2333. doi: 10.1523/JNEUROSCI.3755-08.2009. [DOI] [PMC free article] [PubMed] [Google Scholar]
- 36.Štih V, Petrucco L, Kist AM, Portugues R. PLoS computational biology. 2019;15:e1006699. doi: 10.1371/journal.pcbi.1006699. [DOI] [PMC free article] [PubMed] [Google Scholar]
- 37.Portugues R, Engert F. Frontiers in Systems Neuroscience. 2011;5:72. doi: 10.3389/fnsys.2011.00072. [DOI] [PMC free article] [PubMed] [Google Scholar]
- 38.Robles E, Smith SJ, Baier H. Front Neural Circuit. 2011;5:1. doi: 10.3389/fncir.2011.00001. [DOI] [PMC free article] [PubMed] [Google Scholar]
- 39.Meijering E, et al. Cytometry Part A : the journal of the International Society for Analytical Cytology. 2004;58:167–176. doi: 10.1002/cyto.a.20022. [DOI] [PubMed] [Google Scholar]
- 40.Markov DA, Petrucco L, Kist AM, Portugues R. Biorxiv. 2020:2020.02.12.945956. doi: 10.1101/2020.02.12.945956. [DOI] [Google Scholar]
- 41.Gómez P, et al. Sci Data. 2020;7:186. doi: 10.1038/s41597-020-0526-3. [DOI] [PMC free article] [PubMed] [Google Scholar]
- 42.Virtanen P, et al. Nat Methods. 2020;17:261–272. doi: 10.1038/s41592-019-0686-2. [DOI] [PMC free article] [PubMed] [Google Scholar]
- 43.Gahtan E, Tanger P, Baier H. Journal of Neuroscience. 2005;25:9294–9303. doi: 10.1523/JNEUROSCI.2678-05.2005. [DOI] [PMC free article] [PubMed] [Google Scholar]
- 44.Bene FD, et al. Science. 2010;330:669–673. [Google Scholar]
Associated Data
This section collects any data citations, data availability statements, or supplementary materials included in this article.
Supplementary Materials
Data Availability Statement
All data underlying this study will be made available upon reasonable request. Raw data for functional analysis have been deposited at http://doi.org/10.5281/zenodo.5894603
The codes used for running and analyzing behavioral and imaging experiments are available at http://doi.org/10.5281/zenodo.5894770


