

Abstract
About one third of epilepsy patients are pharmacoresistant. Overexpression of P-glycoprotein and other multidrug transporters at the blood-brain barrier is thought to play an important role in drug-refractory epilepsy. Thus, quantification of regionally different P-glycoprotein activity in the brain in vivo is essential to identify P-glycoprotein overactivity as the relevant mechanism for drug-resistance in an individual patient.
Using the radiolabeled P-glycoprotein substrate (R)-[11C]verapamil and different doses of co-administered tariquidar, which is an inhibitor of P-glycoprotein, we evaluated whether small-animal positron emission tomography (PET) can quantify regional changes in transporter function in the rat brain at baseline and 48 h after a pilocarpine-induced status epilepticus. P-glycoprotein expression was additionally quantified by immunohistochemistry. To reveal putative seizure-induced changes in blood-brain barrier integrity, we performed gadolinium-enhanced magnetic resonance scans on a 7.0 Tesla small-animal scanner. Before P-glycoprotein modulation, brain uptake of (R)-[11C]verapamil was low in all regions investigated in control and post-status epilepticus rats. After administration of 3 mg/kg tariquidar, which inhibits P-glycoprotein only partially, we observed increased regional differentiation in brain activity uptake in post-status epilepticus versus control rats, which diminished after maximal P-glycoprotein inhibition. Regional increases in the efflux rate constant k2, but not in distribution volume VT or influx rate constant K1, correlated significantly with increases in P-glycoprotein expression measured by immunohistochemistry.
This imaging protocol proves to be suitable to detect seizure-induced regional changes in P-glycoprotein activity and is readily applicable to humans, with the aim to detect relevant mechanisms of pharmacoresistance in epilepsy in vivo.
Introduction
About one third of patients suffering from epilepsy is pharmacoresistant, i.e. does not respond to an adequate antiepileptic drug therapy (Regesta and Tanganelli, 1999). Among patients with the most frequent epileptic syndrome, i.e. temporal lobe epilepsy, up to 70% are drug-resistant (Kwan and Brodie, 2000). Cumulating evidence suggests that regional overactivity of efflux transporters at the blood-brain barrier (BBB) is one important mechanism contributing to the phenomenon of drug resistance by impeding therapeutically effective concentrations of antiepileptic drugs at their sites of action (“transporter hypothesis”) (Löscher and Potschka, 2005a). P-glycoprotein (Pgp), which is physiologically located at the luminal membrane of brain capillary endothelial cells, is currently the most widely studied multidrug transporter. Increased expression of Pgp has been found in epileptogenic brain specimens resected from patients with intractable epilepsy (Tishler et al., 1995; Lazarowski et al., 1999; Sisodiya et al., 2002). Moreover, status epilepticus (SE) or frequent spontaneous seizures in rodent models led to increased expression of Pgp resulting in decreased brain levels of the antiepileptic drug phenytoin (Rizzi et al., 2002; van Vliet et al., 2007b; Bankstahl and Löscher, 2008), which has been characterized as a Pgp substrate (Potschka and Löscher, 2001; Baltes et al., 2007; Luna-Tortós et al., 2008).
Quantification of Pgp overactivity in epilepsy patients by in vivo imaging would be highly useful because altered treatment strategies, e. g. co-administration of a specific Pgp inhibitor or change-over to a nonsubstrate antiepileptic drug, could then be applied. Up to now, there is no validated diagnostic method which allows for in vivo measurement of regionally different Pgp expression and function at the BBB. Several studies demonstrated that positron emission tomography (PET) with 11C-radiolabeled Pgp substrates, like (R)-[11C]verapamil (VPM), is a promising tool for in vivo investigation of Pgp function at the rat, monkey and human BBB (Langer et al., 2007; Bankstahl et al., 2008; Liow et al., 2009; Seneca et al., 2009). Low brain uptake of high-affinity Pgp substrates such as VPM, however, limits their suitability as PET tracers for mapping regional overexpression in Pgp activity. We tried to overcome this drawback by performing PET scans after partial inhibition of Pgp. This results in sufficient brain activity uptake for PET imaging without complete Pgp blockade (Kuntner et al., 2010). Thus, regionally specific differences in Pgp expression and functionality following SE may become visible. In the present study, we evaluated whether small-animal PET imaging with VPM after partial Pgp inhibition by tariquidar (TQD) can be used to quantify regional changes in transporter function in the injured rat brain.
Methods
Animals
Adult female Sprague-Dawley rats (Harlan Nederland, Horst, Netherlands) were used for all experiments. As in our previous studies on pilocarpine-induced SE in rats, we used female rats, because they are easier to handle after SE and eliminate various drugs considerably more slowly than male rats (Löscher, 2007). The female rats were housed without males in order to keep them acyclic or asynchronous with respect to their estrous cycle (Kücker et al., 2010). We have shown previously that this avoids effects of estrous cycle on seizure susceptibility or severity (Wahnschaffe and Löscher, 1992). Animal housing facilities were kept at a temperature of 22±1°C and a humidity of 40-70%. Rats had ad libitum access to food and water and were kept under a 12 h light/dark cycle. Before being used in the experiments, rats were allowed to adapt to the new conditions for at least one week. The study was approved by the institutional animal care and use committees and all study procedures were performed in accordance with the European Communities Council Directive of November 24, 1986 (86/609/EEC). All efforts were made to minimize both the suffering and the number of animals used in this study.
Chemicals and drugs
Unless otherwise stated, all chemicals were of analytical grade and obtained from Sigma-Aldrich Chemie GmbH (Steinheim, Germany) or Merck (Darmstadt, Germany) and used without further purification. Isoflurane was obtained from Baxter VertriebsGmbH (Vienna, Austria), TQD from Xenova Ltd. (Slough, Berkshire, U.K.), diazepam (Faustan®) from Temmler Pharma GmbH (Marburg, Germany), and dimeglumine gadoterate (Gd-DOTA; Dotarem®) from Guerbet GmbH (Sulzbach, Germany). Lithium chloride, methyl-scopolamine, pilocarpine, Evan’s Blue (EB), and chloral hydrate were dissolved in 0.9% saline. TQD was freshly dissolved on each experimental day in 2.5% aqueous dextrose solution. VPM was synthesized from (R)-norverapamil (ABX advanced biochemical compounds, Radeberg, Germany) and [11C]methyl triflate as described earlier (Brunner et al., 2005).
SE induction
SE was induced by pilocarpine using a fractionated protocol as described in detail elsewhere (Glien et al., 2001). Briefly, the evening before pilocarpine administration, 127 mg/kg lithium chloride were administered orally. Twelve to fourteen hours later, 1 mg/kg methyl-scopolamine was injected intraperitoneally (i.p.) to reduce peripheral adverse effects of pilocarpine. After 30 min, 10 mg/kg pilocarpine was injected i.p. half-hourly until onset of generalized SE. Self sustaining SE was terminated after 90 min by i.p. administration of diazepam (up to 25 mg/kg).
PET experimental procedure
Full details of the PET experimental procedure were described recently (Kuntner et al., 2010). Throughout the whole experimental procedure animals were kept under isoflurane anesthesia. One hour before the first PET scan, each animal was implanted with micro tubes (Kleinfeld, Gehrden, Germany) into the femoral artery and vein to allow repeated arterial blood sampling and administration of TQD and VPM, respectively. After surgery, animals were positioned on a μPET bed (animal cradle from Bruker, BioSpin, Ettlingen, Germany) which was kept at 38°C. A stereotactic holder attached to the bed consisting of ear plugs and a tooth bar was used to fixate the animals’ head to ensure a reproducible position. A μPET Focus220 scanner (Siemens Medical Solutions, Knoxville, TN, USA) was used, which consisted of 168 detector modules providing a 7.6 cm axial and 22 cm transaxial field of view. Reconstructed image resolution (filtered back projection) is 1.3 mm (full-width at half-maximum) in the central field of view and remains under 2 mm within the central 5 cm diameter field of view. Before each baseline PET scan, a transmission scan using a 57Co point source was recorded over 10 min. List mode data were acquired for the defined time period with an energy window of 350-750 keV and 6 ns timing window.
Simultaneously with the first VPM injection a dynamic 60 min PET scan was started. Following this baseline scan, TQD was administered at the half-maximum effective dose (ED50) of 3 mg/kg (Kuntner et al., 2010) to control rats (n=6) and rats that had exhibited a SE 48 h before (post-SE rats; n=6). Additional control (n=6) and post-SE rats (n=5) received 15 mg/kg TQD for complete Pgp inhibition (Kuntner et al., 2010). Two hours after TQD administration the second 60 min PET scan (inhibitor scan) was recorded (Fig 1). During the first 3 min after radiotracer injection, arterial blood samples were continuously taken using pre-weighted 2-μl micropipettes, followed by further 10-μl samples taken at 5, 10, 20, 30, 40 and 60 min after the beginning of the PET scan. Moreover, one blood sample of 600 μl was collected at 20 min (baseline scan) and 60 min (inhibitor scan). Radioactivity in the blood samples was measured in a one-detector Wallac gamma counter (Perkin Elmer Instruments, Wellesley, MA, USA), which was cross-calibrated with the PET camera. The removed blood volume was substituted with approximately the same volume of 0.9% saline containing 20 IE of sodium-heparin. At the end of the inhibitor scan, isoflurane anesthesia was deepened and rats were killed by drawing a terminal blood sample that was centrifuged for 5 min (4000 rpm, 25°C, Rottanta/TRC centrifuge, Hettich, Germany) to obtain plasma. One aliquot of the plasma sample was directly used to assess metabolism of VPM using a previously described solid-phase extraction assay (Luurtsema et al., 2005; Abrahim et al., 2008). Another aliquot was used to quantify plasma concentrations of TQD as described earlier (Wagner et al., 2009).
Figure 1.
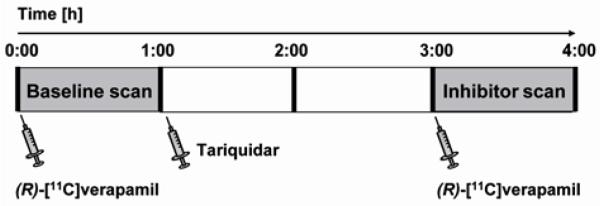
Schematic overview of the study set-up. Following a 60 min baseline PET scan with (R)-[11C]verapamil, the Pgp inhibitor tariquidar was intravenously administered to control rats or rats 48 h post status epilepticus. Two hours later, (R)-[11C]verapamil was injected again and a 60 min inhibitor scan acquired.
PET data analysis
PET data from the 60-min dynamic scans were sorted into 3-dimensional sinograms according to the following frame sequence: 8 × 5 s, 2 × 10 s, 2 × 30 s, 3 × 60 s, 2 × 150 s, 2 × 300 s and 4 × 600 s. PET images were reconstructed by Fourier rebinning of the 3-D sinograms followed by 2-dimensional filtered back projection with a ramp filter resulting in a voxel size of 0.6 × 0.6 × 0.8 mm3. A standard data correction protocol (normalization, attenuation- and decay correction) was applied. A calibration factor for converting units of PET images into absolute radioactivity concentration units was generated by imaging a phantom filled with a known concentration of VPM.
For analysis of PET scans before and after TQD administration, five brain regions of interest (ROIs; cerebellum, frontal motor cortex, corpus striatum, thalamus, and hippocampus) were manually outlined on multiple coronal MR images of a naïve female Sprague-Dawley rat using PMOD (version 2.7.5, PMOD group, Switzerland) and rigidly co-registered with PET images as described in detail recently (Kuntner et al., 2010). ROIs were assigned to the PET images and time-activity curves (TACs), expressed in units of kBq/ml, for the selected brain ROIs were extracted for compartmental modeling. In addition, TACs in individual brain ROIs were normalized to injected radiotracer dose and expressed in units of percent injected dose per gram tissue (%ID/g). From the dose-normalized time activity curves the area under the curve (AUC; in %ID*h/g) was calculated using the OriginPro 7.5G software package (OriginLab Corporation, 350 Northampton, MA, USA).
Kinetic modeling of VPM
Blood activity concentration data were corrected for radioactive decay and converted into plasma concentrations by multiplication with the mean plasma-to-blood activity ratio of all animals at 20 min after tracer injection. As we found no differences in VPM metabolism between control and post-SE rats (see below), metabolite correction derived from 6 control rats was applied to activity concentration data at the 10, 20, 30, 40 and 60-min time points (Kuntner et al., 2010). A 2-tissue 4-rate constant (2T4K; Fig 2) compartment model best fitted the VPM time-activity data in rat brain as described before (Bankstahl et al., 2008). The rate constants K1 and k2 describe exchange of radioactivity between the plasma and the first tissue compartment, whereas k3 and k4 describe exchange of radioactivity between the first fast and the second slow tissue compartment (Fig 2). The used nomenclature is in accordance with the “consensus nomenclature for in vivo imaging” (Innis et al., 2007).
Figure 2.
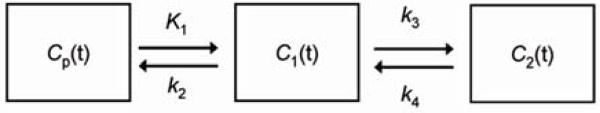
Diagram of the 2-tissue 4 rate-constant (2T4K) compartmental model used for the kinetic modeling of (R)-[11C]verapamil PET data. Cp(t) is the arterial input function; C1(t) and C2(t) describe the radioactivity concentrations in the first and second tissue compartment. The rate constants K1, k2, k3 and k4 describe the exchange of radioactivity between the plasma, the first and the second tissue compartment.
Magnetic resonance imaging
Six further rats underwent T1- and T2-weighted baseline magnetic resonance (MR) scans before and 48 h after SE as well as T1-weighted scans after administration of Gd-DOTA (0.5 mmol/kg, i.v.) to investigate whether severe SE-induced BBB leakage is detectable. MR imaging was conducted on a 7.0 Tesla animal scanner with a 38-mm-volume coil (T10327V3) serving both as transmitter and receiver coil (Pharmascan 70/16, Bruker BioSpin MRI, Ettlingen, Germany). Images of coronal sections were acquired by using a T2-weighted MSME sequence with a 5500 ms repetition time and a 35 ms echo time as well as a T1-weighted MDEFT sequence with a 4000 ms repetition time and a 3.5 ms echo time. The field of view used was 3.5 × 3.5 cm2 with a 256 × 256 matrix. In order to provide detailed anatomical structure a thin slice thickness of 0.8 mm was used.
Assessment of albumin extravasation
EB is highly bound to albumin and can be visualized by fluorescence microscopy, and is therefore used as a marker of albumin uptake into the brain (van Vliet et al., 2007a). To add a more sensitive method for regional assessment of BBB integrity, EB was administered under a short isoflurane anesthesia (50 mg/kg in 4 ml/kg, i.v.) in 6 control rats and 9 rats 48 h post SE. Two hours later, the animals were transcardially perfused under deep chloral hydrate anesthesia with 4% paraformaldehyde in 0.1 M phosphate buffer (pH 7.4). Brains were removed, and 40-μm thick coronal sections were cut on a freezing microtome. Slices were covered using a DAPI-containing mounting medium (Dianova, Hamburg, Germany) to facilitate regional orientation during fluorescence microscopy. Brain regions corresponding to PET ROIs were visually inspected to evaluate potential cellular EB uptake by a blinded experimenter.
Immunohistochemical labeling and computer-assisted quantification of Pgp expression
For immunohistochemical analysis of Pgp expression additional animals (control, n=5; 48 h post-SE, n=8) were sacrificed for staining of Pgp in brain-capillary endothelial cells. We used a previously published protocol to enhance signal-to-noise ratio for quantification of Pgp expression (Bankstahl and Löscher, 2008). Brains were removed immediately, snap frozen in precooled isopentane and stored at −20°C until sectioning. Coronal brain sections (14 μm) at levels of +3.2; −2.3; −3.8; −5.8 and −9.6 mm relative to bregma according to Paxinos and Watson (Paxinos and Watson, 2007) were cut in a cryostat (Microm, Walldorf, Germany) and thaw-mounted on HistoBond® slides (Marienfeld, Lauda-Königshofen, Germany). All sections of one section level were stained simultaneously to reduce staining variability.
Analysis of the Pgp-labeled surface area in DAB-stained sections was performed by a computer-assisted system as described in detail previously (Volk et al., 2004). Depending on the size of each investigated region (cerebellum, frontal motor cortex, corpus striatum, thalamus, and hippocampus, further separated into CA1, CA3, dentate gyrus granule cell layer and dentate hilus), 3-10 fields of 38.321 μm2 were chosen for analysis of Pgp expression. After standardized adjustment of light intensity and definition of a threshold for every region, the area of Pgp-positive labeling relative to the total area of the fields was measured per region and animal. Due to comparison of different brain section levels, results were normalized using the appropriate control group. In analogy to the PET scan analysis, cerebellum, frontal motor cortex, corpus striatum, thalamus, and hippocampal subregions (CA1, CA3, dentate hilus, and dentate gyrus) were chosen as ROIs for analysis. Mean values were calculated for ROIs which were present in multiple section levels. The mean of the hippocampal subregions was taken for the correlation analysis between outcome parameters of kinetic model analysis and Pgp expression.
Statistical analysis
Group differences of all parameters were analyzed by one-way ANOVA followed by two-tailed Student’s t-test using GraphPad Prism 5.0 software (GraphPad software Inc., La Jolla, USA). Pearson correlation coefficients were calculated for analysis of relationship between changes in modeling outcome parameters and Pgp expression. A p-value ≤ 0.05 was considered significant.
Results
Quantification of regional VPM brain uptake by small-animal PET
Before TQD administration, brain uptake was generally low ranging from 1.94% ID*h/g in the hippocampus to 3.50% ID*h/g in the frontal motor cortex. Baseline brain uptake did not differ between groups, except for the cerebellar region of post-SE rats being reduced by 25.3% compared to controls (Fig 4A). Maximal Pgp inhibition with 15 mg/kg (Fig 3 and 4C) resulted in about 5.5 fold increased brain uptake in the cerebellum compared to 12.1 fold increase in the thalamus relative to the baseline scan.
Figure 4.

Areas under the dose-normalized time-activity curves (AUC, %ID*h/g, 0–60 min) in control rats and rats 48 h post status epilepticus (SE) in five brain regions during baseline (A, without tariquidar) or inhibitor scan (B, 2 h after administration of 3 mg/kg tariquidar; C, 2 h after administration of 15 mg/kg tariquidar). Data are shown as mean ± SD. Significant differences between control and post-SE rats are indicated by asterisk (p ≤ 0.05). Cer, cerebellum; FMC, frontal motor cortex; CS, corpus striatum; Th, thalamus; Hipp, hippocampus.
Figure 3.

Coronal, horizontal and sagittal PET summation images (0–60 min) recorded 2 h after administration of tariquidar (3 mg/kg or 15 mg/kg) in control and post-status epilepticus (SE) rats. White arrows indicate obvious differences in brain activity uptake in cerebellum and cortical regions. %ID/g, percent injected dose per gram tissue.
After partial Pgp inhibition with 3 mg/kg (Fig 3 and 4B) cerebellar brain uptake of post-SE rats was decreased by 30.3% compared to controls, whereas brain uptake in the frontal motor cortex was increased by 35.9%. Group differences determined with partial Pgp inhibition in the five investigated ROIs disappeared after maximal Pgp inhibition (15 mg/kg, Fig 3 and 4C). Therefore, this dose level was not further analyzed.
Compartmental modeling of PET data was performed for groups with partial and without Pgp inhibition. Without Pgp modulation by TQD, significant group differences in model outcome parameters were not only observed in the cerebellum but also in the thalamus (Fig 5 and Table 1). A decrease in distribution volume VT and influx rate constant K1 values of 33.2% and 26.8%, respectively, was detected in the cerebellum. In the thalamus, VT was decreased by 20.4%, whereas the efflux rate constant k2 was increased by 39.0%.
Figure 5.

Outcome parameters of kinetic model analysis of PET data for baseline scans (without tariquidar) and inhibitor scans (3 mg/kg tariquidar; A, D distribution volume, VT; B, E influx rate constant, K1; C, F efflux rate constant, k2) of control and post-status epilepticus (SE) rats in five brain regions. Data are shown as mean ± SD. Significant differences between control and post-SE rats are indicated by asterisk (p ≤ 0.05). Cer, cerebellum; FMC, frontal motor cortex; CS, corpus striatum; Th, thalamus; Hipp, hippocampus.
Table 1.
VT, K1, k2, k3 and k4 values derived by compartmental modeling for baseline and inhibitor scans.
| Control | post-SE | ||||||||||
|---|---|---|---|---|---|---|---|---|---|---|---|
| Brain region |
VT (ml- cm−3) |
K1 (ml- cm−3 min−1) |
k2 (min−1) |
k3 (min−1) |
k4 (min−1) |
VT (ml- cm−3) |
K1 (ml- cm−3 min−1) |
k2 (min−1) |
k3 (min−1) |
k4 (min−1) |
|
| Baseline scan | Cere- bellum |
2.23 ±0.40 (5.2) |
0.19 ±0.04 (12.8) |
0.28 ±0.06 (30.1) |
0.11 ±0.05 (35.9) |
0.05 ±0.02 (19.3) |
1.49* ±0.09 (6.2) |
0.14* ±0.02 (13.5) |
0.29 ±0.06 (30.1) |
0.10 ±0.04 (37.2) |
0.05 ±0.02 (19.2) |
| Frontal motor cortex |
2.38 ±0.67 (6.0) |
0.17 ±0.07 (12.3) |
0.22 ±0.09 (33.1) |
0.12 ±0.07 (41.1) |
0.05 ±0.02 (24.3) |
2.04 ±0.37 (6.1) |
0.16 ±0.03 (15.6) |
0.29 ±0.15 (38.8) |
0.14 ±0.09 (44.6) |
0.06 ±0.02 (23.4) |
|
| Corpus striatum |
1.50 ±0.31 (7.8) |
0.11 ±0.03 (15.5) |
0.26 ±0.07 (39.5) |
0.11 ±0.05 (45.2) |
0.04 ±0.02 (25.0) |
1.42 ±0.35 (6.1) |
0.11 ±0.02 (15.8) |
0.29 ±0.09 (38.8) |
0.12 ±0.07 (60.2) |
0.05 ±0.02 (22.5) |
|
| Hippo- campus |
1.28 ±0.15 (6.8) |
0.11 ±0.03 (17.7) |
0.30 ±0.07 (39.1) |
0.12 ±0.04 (49.6) |
0.05 ±0.01 (23.5) |
1.25 ±0.12 (4.9) |
0.13 ±0.02 (23.4) |
0.34 ±0.04 (41.1) |
0.12 ±0.02 (42.4) |
0.05 ±0.01 (18.1) |
|
| Thala- mus |
1.35 ±0.25 (7.9) |
0.11 ±0.01 (18.7) |
0.26 ±0.08 (36.8) |
0.10 ±0.04 (55.2) |
0.05 ±0.01 (35.2) |
1.08* ±0.03 (4.9) |
0.14* ±0.03 (23.2) |
0.37 ±0.08 (43.7) |
0.12 ±0.06 (49.3) |
0.03* ±0.01 (23.6) |
|
| Inhibitor scan | Cere- bellum |
6.14 ±0.54 (3.0) |
0.73 ±0.14 (11.7) |
0.32 ±0.13 (46.3) |
0.30 ±0.08 (76.2) |
0.20 ±0.05 (26.9) |
3.59* ±0.49 (2.6) |
0.43* ±0.05 (16.4) |
0.54* ±0.20 (49.3) |
0.30 ±0.13 (49.3) |
0.10* ±0.04 (23.6) |
| Frontal motor cortex |
7.33 ±0.82 (1.7) |
0.63 ±0.08 (9.5) |
0.24 ±0.05 (49.6) |
0.32 ±0.09 (68.7) |
0.19 ±0.06 (23.8) |
8.69* ±0.70 (2.4) |
0.61 ±0.15 (13.5) |
0.31 ±0.09 (65.7) |
0.39 ±0.10 (63.4) |
0.12 ±0.05 (21.2) |
|
| Corpus striatum |
8.89 ±1.08 (2.7) |
0.79 ±0.13 (10.5) |
0.28 ±0.08 (46.6) |
0.47 ±0.22 (53.4) |
0.22 ±0.06 (23.1) |
9.60 ±0.77 (2.1) |
0.76 ±0.23 (12.1) |
0.38 ±0.15 (53.8) |
0.42 ±0.08 (51.8) |
0.12* ±0.06 (22.0) |
|
| Hippo- campus |
8.17 ±0.91 (2.2) |
0.75 ±0.11 (11.1) |
0.32 ±0.08 (57.9) |
0.43 ±0.09 (69.4) |
0.18 ±0.05 (23.8) |
8.55 ±1.03 (2.3) |
0.74 ±0.19 (16.4) |
0.46* ±0.08 (50.2) |
0.42 ±0.09 (48.3) |
0.10* ±0.04 (17.7) |
|
| Thala- mus |
9.64 ±1.06 (2.0) |
0.93 ±0.12 (9.0) |
0.33 ±0.18 (48.8) |
0.47 ±0.11 (64.4) |
0.23 ±0.06 (23.6) |
7.81* ±0.95 (2.4) |
0.85 ±0.21 (14.7) |
0.54* ±0.06 (41.4) |
0.39 ±0.07 (37.0) |
0.10* ±0.03 (13.6) |
|
Values are given as mean ± SD. Significant differences between control and post-SE rats are indicated by asterisk (p ≤ 0.05). The value in parentheses represents the precision of parameter estimates (expressed as their coefficient of variation in percent), averaged over all rats per group.
Following partial Pgp inhibition, group differences became more apparent both in terms of number and extent (Fig 5 and Table 1). We detected VT decreases in cerebellum (−41.5%) and thalamus (−19.0%) of post-SE rats. In contrast, we found a VT increase of 18.6% in the frontal motor cortex. The influx rate constant K1 reflected the VT group differences only in the cerebellum in terms of a 41.0% decrease of post-SE rats. The K1 values of the four other brain regions were comparable. It is noteworthy that regional K1 values after 3 mg/kg TQD were well below rates of regional cerebral blood flow (CBF) in brain tissue of naïve rats under isoflurane anesthesia (e.g. regional cerebral blood flow approximately 3.5, 4.1 and 5.5 ml g−1 min−1 in hippocampus, cortex and thalamus, respectively (Hendrich et al., 2001)) indicating that in individual brain regions functional Pgp activity was still present to limit the extraction of VPM. Importantly, partial Pgp inhibition resulted in markedly increased k2 values in cerebellum (+70.7%), thalamus (+64.5%), and hippocampus (+46.6%) of post-SE rats as compared to control rats. Analysis of k3 values did not reveal any group differences between control and post SE rats neither with nor without Pgp inhibition, whereas a global decrease of k4 was observed in post SE rats following partial Pgp inhibition. Nevertheless, partial Pgp inhibition led to globally increased k3 values both in control and post SE rats (Table 1).
VPM metabolism did not differ significantly between control and post-SE rats. At 20 min after tracer injection during baseline scan, the percentage of unchanged VPM and its lipophilic [11C]metabolites was 66.1±3.9% (n=5) in control rats and 70.7±4.0% (n=6) in post-SE rats. At the end of the inhibitor scan (3 mg/kg TQD) these values amounted to 70.5±13.1% and 77.0±6.3%, respectively. Plasma levels of TQD at 180 min after administration of the 3 mg/kg dose were higher in post-SE rats (0.718 ± 0.074 mg/ml) as compared to control rats (0.537 ± 0.090 mg/ml).
Quantification of Pgp expression by immunohistochemistry
Pgp was only stained in brain capillary endothelial cells but neither in neurons nor in astroglia under the conditions of the immunohistochemical protocol used for this study. Fig 6A illustrates representative immunohistochemical Pgp stainings in cerebellar (a-b), thalamic (c-d) and hippocampal (e-f) brain-capillary endothelial cells illustrating a clear SE-induced increase of Pgp-labeled area. The Pgp-labeled area was significantly higher in the cerebellum (+75.9%), thalamus (+39.7%), CA1 (+51.5%), CA3 (+64.7%), and dentate gyrus (+45.0%), but remained unchanged in the other investigated regions (Fig 6B). The increased regional expression of Pgp determined by immunohistochemistry perfectly matched the increased efflux rate constant k2 values determined by PET (compare Fig 5F and Table 2). A correlation analysis between SE-induced increases in Pgp expression and in outcome parameters of kinetic model analysis reached significance only for k2 values after partial Pgp inhibition (r2=0.80; p=0.04; Fig 6C).
Figure 6.

(A) Representative examples of immunostained brain sections of a control rat (a, c, e) and a rat 48 h post status epilepticus (SE; b, d, f). Pgp expression is shown in brain capillaries of 3rd cerebellar lobule (a, b), thalamus (c, d) and hippocampus (e, f). Scale bar in f indicates 50 μm. (B) Pgp expression in endothelial cells of rat brain capillaries in cerebellum (Cer; −9.6 mm relative to bregma, according to Paxinos and Watson (2007)), frontal motor cortex (FMC; +3.2 mm), corpus striatum (CS; −2.3 mm), thalamus (Th; −2.3 mm), and hippocampal subregions (CA1, CA3, dentate gyrus (DG), dentate hilus (Hil); data are means of three analyzed brain levels (−2.3, −3.8, −5.8 mm)) of control and post-status epilepticus (SE) rats. Data are shown as mean ± SD. Significant differences between control and post-SE rats are indicated by asterisk (p ≤ 0.05). (C) Correlation between SE-induced changes in Pgp expression and changes in compartmental-model derived efflux rate constant k2 relative to control group in five different brain regions after partial Pgp inhibition. The dashed line indicates the best fit. P-value and squared Pearson correlation coefficient (r2) are indicated in the graph.
Table 2.
Summary of statistically significant SE-induced changes in Pgp outcome parameters of kinetic model analysis of PET data (before and after partial Pgp inhibition) and in Pgp expression (as determined by immunohistochemistry).
| Baseline scan | Inhibitor scan | ||||||
|---|---|---|---|---|---|---|---|
| Region of interest | V T | K 1 | k 2 | V T | K 1 | k 2 | Pgp expression |
| Cerebellum | ⇩ | ⇩ | n.s. | ⇩ | ⇩ | ⇧ | ⇧ |
| Frontal motor cortex | n.s. | n.s. | n.s. | ⇧ | n.s. | n.s. | n.s. |
| Corpus striatum | n.s. | n.s. | n.s. | n.s. | n.s. | n.s. | n.s. |
| Thalamus | ⇩ | n.s. | ⇧ | ⇩ | n.s. | ⇧ | ⇧ |
| Hippocampus | n.s. | n.s. | n.s. | n.s. | n.s. | ⇧ | ⇧ |
VT, distribution volume; K1, influx rate constant; k2, efflux rate constant; n.s., not significant.
MR imaging with Gd-DOTA as contrast agent
This was performed in 6 rats before and 48 h after SE. Figure 7A exemplarily shows T1-weighted MR images of an individual rat in which the choroid plexus and pituitary gland were the only regions with an obviously enhanced signal after Gd-DOTA injection. These observations suggest that there was no major leakage of BBB that may explain the observed group differences in brain activity uptake in the PET experiments after SE. This conclusion is substantiated by the fact that, following complete Pgp inhibition by TQD, VPM uptake into the brain did not differ between controls and post SE rats (Fig. 4C). However, as shown in Figure 7A, T2-weighted images post SE reveal a striking signal enhancement in hippocampus and piriform cortex as well as clearly reduced cerebrospinal fluid space, which was due to cell edema, indicating severe pathological changes in the brain after SE.
Figure 7.

(A) Coronal T2- and T1-weighted MR images before (upper images) and 48 h post status epilepticus (SE; lower images). The T2-weighted image post-SE illustrates most pronounced signal enhancement in hippocampus and piriform cortex (arrowheads), whereas the T1-weighted image shows reduced CSF space, both indicating cell edema. The third column shows T1-weighted scans after a gadolinium (Gd)-DOTA bolus injection. Post-Gd images show enhancement in the choroid plexus and pituitary gland (arrows) but no hyperintensity in the hippocampus or other brain regions, suggesting that there is no substantial SE-induced blood–brain barrier leakage. (B) Evan’s Blue (EB) extravasation: In control rats (left), no EB fluorescence was observed microscopically. Uptake of EB in post SE rats (right) in polymorphic neurons of the dentate hilus is exemplarily shown.
Assessment of albumin extravasation
This was performed in 6 controls and 9 rats 48 h after SE. In part of the SE rats, the visual inspection of brain sclices resulted in differentially pronounced red fluorescence in neurons of the dentate hilus, CA1, and CA3, as well as in thalamic subregions but not in cerebellum, frontal motor cortex or corpus striatum. Striking interindividual differences were found: One rat showed a high amount of fluorescent neurons and circumscribed extracellular fluorescence in hippocampal and thalamic subregions, in five rats intraneuronal fluorescence was found in the same brain regions but in lower extent (Fig 7B), and in three SE rats no fluorescence at all was detected. Albumin extravasation did not occur in any of control animals.
Discussion
Using a novel imaging protocol composed of VPM PET scans after half-maximal Pgp inhibition by TQD in control rats and rats 48 h after SE, we were able to quantify group differences in regional Pgp function. This is the first study investigating Pgp activity with VPM PET in rats after a severe brain insult that can lead to development of epilepsy in animal models as well as in humans. We also demonstrate that changes in outcome parameters of kinetic model analysis correlate with disease-induced changes in Pgp expression.
Our major findings are: firstly, following partial Pgp inhibition, the extent and number of SE-induced group differences within outcome parameters of kinetic model analysis clearly increased; secondly, changes in Pgp function are notably mirrored both by changes in the efflux rate constant k2 and Pgp expression levels, which correlate significantly; thirdly, increased Pgp expression and activity after SE occurs not only in primary epileptogenic regions like the hippocampus, but also in the thalamus and the cerebellum.
Seizure-induced overexpression of Pgp
As accessibility to brain tissue of epilepsy patients is very limited, animal models are mandatory tools for studying mechanisms of pharmacoresistant epilepsy (Löscher and Potschka, 2005a) and essential for the neurobiological evaluation of imaging protocols. By using Pgp immunohistochemistry, we recently demonstrated an increase in Pgp expression at the BBB of rats 48 h post SE in hippocampal subregions (Bankstahl and Löscher, 2008), which we extended to brain regions that are often not the focus in basic epilepsy research. Importantly, we and others found decreased brain levels of the anticonvulsive Pgp substrate phenytoin in parallel with increased Pgp protein or Mdr1 mRNA levels shortly after SE as well as in chronically epileptic animals (Rizzi et al., 2002; van Vliet et al., 2007b; Bankstahl and Löscher, 2008), further supporting the assumption that the detected overexpression of Pgp has functional consequences. It has been hypothesized that Pgp overexpression could also be induced by prolonged SE in humans (Sisodiya and Thom, 2003; Iannetti et al., 2005; Bankstahl and Löscher, 2008). In apparent line with this possibility, co-administration of verapamil acting as competitive Pgp inhibitor reversed resistance to phenobarbital or phenytoin in two patients with long-lasting refractory SE (Iannetti et al., 2005; Schmitt et al., 2007).
Imaging changes in Pgp function
A new study design: VPM-PET after half-maximal inhibition of Pgp
Since Pgp overexpression in the epileptic focus region is considered as one important mechanism of pharmacoresistance in epilepsy patients (Löscher and Potschka, 2005b), a validated method for in vivo detection of regionally increased Pgp activity would be a valuable tool for predicting the individual risk of an epilepsy patient not responding to pharmacological treatment with antiepileptic drugs that are Pgp substrates. Although several radiotracers have been used to image cerebral Pgp function (Zoghbi et al., 2008; Syvänen et al., 2009; Kreisl et al., 2010; la Fougère et al., 2010), radiolabeled verapamil is still the most widely studied one (Pike, 2009). However, because VPM is a high-affinity Pgp substrate, its brain uptake is very low, so that small differences in regional Pgp activity cannot easily be measured with this radiotracer (Kuntner et al., 2010). As complete transporter inhibition would result in VPM brain uptake driven by passive diffusion only partial Pgp inhibition before tracer administration could be an encouraging paradigm. Therefore, we used the half maximum dose (ED50) of the third generation Pgp inhibitor TQD (Kuntner et al., 2010).
Regional changes in Pgp function
In line with our hypothesis, no AUC group differences could be detected after complete Pgp inhibition (15 mg/kg TQD), i.e., the efflux transporter was chemically “knocked-out” resulting in equally high tracer uptake in all analyzed brain regions (Fig 4C). Additionally, prior to Pgp modulation, we observed low brain uptake of radioactivity, demonstrated by low VT values for both groups of rats (Fig 5A). The cerebellar decrease in VT and influx rate constant K1 48 h post-SE seen in the baseline scans could be interpreted as very high Pgp activity in this brain region. This interpretation is supported by our immunohistological results, in which increase in Pgp expression after SE was highest in the cerebellum (Fig 6B). Moreover, in scans after half-maximal Pgp inhibition an even more pronounced cerebellar decrease in VT and K1 and an increase in the efflux rate constant k2 could be observed in 48 h post-SE rats, again pointing to an increased transporter activity in cerebellum (Fig 5). This was the case despite the fact that the increased TQD levels measured in the post-SE rats would act in the opposite direction.
Reduced influx or increased efflux?
Increased expression of Pgp at the BBB would be expected to increase the efflux of Pgp substrates from the brain (Löscher and Potschka, 2005a). SE-induced increase in Pgp expression was indeed associated with significant changes of kinetic modeling parameters in affected brain regions. K1 and k2 describe exchange of radioactivity at the luminal membrane of the BBB. The second, deeper compartment described by k3 and k4 is seen only after Pgp inhibition (Bankstahl et al., 2008; Wagner et al., 2009), but the distinct physiological correlate remains unclear so far.
Among all calculated PET parameters, k2 values after partial Pgp inhibition in post-SE rats correlated best with the immunohistological data (Fig 6F). It is still a matter of debate which of the two rate constants for transport of Pgp-substrate tracers across the BBB is most affected by changes in Pgp function.
Two different modes of action for Pgp have been suggested, i.e. influx hindrance (resulting in low K1) and efflux enhancement (resulting in high k2). Firstly, a vacuum cleaner model has been suggested (Higgins and Gottesman, 1992), resulting in influx hindrance. In this model substrates are transported back from the lipid layers of the luminal cell membrane into the blood before they reach the cytoplasm. Secondly, substrates could be transported from the cytoplasm into the blood. It has also been suggested that Pgp may act by both mechanisms simultaneously (Stein et al., 1994; Sharom, 1997; Higgins and Linton, 2004). Before Pgp inhibition, brain uptake of VPM is very low which consequently results in low influx and efflux rate constants (K1, k2). Probably, most VPM does not reach the cytoplasm and is directly transported back into the blood. However, following partial Pgp inhibition, a considerable amount of VPM enters the first compartment of the brain and is only then sufficiently available for efflux out of the brain by the second mode of action. This could finally lead to an increase in efflux rate k2, as observed in this study, despite partial inhibition of Pgp.
In this respect, it is interesting to note that several previous studies in healthy volunteers or rats found that pharmacological inhibition of Pgp caused an increase in the influx rate constant K1 but no change in the k2 parameter (Liow et al., 2009; Muzi et al., 2009; Wagner et al., 2009; Kreisl et al., 2010; Kuntner et al., 2010). However, Bauer et al. (2009) showed that age-dependent increase in VPM VT in healthy subjects was mirrored by a decrease in k2, but not by an increase in K1. In patients suffering from drug-resistant unilateral temporal lobe epilepsy, Langer et al. (2007) found increases in VPM k2 ipsilateral to the epileptic focus. Hence, for translation of our paradigm to epilepsy patients both influx and efflux rate constants should be taken into account.
Possible limitations: CBF and integrity of the BBB
On the one hand, the unexpected absence of decreased VT values in hippocampus could to some extent be due to spillover of radioactivity from adjacent structures like choroid plexus, which showed high radioactivity uptake as it was also reported for human subjects (Langer et al., 2007). On the other hand, it cannot be ruled out that part of the differences between control and post-SE rats is related to regional changes in CBF after SE. However, given the magnitude of the differences and their correlation with regional Pgp expression levels it seems unlikely that these changes were only related to CBF. As regions with higher blood flow would have greater radioactivity uptake this could at least partially explain why increased hippocampal Pgp levels after SE did not result in decreased VT of VPM after partial Pgp inhibition in our study. Notably, a recent study by Choy et al. (2010) revealed clear increases of CBF in hippocampus two days after pilocarpine-induced SE. Unfortunately, only one additional brain region corresponding to our ROIs, i.e. thalamus, was investigated in this study, without finding SE-mediated changes in CBF (Choy et al., 2010). Additional studies are needed to reveal possible flow dependency of VPM uptake in further brain regions.
To clarify whether changes in activity uptake in post-SE rats may be dependent on transient opening of the BBB, rather then on differences in Pgp activity, we performed T1-weighted MRI scans after injection of Gd-DOTA, which is a paramagnetic MRI contrast agent used routinely for evaluation of BBB lesions in human patients. In our study, T1-weighted MR scans after Gd-DOTA injection did not reveal major BBB breakdown in any ROI as exemplarily shown in Figure 7A. This is in line with previous MR imaging studies in which no or only circumscribed breakdown of BBB 2-3 h after SE in rodents has been described (Bouilleret et al., 2000; Roch et al., 2002; Hsu et al., 2007; Immonen et al., 2008), which disappeared 6 h to 24 h after SE (Roch et al., 2002; Immonen et al., 2008). Furthermore, low VT values in VPM baseline scans without marked regional differentiation argue against unselective BBB opening (Fig 5A).
A recent study detected increased permeability of the rat BBB after SE and spontaneous recurrent seizures, measured by uptake of fluorescence-labeled albumin into the brain (van Vliet et al., 2007a). In line with the results of this study, we found limited uptake of EB, a marker of albumin uptake, in two of the five PET ROIs, i.e. hippocampus and thalamus and only in 66% of post SE rats. Our finding that, following “chemical knockout” of Pgp by TQD, VPM uptake is the same in controls and SE rats (Fig. 4C) also argues against any severe impairment of the BBB 48 h following SE.
Future directions
In summary, we established a VPM small-animal PET protocol which is suitable to quantify changes in Pgp activity in distinct brain regions after a brain insult that often leads to epilepsy in humans. Two recent pilot studies in healthy volunteers indicate that the PET paradigm described in this paper could be translated to human subjects (Wagner et al., 2009; Bauer et al., 2010). Our protocol is currently used to analyze regional Pgp activity in pharmacoresistant rats and will be expanded to epilepsy patients. Hopefully, it may ultimately serve as a predictive tool for detection of Pgp-mediated pharmacoresistance in epilepsy.
Acknowledgements
We are grateful to Dr. Joan Abbott, Dr. Alexander Hammers and Dr. Matthias Koepp for critical reading of the manuscript and helpful suggestions. The authors thank Gloria Stundner (Austrian Institute of Technology GmbH), Dr. Thomas Fillip, and Maria Zsebedics (Seibersdorf Laboratories GmbH) for their skilful assistance with animal handling and Severin Mairinger, Bernd Dörner, and Florian Bauer as well as the staff of the radiochemistry laboratory (Seibersdorf Laboratories GmbH) for their continuous support. Thomas Flanitzer is gratefully acknowledged for help with data analysis and Dr. Rudolf Karch for advice on compartmental modeling issues.
This work was supported by funding from the European Community’s Seventh Framework programme (FP7/2007-2013) under grant agreement number 201380 (“Euripides”) and from the Austrian Science Fund (FWF) project “Transmembrane Transporters in Health and Disease” (SFB F35)
Footnotes
The authors state no conflict of interest.
References
- Abrahim A, Luurtsema G, Bauer M, Karch R, Lubberink M, Pataraia E, Joukhadar C, Kletter K, Lammertsma AA, Baumgartner C, Müller M, Langer O. Peripheral metabolism of (R)-[C-11]verapamil in epilepsy patients. Eur J Nucl Med Mol Imaging. 2008;35:116–123. doi: 10.1007/s00259-007-0556-5. [DOI] [PubMed] [Google Scholar]
- Baltes S, Gastens AM, Fedrowitz M, Potschka H, Kaever V, Löscher W. Differences in the transport of the antiepileptic drugs phenytoin, levetiracetam and carbamazepine by human and mouse P-glycoprotein. Neuropharmacology. 2007;52:333–346. doi: 10.1016/j.neuropharm.2006.07.038. [DOI] [PubMed] [Google Scholar]
- Bankstahl JP, Löscher W. Resistance to antiepileptic drugs and expression of P-glycoprotein in two rat models of status epilepticus. Epilepsy Res. 2008;82:70–85. doi: 10.1016/j.eplepsyres.2008.07.007. [DOI] [PubMed] [Google Scholar]
- Bankstahl JP, Kuntner C, Abrahim A, Karch R, Stanek J, Wanek T, Wadsak W, Kletter K, Müller M, Löscher W, Langer O. Tariquidar-induced P-glycoprotein inhibition at the rat blood-brain barrier studied with (R)-C-11-verapamil and PET. J Nucl Med. 2008;49:1328–1335. doi: 10.2967/jnumed.108.051235. [DOI] [PMC free article] [PubMed] [Google Scholar]
- Bauer M, Karch R, Neumann F, Abrahim A, Wagner CC, Kletter K, Müller M, Zeitlinger M, Langer O. Age dependency of cerebral P-gp function measured with (R)-[C-11]verapamil and PET. Eur J Clin Pharmacol. 2009;65:941–946. doi: 10.1007/s00228-009-0709-5. [DOI] [PMC free article] [PubMed] [Google Scholar]
- Bauer M, Karch R, Neumann F, Wagner CC, Kletter K, Müller M, Löscher W, Zeitlinger M, Langer O. Assessment of regional differences in tariquidar-induced P-glycoprotein modulation at the human blood-brain barrier. J Cereb Blood Flow Metab. 2010;30:510–515. doi: 10.1038/jcbfm.2009.265. [DOI] [PMC free article] [PubMed] [Google Scholar]
- Bouilleret V, Nehlig A, Marescaux C, Namer IJ. Magnetic resonance imaging follow-up of progressive hippocampal changes in a mouse model of mesial temporal lobe epilepsy. Epilepsia. 2000;41:642–650. doi: 10.1111/j.1528-1157.2000.tb00223.x. [DOI] [PubMed] [Google Scholar]
- Brunner M, Langer O, Sunder-Plassmann R, Dobrozemsky G, Müller U, Wadsak W, Krcal A, Karch R, Mannhalter C, Dudczak R, Kletter K, Steiner I, Baumgartner C, Müller M. Influence of functional haplotypes in the drug transporter gene ABCB1 on central nervous system drug distribution in humans. Clin Pharmacol Ther. 2005;78:182–190. doi: 10.1016/j.clpt.2005.04.011. [DOI] [PubMed] [Google Scholar]
- Choy M, Cheung KK, Thomas DL, Gadian DG, Lythgoe MF, Scott RC. Quantitative MRI predicts status epilepticus-induced hippocampal injury in the lithium-pilocarpine rat model. Epilepsy Res. 2010;88:221–230. doi: 10.1016/j.eplepsyres.2009.11.013. [DOI] [PubMed] [Google Scholar]
- Glien M, Brandt C, Potschka H, Voigt H, Ebert U, Löscher W. Repeated low-dose treatment of rats with pilocarpine: low mortality but high proportion of rats developing epilepsy. Epilepsy Res. 2001;46:111–119. doi: 10.1016/s0920-1211(01)00272-8. [DOI] [PubMed] [Google Scholar]
- Hendrich KS, Kochanek PM, Melick JA, Schiding JK, Statler KD, Williams DS, Marion DW, Ho C. Cerebral perfusion during anesthesia with fentanyl, isoflurane, or pentobarbital in normal rats studied by arterial spin-labeled MRI. Magn Reson Med. 2001;46:202–206. doi: 10.1002/mrm.1178. [DOI] [PubMed] [Google Scholar]
- Higgins CF, Gottesman MM. Is the multidrug transporter a flippase. Trends Biochem Sci. 1992;17:18–21. doi: 10.1016/0968-0004(92)90419-a. [DOI] [PubMed] [Google Scholar]
- Higgins CF, Linton KJ. The ATP switch model for ABC transporters. Nat Struct Mol Biol. 2004;11:918–926. doi: 10.1038/nsmb836. [DOI] [PubMed] [Google Scholar]
- Hsu YH, Lee WT, Chang C. Multiparametric MRI evaluation of kainic acid-induced neuronal activation in rat hippocampus. Brain. 2007;130:3124–3134. doi: 10.1093/brain/awm207. [DOI] [PubMed] [Google Scholar]
- Iannetti P, Spalice A, Parisi P. Calcium-channel blocker verapamil administration in prolonged and refractory status epilepticus. Epilepsia. 2005;46:967–969. doi: 10.1111/j.1528-1167.2005.59204.x. [DOI] [PubMed] [Google Scholar]
- Immonen RJ, Kharatishvili I, Sierra A, Einula C, Pitkanen A, Grohn OHJ. Manganese enhanced MRI detects mossy fiber sprouting rather than neurodegeneration, gliosis or seizure-activity in the epileptic rat hippocampus. Neuroimage. 2008;40:1718–1730. doi: 10.1016/j.neuroimage.2008.01.042. [DOI] [PubMed] [Google Scholar]
- Innis RB, et al. Consensus nomenclature for in vivo imaging of reversibly binding radioligands. J Cereb Blood Flow Metab. 2007;27:1533–1539. doi: 10.1038/sj.jcbfm.9600493. [DOI] [PubMed] [Google Scholar]
- Kreisl WC, Liow J-S, Kimura N, Seneca N, Zoghbi SS, Morse CL, Herscovitch P, Pike VW, Innis RB. P-glycoprotein function at the blood-brain barrier in humans can be quantified with the substrate radiotracer 11C-N-desmethyl-loperamide. J Nucl Med. 2010;51:559–566. doi: 10.2967/jnumed.109.070151. [DOI] [PMC free article] [PubMed] [Google Scholar]
- Kücker S, Töllner K, Piechotta M, Gernert M. Kindling as a model of temporal lobe epilepsy induces bilateral changes in spontaneous striatal activity. Neurobiol Dis. 2010;37:661–672. doi: 10.1016/j.nbd.2009.12.002. [DOI] [PubMed] [Google Scholar]
- Kuntner C, Bankstahl JP, Bankstahl M, Stanek J, Wanek T, Stundner G, Karch R, Brauner R, Meier M, Ding X, Müller M, Löscher W, Langer O. Dose-response assessment of tariquidar and elacridar and regional quantification of P-glycoprotein inhibition at the rat blood-brain barrier using (R)-[11C]verapamil PET. Eur J Nucl Med Mol Imaging. 2010;37:942–953. doi: 10.1007/s00259-009-1332-5. [DOI] [PMC free article] [PubMed] [Google Scholar]
- Kwan P, Brodie MJ. Early identification of refractory epilepsy. N Engl J Med. 2000;342:314–319. doi: 10.1056/NEJM200002033420503. [DOI] [PubMed] [Google Scholar]
- la Fougère C, Boning G, Bartmann H, Wangler B, Nowak S, Just T, Wagner E, Winter P, Rominger A, Forster S, Gildehaus F-J, Rosa-Neto P, Minuzzi L, Bartenstein P, Potschka H, Cumming P. Uptake and binding of the serotonin 5-HT1A antagonist [18F]-MPPF in brain of rats: effects of the novel P-glycoprotein inhibitor tariquidar. Neuroimage. 2010;49:1406–1415. doi: 10.1016/j.neuroimage.2009.09.048. [DOI] [PubMed] [Google Scholar]
- Langer O, Bauer M, Hammers A, Karch R, Pataraia E, Koepp MJ, Abrahim A, Luurtsema G, Brunner M, Sunder-Plassmann R, Zimprich F, Joukhadar C, Gentzsch S, Dudczak R, Kletter K, Müller M, Baumgartner C. Pharmacoresistance in epilepsy: A pilot PET study with the p-glycoprotein substrate R-[C-11]verapamil. Epilepsia. 2007;48:1774–1784. doi: 10.1111/j.1528-1167.2007.01116.x. [DOI] [PubMed] [Google Scholar]
- Lazarowski A, Sevlever G, Taratuto A, Massaro M, Rabinowicz A. Tuberous sclerosis associated with MDR1 gene expression and drug-resistant epilepsy. Pediatr Neurol. 1999;21:731–734. doi: 10.1016/s0887-8994(99)00074-0. [DOI] [PubMed] [Google Scholar]
- Liow JS, Kreisl W, Zoghbi SS, Lazarova N, Seneca N, Gladding RL, Taku A, Herscovitch P, Pike VW, Innis RB. P-glycoprotein function at the blood-brain barrier imaged using C-11-N-desmethyl-loperamide in monkeys. J Nucl Med. 2009;50:108–115. doi: 10.2967/jnumed.108.056226. [DOI] [PMC free article] [PubMed] [Google Scholar]
- Löscher W. The pharmacokinetics of antiepileptic drugs in rats: Consequences for maintaining effective drug levels during prolonged drug administration in rat models of epilepsy. Epilepsia. 2007;48:1245–1258. doi: 10.1111/j.1528-1167.2007.01093.x. [DOI] [PubMed] [Google Scholar]
- Löscher W, Potschka H. Drug resistance in brain diseases and the role of drug efflux transporters. Nature Reviews Neuroscience. 2005a;6:591–602. doi: 10.1038/nrn1728. [DOI] [PubMed] [Google Scholar]
- Löscher W, Potschka H. Role of drug efflux transporters in the brain for drug disposition and treatment of brain diseases. Prog Neurobiol. 2005b;76:22–76. doi: 10.1016/j.pneurobio.2005.04.006. [DOI] [PubMed] [Google Scholar]
- Luna-Tortós C, Fedrowitz M, Löscher W. Several major antiepileptic drugs are substrates for human P-glycoprotein. Neuropharmacology. 2008;55:1364–1375. doi: 10.1016/j.neuropharm.2008.08.032. [DOI] [PubMed] [Google Scholar]
- Luurtsema G, Molthoff CFM, Schuit RC, Windhorst AD, Lammertsma AA, Franssen EJF. Evaluation of (R)-[C-11]verapamil as PET tracer of P-glycoprotein function in the blood-brain barrier: kinetics and metabolism in the rat. Nucl Med Biol. 2005;32:87–93. doi: 10.1016/j.nucmedbio.2004.06.007. [DOI] [PubMed] [Google Scholar]
- Muzi M, Mankoff DA, Link JM, Shoner S, Collier AC, Sasongko L, Unadkat JD. Imaging of cyclosporine inhibition of P-glycoprotein activity using 11C-verapamil in the brain: studies of healthy humans. J Nucl Med. 2009;50:1267–1275. doi: 10.2967/jnumed.108.059162. [DOI] [PMC free article] [PubMed] [Google Scholar]
- Paxinos G, Watson C. The rat brain in stereotaxic coordinates. Academic Press; Sydney: 2007. [DOI] [PubMed] [Google Scholar]
- Pike VW. PET radiotracers: crossing the blood-brain barrier and surviving metabolism. Trends Pharmacol Sci. 2009;30:431–440. doi: 10.1016/j.tips.2009.05.005. [DOI] [PMC free article] [PubMed] [Google Scholar]
- Potschka H, Löscher W. In vivo evidence for P-glycoprotein-mediated transport of phenytoin at the blood-brain barrier of rats. Epilepsia. 2001;42:1231–1240. doi: 10.1046/j.1528-1157.2001.01901.x. [DOI] [PubMed] [Google Scholar]
- Regesta G, Tanganelli P. Clinical aspects and biological bases of drug-resistant epilepsies. Epilepsy Res. 1999;34:109–122. doi: 10.1016/s0920-1211(98)00106-5. [DOI] [PubMed] [Google Scholar]
- Rizzi M, Caccia S, Guiso G, Richichi C, Gorter JA, Aronica E, Aliprandi M, Bagnati R, Fanelli R, D’Incalci M, Samanin R, Vezzani A. Limbic seizures induce P-glycoprotein in rodent brain: Functional implications for pharmacoresistance. J Neurosci. 2002;22:5833–5839. doi: 10.1523/JNEUROSCI.22-14-05833.2002. [DOI] [PMC free article] [PubMed] [Google Scholar]
- Roch C, Leroy C, Nehlig A, Namer IJ. Magnetic resonance imaging in the study of the lithium-pilocarpine model of temporal lobe epilepsy in adult rats. Epilepsia. 2002;43:325–335. doi: 10.1046/j.1528-1157.2002.11301.x. [DOI] [PubMed] [Google Scholar]
- Schmitt FC, Merschhemke M, Dehnicke C, Meencke H. Status epilepticus with tonic seizures in nonlesional epilepsy: multidrug transporter inhibitor (verapamil) attenuates malignant treatment course. Epilepsia. 2007;48:103–109. [Google Scholar]
- Seneca N, Zoghbi SS, Liow JS, Kreisl W, Herscovitch P, Jenko K, Gladding RL, Taku A, Pike VW, Innis RB. Human brain imaging and radiation dosimetry of C-11-N-desmethyl-loperamide, a PET radiotracer to measure the function of P-glycoprotein. J Nucl Med. 2009;50:807–813. doi: 10.2967/jnumed.108.058453. [DOI] [PMC free article] [PubMed] [Google Scholar]
- Sharom FJ. The P-glycoprotein efflux pump: How does it transport drugs? J Membr Biol. 1997;160:161–175. doi: 10.1007/s002329900305. [DOI] [PubMed] [Google Scholar]
- Sisodiya SM, Thom M. Widespread upregulation of drug-resistance proteins in fatal human status epilepticus. Epilepsia. 2003;44:261–264. doi: 10.1046/j.1528-1157.2003.42802.x. [DOI] [PubMed] [Google Scholar]
- Sisodiya SM, Lin WR, Harding BN, Squier MV, Thom M. Drug resistance in epilepsy: Expression of drug resistance proteins in common causes of refractory epilepsy. Brain. 2002;125:22–31. doi: 10.1093/brain/awf002. [DOI] [PubMed] [Google Scholar]
- Stein WD, Cardarelli C, Pastan I, Gottesman MM. Kinetic evidence suggesting that the multidrug transporter differentially handles influx and efflux of its substrates. Mol Pharmacol. 1994;45:763–772. [PubMed] [Google Scholar]
- Syvänen S, Lindhe O, Palner M, Kornum BR, Rahman O, Langstrom B, Knudsen GM, Hammarlund-Udenaes M. Species differences in blood-brain barrier transport of three positron emission tomography radioligands with emphasis on P-glycoprotein transport. Drug Metabolism and Disposition. 2009;37:635–643. doi: 10.1124/dmd.108.024745. [DOI] [PubMed] [Google Scholar]
- Tishler DM, Weinberg KI, Hinton DR, Barbaro N, Annett GM, Raffel C. Mdr1 gene-expression in brain of patients with medically intractable epilepsy. Epilepsia. 1995;36:1–6. doi: 10.1111/j.1528-1157.1995.tb01657.x. [DOI] [PubMed] [Google Scholar]
- van Vliet EA, da Costa AS, Redeker S, van SR, Aronica E, Gorter JA. Blood-brain barrier leakage may lead to progression of temporal lobe epilepsy. Brain. 2007a;130:521–534. doi: 10.1093/brain/awl318. [DOI] [PubMed] [Google Scholar]
- van Vliet EA, van SR, Edelbroek P, Voskuyl R, Redeker S, Aronica E, Wadman W, Gorter J. Region specific overexpression of P-glycoprotein at the blood-brain barrier affects brain uptake of phenytoin in epileptic rats. J Pharmacol Exp Ther. 2007b;332:141–147. doi: 10.1124/jpet.107.121178. [DOI] [PubMed] [Google Scholar]
- Volk HA, Potschka H, Löscher W. Increased expression of the multidrug transporter P-glycoprotein in limbic brain regions after amygdala-kindled seizures in rats. Epilepsy Res. 2004;58:67–79. doi: 10.1016/j.eplepsyres.2003.12.009. [DOI] [PubMed] [Google Scholar]
- Wagner CC, Bauer M, Karch R, Feurstein T, Kopp S, Chiba P, Kletter K, Löscher W, Müller M, Zeitlinger M, Langer O. A pilot study to assess the efficacy of tariquidar to inhibit P-glycoprotein at the human blood-brain barrier with (R)-C-11-verapamil and PET. J Nucl Med. 2009;50:1954–1961. doi: 10.2967/jnumed.109.063289. [DOI] [PMC free article] [PubMed] [Google Scholar]
- Wahnschaffe U, Löscher W. Lack of changes in seizure susceptibility during the estrous-cycle in kindled rats. Epilepsy Res. 1992;13:199–204. doi: 10.1016/0920-1211(92)90053-v. [DOI] [PubMed] [Google Scholar]
- Zoghbi SS, Liow JS, Yasuno F, Hong J, Tuan E, Lazarova N, Gladding RL, Pike VW, Innis RB. C-11-loperamide and its N-desmethyl radiometabolite are avid substrates for brain permeability-glycoprotein efflux. J Nucl Med. 2008;49:649–656. doi: 10.2967/jnumed.107.047308. [DOI] [PubMed] [Google Scholar]