

Abstract
Despite their routine use during surgical procedures, no consensus has yet been reached on the precise mechanisms by which hypnotic anesthetic agents produce their effects. Molecular, animal and human studies have suggested disruption of thalamocortical communication as a key component of anesthetic action at the brain systems level. Here, we used the anesthetic agent, propofol, to modulate consciousness and to evaluate differences in the interactions of remote neural networks during altered consciousness. We investigated the effects of propofol, at a dose that produced mild sedation without loss of consciousness, on spontaneous cerebral activity of fifteen healthy volunteers using functional magnetic resonance imaging (fMRI), exploiting oscillations (<0.1 Hz) in BOLD signal across functionally connected brain regions. We considered the data as a graph, or complex network of nodes and links and used eigenvector centrality (EC) to characterise brain network properties. The EC mapping of fMRI data in healthy humans under propofol mild sedation, demonstrated a decrease of centrality of the thalamus versus an increase of centrality within the pons of the brainstem, highlighting the important role of these two structures in regulating consciousness. Specifically, the decrease of thalamus centrality results from its disconnection from a widespread set of cortical and subcortical regions, while the increase of brainstem centrality may be a consequence of its increased influence, in the mildly sedated state, over a few highly central cortical regions key to the default mode network such as the posterior and anterior cingulate cortices.
Keywords: Sedation, functional connectivity, fMRI, eigenvector centrality, small world network
Introduction
Sedation is a pharmacologically induced, reversible state, characterized by dose-related impairment of cognitive functions, including attention and memory, and alteration of consciousness and awareness. The level and quality of consciousness may be associated with arousal and the content of subjective experience, respectively (Frith et al., 1999). The neuroanatomical structures that underpin these processes are under debate. There is evidence that consciousness may depend on intact function of brainstem-thalamo-cortical arousal circuits (Paus, 2000; Mhuircheartaigh et al., 2010). FMRI investigation of consciousness has involved comparing the neural response to tasks in the awake and sedated states. However, there is emerging evidence that the behavior of the resting brain under sedation and anesthesia may provide additional important insights in this area (Greicius et al., 2008; Martuzzi et al., 2010; Boveroux et al., 2010; Stamatakis et al., 2010).
Network analysis offers a promising framework within which systems neuroscience can address a range of challenging questions (Bassett and Bullmore, 2006; Bullmore and Sporns, 2009). A particular network architecture, which is commonly emphasized in this emerging field, is small-worldness (Watts and Strogatz, 1998). The small-world property is a qualitative description of a network characterized by high levels of local clustering and short path lengths linking all nodes of the network. This constitutes a particularly attractive model of brain network organization, since it can account for the combination of both specialized and distributed information processing, as well as minimizing wiring cost in brain circuitry (Achard et al, 2006; Sporns and Honey, 2006). Small-worldness of functional networks in humans has been validated by several teams of researchers working with different modalities, such as functional MRI (Achard et al, 2006), magnetoencephalography (Bassett et al., 2006) and electroencephalography (Micheloyannis et al., 2009). Given the small world properties of the human brain, graph-based methods provide a valuable tool for elucidating network structures. Node centrality is a key concept in network analysis of which several competing definitions exist, some of which have been applied to fMRI data analysis in the past (Sporns et al., 2007; Buckner et al., 2009). One of them, eigenvector centrality, identifies nodes that play central roles among highly connected nodes of the network (Lohmann et al., 2010).
The present study aimed to look at mild sedation as an altered state of consciousness in which cognitive and sensory processes are modulated but not abolished We applied eigenvector centrality analysis to the study of resting functional magnetic resonance imaging (fMRI) data of the human brain in healthy subjects mildly sedated with an intravenous anaesthetic agent, propofol. Within a global scale analysis of the brain using a graph theory approach, we hypothesized that the disruption of the subset of regions included in the thalamo-cortical network, may be a key feature of anesthetic–induced sedation (Angel, 1991; Antognini and Schwartz, 1993; Devor and Zalkind, 2001; Mashour, 2006).
Materials and Methods
Fifteen right-handed, healthy, male volunteers (mean age 26 years; range 20-41 years) (Buchanan et al., 2009) participated in this study after giving informed consent. They were recruited following a detailed screening procedure. Medical screening was performed to ensure that all subjects were in good physical and mental health and not on any medications (American society of Anaesthesiologists grade 1). Any volunteer with complaints of regular heartburn or hiatus hernia, known or suspected allergies to propofol (or its constituents), regular smoker or who snored frequently or excessively, or who had a potential difficultly in managing airways was excluded. Volunteers were instructed to follow standard pre-anesthetic fasting guidelines. They avoided food for six hours and any fluids for two hours before the experiments. Following the experiments they were monitored until they recovered from the effects of sedation and were discharged with safety advice after they fulfilled all day-case anesthesia discharge criteria (Verma et al., 2011). All participants underwent two fMRI scans within the same session, the first before and the second during intravenous propofol administration while volunteers remained at rest. No behavioural task was presented apart from asking volunteers to remain with their eyes closed and not to fall asleep.
Drug administration
Propofol (Propofol-Lipuro 1%, Braun Ltd., Germany) was administered using an Asena ®-PK infusion pump (Alaris Medical, CareFusion Ltd., UK) using a target controlled infusion based on the Marsh-pharmacokinetic model (Marsh et al., 1991). Infusion was started targeting an effect-site concentration of 0.6 mcg/ml. Once the target was reached 2 minutes were given for further equilibration. Drug infusion was increased in 0.2 mcg/ ml increments until the desired level of sedation was achieved. Sedation level was assessed by an anaesthetist, blinded to the level of propofol being administered, using the modified Observer’s assessment of alertness/ sedation (OAA/S) (Chernik et al., 1990). The sedation endpoint was an OAA/S level of 4 (slurred speech with lethargic response to verbal commands). The average targeted propofol plasma concentration was 1.2±0.2 μg/ml. All subjects were monitored throughout the experiments by two qualified anaesthetists (Table 1). Heart rate (HR), non-invasive blood pressure (BP), oxygen saturation (SpO2) and concentrations of expired (end-tidal) carbon-dioxide (EtCO2) were monitored using Veris ® MR Vital Signs monitoring system (Medrad Radiology ™; UK Distributor Medrad UK Ltd., Berkshire).
Table 1. Physiological data.
Mean (± SD) across subjects of physiological recordings measured before and during sedation. Paired t-tests revealed no significant differences between awake and sedated states.
| HR (bpm) | SBP (mmHg) | DBP (mmHg) | MAP (mmHg) | SpO2 (%) | |
|---|---|---|---|---|---|
| Awake | 56±7 | 123±10 | 71±8 | 95±8 | 98±1 |
| Sedated | 55±7 | 119±9 | 70±8 | 92±7 | 98±1 |
SD, standard deviation; HR, Heart Rate; SBP, Systolic Blood Pressure; DBP, Diastolic Blood Pressure; MAP, Mean Arterial Pressure; SpO2, Oxygen saturation.
MRI
Functional MRI data were collected using gradient-echo echo-planar imaging at 3T (GE HDx) using a BOLD (T2*) weighted imaging sequence (TR=3 s, TE=35 ms, matrix=64×64, FOV/slice=20.5 cm/3.2 mm, flip=90°, 50 slices, 160 vols). An eight-channel receive-only head coil was employed. A T1 weighted whole-brain structural scan was also acquired (1×1×1 mm voxels). For the purposes of accounting for physiological variance in the time-series data, end-tidal carbon dioxide (PETCO2) and end-tidal oxygen (PETO2) traces were recorded throughout the experiment using a nasal canula attached to a capnograph (AEI Technologies, PA). Cardiac and respiratory cycles were recorded using the scanner’s built-in photoplethysmograph and a pneumatic chest belt, respectively. Subjects wore an EEG cap (BrainProducts, Munich, Germany) during MRI scanning (data not reported here).
Preprocessing
Several sources of physiological variance were removed from each individual subject’s time-series FMRI data. For each subject, physiological noise correction consisted of removal of time-locked cardiac and respiratory artifacts (two cardiac harmonics and two respiratory harmonics plus four interaction terms) using linear regression (Glover et al., 2000) and of low-frequency respiratory and heart rate effects (Birn et al, 2006; Shmueli et al, 2007; Chang and Glover, 2009). In addition regressors formed from end-tidal CO2 and O2 traces were also removed (Murphy et al., 2011).
FMRI data were then pre-processed as follows: correction for head motion and slice-timing, grand mean intensity normalization and removal of non-brain voxels (performed using FSL: FMRIB’s Software Library, www.fmrib.ox.ac.uk/fsl). Using custom software written in Matlab (The Mathworks, Natick, MA), the six parameters obtained by motion realignment were regressed out and the data were band-pass filtered in the frequency range (0.01-0.1 Hz). For group analysis, a two-step registration process was performed. FMRI data were transformed first from functional space to individual subjects’ structural space using FLIRT (FMRIB’s Linear Registration Tool) and then to a standard space (Montreal Neurological Institute MNI152 standard map) using FLIRT followed by FNIRT (FMRIB’s Non-linear Registration Tool). Finally data were spatially smoothed (5×5×5 mm full-width half-maximum Gaussian kernel).
Network analysis
The fMRI-to-brain network pipeline is shown in Figure 1. A functional connection between two brain sites, i and j, was assumed as an undirected and weighted graph link (Caldarelli, 2007), with the weighting being the correlation co-efficient, a measure of similarity between the time series xi (t) and xj (t). For each subject an NxN correlation matrix R was calculated, N being the number of voxels of the grey matter considered. Each voxel is considered as a node of a complex network and the number of links incident upon it is called the node’s degree di. The square value of R was calculated and a threshold was applied in order to ensure that the Erdos-Renyi entropy S=log(N)/log((Σdi)/N), i=1,…N (Watts and Strogatz, 1998) of the network was equal across subjects, in order to guarantee a small-world feature of the network (Bullmore and Sporns, 2009) in the following analysis. We chose S = 2.0 as the threshold to define networks, although network properties have been demonstrated to be robust for different values of S (Hayasaka and Laurenti, 2010). From the resulting matrix, A, a topological measure was calculated: Eigenvector Centrality. The eigenvector centrality (EC) assigns relative scores to all nodes in the network based on the principle that connections to high-scoring nodes (highly connected nodes) contribute more to each score than equal connections to low-scoring nodes (poorly connected nodes). It follows that the eigenvector centrality wi is defined as the ith entry, xi, in the normalized eigenvector belonging to the largest eigenvalue of A (Newman, 2010). Since we assume that A represents similarities between nodes we have Aij > 0, ∀ i, j. In the present context, we may assume that A is irreducible because fMRI time series are almost never entirely dissimilar so that a sufficient number of non-zero entries in A exist. Thus, an eigenvector belonging to the normalized largest eigenvalue exists and its entries xi provide a centrality measure for each node i, which is uniquely defined and non-negative. Note that symmetric matrices with negative entries may have several largest eigenvalues that are not distinct so that the requirement of non-negativity is essential for ensuring the uniqueness of this definition. The resulting centrality maps were then transformed (van Albada et al, 2007) in order to ensure that they obey a Gaussian normal distribution as required for subsequent statistical tests. To examine the influence of propofol sedation permutation-based non parametric within-subject paired t-tests (FSL randomise) (Nichols and Holmes, 2002; Hayasaka and Nichols, 2003) were performed to identify areas where centrality varied significantly with the neurophysiological state (awake vs. sedated). The amount of propofol given to each subject was used as covariate of no interest. The results were subject to threshold-free cluster enhancement (Smith and Nichols, 2009) and family-wise error (FWE) corrected for multiple comparisons by permutation testing using a significance level of P < 0.05.
Figure 1. The pipeline used to calculate an eigenvector centrality map.

A correlation matrix calculated by considering ~ 40,000 grey matter (including brainstem and cerebellum) voxels’ timeseries was squared. The Erdos-Renyi entropy S=log(N)/log((Σdi)/N), i=1,…N (N being the number of nodes and di the degree of the ith node) of the network was set equal to 2 across subjects. As a result, a binary matrix whose entries were weighted by above threshold r2 values (weighted adjacency matrix) was obtained. The eigenvector belonging to the normalized largest eigenvalue of the weighted adjacency matrix was calculated and its entries provided a centrality measure for each voxel.
r2 ROI-based analysis
To investigate more deeply the origin of eigenvector centrality changes, we investigated the patterns of changes of brain voxels’ r2 with respect to two specific regions of interest (ROI). The thalamus and the pons of the brainstem were chosen based both on the results of the network analysis described above and on their role in the neurophysiology of consciousness. Thalamus and pons ROIs were defined in MNI space from the preceding group EC analysis. R2 maps for each subject were obtained by calculating the correlation coefficient between the average time series from each ROI and all the voxels of the brain. The square value of the correlation maps was calculated and the resulting images were combined in a permutation-based nonparametric inference (FSL randomise) (Nichols and Holmes, 2002; Hayasaka and Nichols, 2003); within-subject paired t-tests were used to test both increase and decrease of connectivity as a consequence of the level of sedation. The results were subject to threshold-free cluster enhancement (Smith and Nichols, 2009) and family-wise error (FWE) corrected for multiple comparisons by permutation testing using a significance level of P < 0.05.
Results
EC maps were calculated on networks composed of ~ 40,000 grey matter voxels and thresholded at S=2. To examine the influence of propofol sedation, paired t-tests were performed within-subjects across the group to identify areas where EC varied significantly with the arousal state. Figure 2A shows EC awake > sedated, demonstrating two regions that show a decrease of centrality, passing from the resting condition to the sedated one: the left and right thalamus ([−6, −10, 6] and [6, 10, 6] MNI space co-ordinates respectively) including parts of the medial dorsal and ventral lateral nuclei. Figure 2B shows EC sedated > awake for which one region showed an increase of centrality passing from the resting fixation to the sedated state: the brainstem ([−2, −24, −34] MNI space) incorporating a region of mid pons including cortico-spinal fibers, pontine nuclei (source of pontocerebellar fibres) and a portion of pontine tegmentum. Limitations of image resolution and image registration between functional and structural data preclude more precise localization.
Figure 2. Eigenvector centrality changes induced by propofol mild sedation.
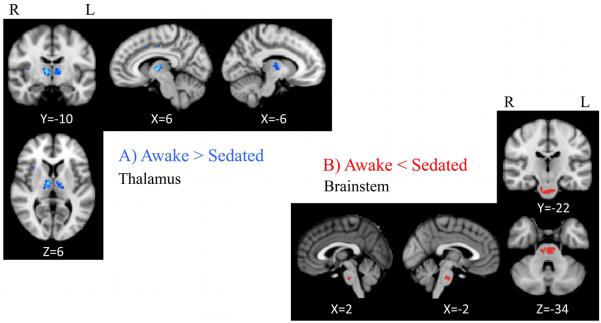
A paired t-test was calculated both for the decrease (A: AWAKE>SEDATED) and for the increase (B: AWAKE<SEDATED) of the eigenvector centrality. We report clusters that survived correction for multiple comparisons across space, via permutation testing, with FWE-correction at P values less than 0.05..
To investigate the observed centrality changes further, region of interest based functional connectivity analysis was performed using portions of the thalamus and of the brainstem as they resulted from the group statistics of the eigenvector centrality maps. Thalamic regions showed a widespread pattern of decreasing connectivity (Figure 3 and Table 2) with the caudate (bilaterally), putamen (bilaterally), left pre-motor cortex, left primary somatosensory cortex, lingual gyrus (bilaterally), right anterior cingulate cortex, right hippocampus, left superior and inferior temporal gyrus, left lateral occipital cortex, cerebellar vermis and crus I (bilaterally). No significant increases of connectivity were found associated with the thalamus. Pons functional connectivity was found to be significantly increased (Figure 4 and Table 3) with the left premotor cortex, right anterior cingulate cortex, right posterior cingulate cortex and left angular gyrus.
Figure 3. Thalamus seed-based R2 connectivity analysis.

A paired t-test was calculated for the condition AWAKE>SEDATED. A significant reduction of R2 was observed in the caudate (bilaterally), putamen (bilaterally), left pre-motor cortex, left primary somatosensory cortex, lingual gyrus (bilaterally), right anterior cingulate cortex, right hippocampus, left superior and inferior temporal gyrus, left lateral occipital cortex, cerebellar vermis and crus I (bilaterally). We report clusters that survived correction for multiple comparisons across space, via permutation testing, with FWE-correction at P values less than 0.05.
Table 2. Peak voxel coordinates: regions showing decreases in functional connectivity with the thalamus during mild sedation.
Co-ordinates are reported in MNI space (mm). The voxel size was 2×2×2 mm and regions are grouped according to the cluster to which they belong.
| Brain Region | Cluster size (vox) | Voxel (x, y, z) | Voxel (Z) |
|---|---|---|---|
| Cerebellar Right Crus I | 14529 | (26, −70, −32) | 3.52 |
| Cerebellar Left Crus I | (−24, −70, −34) | 3.39 | |
| Lingual Gyrus (L) | (16, −50, −6) | 3.34 | |
| Lingual Gyrus (R) | (−20, −54, −6) | 2.93 | |
| Cerebellar Vermis | (0, −62, −32) | 2.86 | |
| Lateral Occipital Cortex (L) | (−50, −62, −4) | 2.77 | |
| Primary Somatosensory Cortex BA2 (L) | 780 | (−46, −36, 50) | 4.11 |
| Primary Somatosensory Cortex BA1 (L) | (−48, −20, 56) | 4.00 | |
| Superior Temporal Gyrus (L) | 518 | (−52, −40, 2) | 3.14 |
| Parietal Operculum Cortex (L) | (−48, −30, 18) | 2.65 | |
| Putamen (L) | 220 | (−24, 14, −2) | 2.72 |
| Caudate (L) | 140 | (−12, 2, 18) | 3.18 |
| Premotor Cortex (L) | 89 | (−2, −12, 54) | 3.42 |
| Anterior Cingulate Cortex (R) | 75 | (4, 20, 30) | 3.33 |
| Caudate (R) | 58 | (14 , 4, 18) | 4.42 |
| Putamen (R) | 58 | (26, 14, −6) | 3.70 |
| Hippocampus (R) | 30 | (30, − 32, −6) | 3.34 |
| Inferior Temporal Gyrus (L) | 20 | (−46, −50, −22) | 3.18 |
L, Left; R, Right; BA, Brodmann area.
Figure 4. Brainstem seed-based R2 connectivity analysis.

A paired t-test was calculated for the condition AWAKE < SEDATED. As highlighted by arrows and circles significant reductions of R2 were observed in the left premotor cortex (yellow), right anterior cingulate cortex (red), right posterior cingulate cortex (green) and left angular gyrus (blue). We report clusters that survived correction for multiple comparisons across space, via permutation testing, with FWE-correction at P values less than 0.05.
Table 3. Peak voxel coordinates: regions showing increases in functional connectivity with the brainstem during mild sedation.
Co-ordinates are reported in MNI space (mm). The voxel size was 2×2×2 mm.
| Brain Region | Cluster Size (vox) | Voxel (x, y, z) | Voxel (Z) |
|---|---|---|---|
| Posterior Cingulate Cortex (R) | 45 | (26, −54, 24) | 4.11 |
| Premotor Cortex (L) | 35 | (2, 0, 68) | 3.63 |
| Angular Gyrus (L) | 25 | (46, −52, 48) | 4.00 |
| Anterior Cingulate Cortex (R) | 20 | (6, 48, 10) | 4.02 |
L, Left; R, Right.
Discussion
We observed a decrease of centrality of the thalamus during mild propofol sedation and an increase of centrality in the brainstem. These results suggest that both of these regions are important in regulating arousal during pharmacological sedation but with opposite modulation of their interaction with cortical and subcortical structures.
Functional connectivity reflects the synchrony of short-term dynamic changes in brain activity. A loss of functional connectivity can be seen as a loss of synchrony between BOLD signal fluctuations in spatially distributed regions. It does not provide information on the sedation-related changes in mean activity levels. Eigenvector Centrality, as used here, measures the rank of a node (a cerebral region) on the basis of the number of nodes with which its BOLD signal is synchronous and by considering those nodes whose BOLD signals are, in turn, synchronous with many other nodes of the brain. The mean activity of two voxels and the synchrony of their timeseries may dissociate depending on brain state (Fransson 2006). The present study examines changes in connectivity strength and not mean activity levels.
The output pathways from the thalamus to the cortex are regulated by major GABAergic inhibitory inputs from the thalamic reticular nucleus (Jones 2002). Positron emission tomography studies on propofol have suggested that anesthesia-induced loss of consciousness is associated with a decrease in neuronal activity in the thalamus (Bonhomme et al, 2001; Fiset et al, 1999). Consistently with our observations of thalamic functional disconnection from a wide range of cortical areas and with electrophysiological measurements (Franks, 2008), a functional disconnection between structurally distinct cortical regions and the thalamus has been suggested to be the cause of anesthesia-induced hypnosis (Alkire et al, 2005). Furthermore, we observed a notable disconnection of the thalamus from subcortical areas including caudate and putamen, consistent with Mhuircheartaigh and colleagues (Mhuircheartaigh et al., 2010). A common cellular mechanism linking the shut down of the thalamus and putamen as result of the properties of the medium spiny neurons in the striatum has been proposed to account for reduction of neural activity of these structures under propofol (Brown, 2010; Schiff, 2010). A direct disconnection between thalamus and caudate has not previously been reported, although Boveroux and colleagues reported a significant correlation between caudate connectivity within the executive-control network and level of sedation (Boveroux et al., 2010). The disconnection between thalamus and putamen may relate to altered motor control. Our observations suggest that central thalamic neurons participate in arousal regulation as part of a broad network across cortical and subcortical structures.
Increased centrality of the pons is consistent with a role in regulating the level of consciousness, it being involved in the ascending arousal pathway. The increased functional connectivity denotes an enhanced synchrony between the fluctuations of pontine BOLD signal and cortical regions. We suggest that the role of the brainstem as a central regulating node for arousal is preserved during mild sedation without loss of consciousness. This would be consistent with a similar role in modulating cortical networks during REM sleep as also pointed out by Stamatakis and colleagues (Stamatakis et al., 2010) who reported and increase of connectivity between the pons and posterior cingulate during sedation.
We observed an increase of brainstem connectivity with both the anterior and posterior cingulate cortices, which are considered to be part of the Default Mode Network (DMN).. Because of its persistence during deep anesthesia, the DMN is thought to be a reflection of an intrinsic property of functional brain organization (Vincent et al., 2007). The high centrality demonstrated by the brainstem through its association with the DMN may indicate an enhanced modulation of the DMN during mild sedation, but does not imply a net increase or decrease in activity in these regions. We suggest that in mild sedation arousal levels may fluctuate to a greater degree, for example in response to environmental stimuli, than during normal wakefulness thus enhancing brainstem-cortical BOLD signal synchrony. Mild sedation may therefore enhance the brainstem’s dynamic influence on higher-level brain systems and thus its centrality. In contrast to mild sedation, Boveroux et al (2010) found a reduced association of the brainstem with the DMN under propofol-induced loss of consciousness.
Several studies have observed both preservation and alteration of cortico-cortical connectivity during sedation and anaesthesia. However, results may depend on the agent studied and the degree of sedation. .Sensory, motor, and cognitive networks have been shown to preserve their correlation structure in isoflurane-anaesthetized monkeys (Vincent et al., 2007). Propofol induced unconsciousness has been associated with widespread changes in functional connectivity in the human brain, with a preferential targeting of fronto-parietal networks, compared with the relative preservation of early sensory cortices (Boveroux et al., 2010). Fronto-parietal involvement during anesthesia-induced loss of consciousness was also observed by analyzing, hierarchically, integration within and between brain networks (Schrouff et al., 2011). Multiple seed analyses of sevoflurane anesthesia (Martuzzi et al., 2010) showed unchanged resting state connectivity in the sensory cortices, in contrast to altered connectivity in higher cognitive networks. Independent component analysis showed that the DMN persists during conscious midazolam-induced sedation, but with reduced functional connectivity in the posterior cingulate cortex (Greicius et al., 2008). Conversely during mild sedation with propofol a seed region based analysis found an increased connectivity between the PCC and non-DMN areas (Stamatakis et al., 2010), including thalamus.
Graph-based analyses of functional neuroimaging data (Sporns et al., 2007; Buckner et al., 2009), in particular betweenness centrality, degree centrality and eigenvector centrality (Newman, 2010), have been applied previously to a preselected set of nodes consisting of, at most, several hundred elements. Here, we applied centrality analysis to all voxels in grey matter thereby avoiding any selection bias (Zalesky et al., 2010). Eigenvector centrality (Bonacich, 2007) specifically weights nodes based on their degree of connection within the network by counting both the number and the quality of connections so that a node with few connections to some other high-ranking nodes may outrank one with a larger number of mediocre contacts (Newman, 2008). It specifically favours nodes that are connected to nodes that are themselves central within the network taking into account the entire pattern of the network. Google’s “PageRank” algorithm is a variant of eigenvector centrality (Langville and Meyer, 2006). Eigenvector centrality is related to principal components analysis (PCA) in that both methods are based on eigenvector decompositions of similarity matrices. However, PCA differs from eigenvector centrality in that it only allows linear correlations as a similarity metric. But linear correlations may be negative so that the first principal component is not uniquely defined because of possible multiplicities of eigenvalues. Here we chose the square of the correlation coefficient to ensure positivity. This choice relies on the strict relationship r2 has with the coefficient of determination R2. Specifically, after least squares regression with a constant+linear model (i.e., simple linear regression), R2 equals the square of the correlation coefficient between the observed and modelled (predicted) data values (Draper and Smith, 1998). In terms of a voxelwise covariance analysis, r2 estimates how well a timeseries can predict another one and can be considered as a measure of the strength of relationship between timeseries. For example, a value of r=0.50 indicates a stronger degree of linear relationship than one of r=0.40. Likewise a correlation coefficient of r=−0.50 shows a greater degree of relationship than one of r=0.40. Given that other methods exist for analyzing the direction of the relationship such as Granger Causality or Phase Spectrum analyses (Roebroeck et al., 2005; Sun et al., 2005; Marinazzo et al., 2010; Niazy et al., 2011), we focused on r2 not only for weighting links of brain networks but also as an indication of the strength of the functional connectivity of two voxels. We defined networks such that the path length S of the associated Erdős–Rényi random network (the Erdős–Rényi entropy) was the same across subjects and network scales (S=2.0). Although the stability of connectivity as a function of S has been previously reported (Hayasaka and Laurenti, 2010), we tested it for three different values, S=1, 2, 3 (data not shown). The paired comparison between before and during sedation was not highly sensitive to the choice of S.
The present study only acquired data during wakefulness preceding sedation, leaving open an ‘order effect’ as a possible confound in our data. Additional confidence of the effects on functional networks would be offered by demonstrating their normalization in the recovery to wakefulness. Propofol may influence neurovascular coupling and although propofol has depressive effects on respiration during anaesthesia, it has been shown (Fiset et al., 1999) that at sedative concentrations autoregulation of cerebral vasculature is intact and that the drug does not appear to affect the regional cerebral blood flow (rCBF) response to brain activity (Veselis et al., 2005). This suggests that our observed changes in centrality patterns are likely to be neural in origin.
In conclusion we reported for the first time a whole-brain centrality analysis of fMRI data during mild sedation. It implies a central role for the thalamus and the brainstem in regulating consciousness and suggests patterns of brain regions whose modulated connectivity may represent the neural signature of progressive sedation.
Acknowledgements
TG thanks the European Commission for his Intra-European Fellowship. RW thanks the UK Medical Research Council, Engineering and Physical Sciences Research Council and the Higher Education Funding Council for Wales. NS and JH thank the European Society of Anesthesiologists for its support. KM thanks the Wellcome Trust for his Career Development Fellowship. CUBRIC was established with support from the United Kingdom Department of Trade and Industry, Cardiff University, and the Welsh Assembly government.
Footnotes
Conflict of interest: The authors declare no competing financial interests.
References
- Achard S, Salvador R, Whitcher B, Suckling J, Bullmore E. A resilient, low-frequency, small-world human brain functional network with highly connected association cortical hubs. J Neurosci. 2006;26:63–72. doi: 10.1523/JNEUROSCI.3874-05.2006. [DOI] [PMC free article] [PubMed] [Google Scholar]
- Alkire MT, Haier RJ, Fallon JH. Toward a unified theory of narcosis: brain imaging evidence for a thalamocortical switch as the neurophysiologic basis of anesthetic-induced unconsciousness. Conscious Cogn. 2000;9:370–386. doi: 10.1006/ccog.1999.0423. [DOI] [PubMed] [Google Scholar]
- Angel A. The G. L. Brown lecture. Adventures in anesthesia. Exp Physiol. 1991;76:1–38. doi: 10.1113/expphysiol.1991.sp003471. [DOI] [PubMed] [Google Scholar]
- Antognini JF, Schwartz K. Exaggerated anesthetic requirements in the preferentially anesthetized brain. Anesthesiology. 1993;79:1244–1249. doi: 10.1097/00000542-199312000-00015. [DOI] [PubMed] [Google Scholar]
- Bassett DS, Bullmore E. Small-world brain networks. Neuroscientist. 2006;12(6):512–523. doi: 10.1177/1073858406293182. [DOI] [PubMed] [Google Scholar]
- Bassett DS, Meyer-Lindenberg A, Achard S, Duke T, Bullmore E. Adaptive reconfiguration of fractal small-world human brain functional networks. Proc Natl Acad Sci USA. 2006;103(51):19518–19523. doi: 10.1073/pnas.0606005103. [DOI] [PMC free article] [PubMed] [Google Scholar]
- Birn RM, Diamond JB, Smith MA, Bandettini PA. Separating respiratory-variation-related fluctuations from neuronal-activity-related fluctuations in fMRI. Neuroimage. 2006;31(4):1536–1548. doi: 10.1016/j.neuroimage.2006.02.048. [DOI] [PubMed] [Google Scholar]
- Bonacich P. Some unique properties of eigenvector centrality. Social Networks. 2007;29:555–564. [Google Scholar]
- Bonhomme V, Fiset P, Meuret P, Backman S, Plourde G, et al. Propofol anesthesia and cerebral blood flow changes elicited by vibrotactile stimulation: a positron emission tomography study. J Neurophysiol. 2001;85:1299–1308. doi: 10.1152/jn.2001.85.3.1299. [DOI] [PubMed] [Google Scholar]
- Boveroux P, Vanhaudenhuyse A, Bruno MA, Noirhomme Q, Lauwick S, et al. Breakdown of within- and between-network Resting State Functional Magnetic Resonance Imaging Connectivity during Propofol-induced loss of consciousness. Anesthesiology. 2010;113:1038–1053. doi: 10.1097/ALN.0b013e3181f697f5. [DOI] [PubMed] [Google Scholar]
- Brown EN, Lydic R, Sciff ND. General anesthesia, sleep and coma. N Engl J Med. 2010;363(27):2683–2650. doi: 10.1056/NEJMra0808281. [DOI] [PMC free article] [PubMed] [Google Scholar]
- Buchanan FF, Myles PS, Cicuttini F. Patient sex and its influence on general anaesthesia. Anaesth Intensive Care. 2009;37:207–218. doi: 10.1177/0310057X0903700201. [DOI] [PubMed] [Google Scholar]
- Buckner R, Sepulcre J, Talukdar T, Krienen F, Liu H, et al. Cortical hubs revealed by intrinsic functional connectivity: Mapping, assessment of stability, and relation to Alzheimers disease. J Neurosci. 2009;29:1860–1873. doi: 10.1523/JNEUROSCI.5062-08.2009. [DOI] [PMC free article] [PubMed] [Google Scholar]
- Bullmore E, Sporns O. Complex brain networks: graph theoretical analysis of structural and functional systems. Nat Rev Neurosci. 2009;10:186–198. doi: 10.1038/nrn2575. [DOI] [PubMed] [Google Scholar]
- Caldarelli G. Scale free networks. Oxford UP; Oxford: 2007. [Google Scholar]
- Chang C, Glover GH. Effects of model-based physiological noise correction on default mode network anti-correlations and correlations. Neuroimage. 2009;47:1448–1459. doi: 10.1016/j.neuroimage.2009.05.012. [DOI] [PMC free article] [PubMed] [Google Scholar]
- Chernik DA, Gillings D, Laine J, Silver JM, Davidson AB, et al. Validity and reliability of the Observer’s Assessment of Alertness/Sedation Scale: study with intravenous midazolam. J Clin Psychopharmacol. 1990;10:244–251. [PubMed] [Google Scholar]
- Devor M, Zalkind V. Reversible analgesia, atonia, and loss of consciousness on bilateral intracerebral microinjection of pentobarbital. Pain. 2001;94:101–112. doi: 10.1016/S0304-3959(01)00345-1. [DOI] [PubMed] [Google Scholar]
- Draper NR, Smith H. Applied regression analysis. Wiley Interscience; 1998. [Google Scholar]
- Fiset P, Paus T, Daloze T, Plourde G, Evans AC, et al. Brain mechanisms of propofol-induced loss of consciousness in humans: a positron emission tomographic study. J Neurosci. 1999;19:5506–5513. doi: 10.1523/JNEUROSCI.19-13-05506.1999. [DOI] [PMC free article] [PubMed] [Google Scholar]
- Franks NP. General anaesthesia: from molecular targets to neuronal pathways of sleep and arousal. Nat Rev Neurosci. 2008;9:370–386. doi: 10.1038/nrn2372. [DOI] [PubMed] [Google Scholar]
- Fransson P. How default is the default mode of brain function? Further evidence from intrinsic BOLD signal fluctuations. Neuropsychologia. 2006;44:2836–2845. doi: 10.1016/j.neuropsychologia.2006.06.017. [DOI] [PubMed] [Google Scholar]
- Frith C, Perry R, Lumer E. The neural correlates of conscious experience: an experimental framework. Trends Cogn Sci. 1999;3:105–114. doi: 10.1016/s1364-6613(99)01281-4. [DOI] [PubMed] [Google Scholar]
- Glover GH, Li TQ, Ress D. Image-based method for retrospective correction of physiological motion effects in fMRI:RETROICOR. Magn Reson Med. 2000;44:162–167. doi: 10.1002/1522-2594(200007)44:1<162::aid-mrm23>3.0.co;2-e. [DOI] [PubMed] [Google Scholar]
- Greicius MD, Kiviniemi V, Tervonen O, Vainionpää V, Alahuhta S, et al. Persistent default-mode network connectivity during light sedation. Hum Brain Mapp. 2008;29:839–847. doi: 10.1002/hbm.20537. [DOI] [PMC free article] [PubMed] [Google Scholar]
- Hayasaka S, Laurienti P. Comparison of characteristics between region and voxel-based network analyses in resting-state fMRI data. Neuroimage. 2010;50:499–508. doi: 10.1016/j.neuroimage.2009.12.051. [DOI] [PMC free article] [PubMed] [Google Scholar]
- Hayasaka S, Nichols TE. Validating cluster size inference: random field and permutation methods. Neuroimage. 2003;20:2343–2356. doi: 10.1016/j.neuroimage.2003.08.003. [DOI] [PubMed] [Google Scholar]
- Jones EG. Thalamic circuitry and thalamocortical synchrony. Philos Trans R Soc Lond B Biol Sci. 2002;357:1659–1673. doi: 10.1098/rstb.2002.1168. [DOI] [PMC free article] [PubMed] [Google Scholar]
- Langville A, Meyer C. Google’s PageRank and Beyond: The Science of Search Engine Rankings. Princeton UP; Princeton: 2006. [Google Scholar]
- Lohmann G, Margulies DS, Horstmann A, Pleger B, Lepsien J, et al. Eigenvector Centrality Mapping for Analyzing Connectivity Patterns in fMRI Data of the Human Brain. PLoS ONE. 2010;5(4):e10232. doi: 10.1371/journal.pone.0010232. [DOI] [PMC free article] [PubMed] [Google Scholar]
- Marsh B, White M, Morton N, Kenny GN. Pharmacokinetic model driven infusion of propofol in children. Br J Anaesth. 1991;67:41–48. doi: 10.1093/bja/67.1.41. [DOI] [PubMed] [Google Scholar]
- Marinazzo D, Liao W, Chen H, Stramaglia S. Nonlinear connectivity by Granger causality. Neuroimage. 2011;58:330–338. doi: 10.1016/j.neuroimage.2010.01.099. [DOI] [PubMed] [Google Scholar]
- Martuzzi R, Ramani R, Qiu M, Rajeevan N, Constable RT. Functional connectivity and alterations in baseline brain state in humans. Neuroimage. 2010;49:823–834. doi: 10.1016/j.neuroimage.2009.07.028. [DOI] [PMC free article] [PubMed] [Google Scholar]
- Mashour GA. Integrating the science of consciousness and anesthesia. Anesth Analg. 2006;103:975–982. doi: 10.1213/01.ane.0000232442.69757.4a. [DOI] [PubMed] [Google Scholar]
- Mhuircheartaigh RN, Rosernorn-Lanng D, Wise R, Jbabdi S, Rogers R, Tracey I. Cortical and subcortical connectivity changes during decreasing levels of consciousness in humans: a functional magnetic resonance imaging study using Propofol. J Neurosci. 2010;30(27):9095–9102. doi: 10.1523/JNEUROSCI.5516-09.2010. [DOI] [PMC free article] [PubMed] [Google Scholar]
- Micheloyannis S, Vourkas M, Tsirka V, Karakonstantaki E, Kanatsouli K, Stam CJ. The influence of ageing on complex brain networks: a graph theoretical analysis. Hum Brain Mapp. 2009;30(1):200–208. doi: 10.1002/hbm.20492. [DOI] [PMC free article] [PubMed] [Google Scholar]
- Murphy K, Harris AD, Wise RG. Robustly measuring vascular reactivity differences with breath-hold: Normalising stimulus-evoked and resting state BOLD fMRI data. Neuroimage. 2011;54:369–379. doi: 10.1016/j.neuroimage.2010.07.059. [DOI] [PubMed] [Google Scholar]
- Newman MEJ. In: The mathematics of networks. In: The New Palgrave Encyclopedia of Economics. 2nd edition Blume L, Durlauf SD, editors. Palgrave Macmillan; Basingstoke: 2008. [Google Scholar]
- Newman MEJ. Networks: An introduction. Oxford UP; New York: 2010. [Google Scholar]
- Niazy RK, Xie J, Miller K, Beckmann CF, Smith SM. Spectral characteristics of resting state networks. Prog Brain Res. 2011;193:259–276. doi: 10.1016/B978-0-444-53839-0.00017-X. [DOI] [PubMed] [Google Scholar]
- Nichols TE, Holmes AP. Nonparametric permutation tests for functional neuroimaging: a primer with examples. Hum Brain Mapp. 2002;15:1–25. doi: 10.1002/hbm.1058. [DOI] [PMC free article] [PubMed] [Google Scholar]
- Paus T. Functional anatomy of arousal and attention systems in the human brain. Prog Brain Res. 2000;126:65–77. doi: 10.1016/S0079-6123(00)26007-X. [DOI] [PubMed] [Google Scholar]
- Roebroeck A, Formisano E, Goebel R. Mapping directed influence over the brain using Granger causality and fMRI. Neuroimage. 2005;25:230–242. doi: 10.1016/j.neuroimage.2004.11.017. [DOI] [PubMed] [Google Scholar]
- Schiff ND. Recovery of consciousness after brain injury: a mesocircuit hypothesis. Trends Neurosci. 2010;33(1):1–9. doi: 10.1016/j.tins.2009.11.002. [DOI] [PMC free article] [PubMed] [Google Scholar]
- Schrouff J, Perlbarg V, Boly M, Marrelec G, Boveroux P, et al. Brain functional integration decreases during propofol-induced loss of consciousness. Neuroimage. 2011;57:198–205. doi: 10.1016/j.neuroimage.2011.04.020. [DOI] [PubMed] [Google Scholar]
- Shmueli K, van Gelderen P, de Zwart JA, Horovitz SG, Fukunaga M, Jansma JM, Duyn JH. Low-frequency fluctuations in the cardiac rate as a source of variance in the resting-state fMRI BOLD signal. Neuroimage. 2007;38(2):306–320. doi: 10.1016/j.neuroimage.2007.07.037. [DOI] [PMC free article] [PubMed] [Google Scholar]
- Smith SM, Nichols TE. Threshold-free cluster enhancement: Addressing problems of smoothing, threshold dependence amd localisation in cluster inference. Neuroimage. 2009;44:83–98. doi: 10.1016/j.neuroimage.2008.03.061. [DOI] [PubMed] [Google Scholar]
- Sporns O, Honey J. Small worlds inside big brains. Proc Natl Acad Sci USA. 2006;103:19219–19220. doi: 10.1073/pnas.0609523103. [DOI] [PMC free article] [PubMed] [Google Scholar]
- Sporns O, Honey C, Kotter R. Identification and classification of hubs in brain networks. PloS One. 2007;2:e1049. doi: 10.1371/journal.pone.0001049. [DOI] [PMC free article] [PubMed] [Google Scholar]
- Stamatakis EA, Adapa RM, Absalom AR, Menon DK. Changes in Resting Neural Connectivity during Propofol Sedation. PLoS ONE. 2010;5(12):e14224. doi: 10.1371/journal.pone.0014224. [DOI] [PMC free article] [PubMed] [Google Scholar]
- Sun FT, Miller LM, D’Esposito M. Measuring temporal dynamics of functional networks using phase spectrum of fMRI data. Neuroimage. 2005;28:227–237. doi: 10.1016/j.neuroimage.2005.05.043. [DOI] [PubMed] [Google Scholar]
- van Albada S, Robinson P. Transformation of arbitrary distributions to the normal distribution with application to EEG test-retest reliability. J Neurosci Methods. 2007;161:205–211. doi: 10.1016/j.jneumeth.2006.11.004. [DOI] [PubMed] [Google Scholar]
- Verma R, Alladi R, Jackson I, Johnston I, Kumar C, et al. Day case and short stay surgery: 2. Anaesthesia. 2011;66:417–434. doi: 10.1111/j.1365-2044.2011.06651.x. [DOI] [PubMed] [Google Scholar]
- Veselis RA, Feshchenko VA, Reinsel RA, Beattie B, Akhurst TJ. Propofol and thiopental do not interfere with regional cerebral blood flow response at sedative concentrations. Anesthesiology. 2005;102:26–34. doi: 10.1097/00000542-200501000-00008. [DOI] [PubMed] [Google Scholar]
- Vincent JL, Patel GH, Fox MD, Snyder AZ, Baker JT, et al. Intrinsic functional architecture in the anaesthetized monkey brain. Nature. 2007;447:83–86. doi: 10.1038/nature05758. [DOI] [PubMed] [Google Scholar]
- Watts DJ, Strogatz SH. Collective dynamics of ‘small-world’ networks. Nature. 1998;393:440–442. doi: 10.1038/30918. [DOI] [PubMed] [Google Scholar]
- Zalesky A, Fornito A, Harding I, Cocchi L, Yücel M, et al. Whole-brain anatomical networks: Does the choice of nodes matter? Neuroimage. 2010;50:970–983. doi: 10.1016/j.neuroimage.2009.12.027. [DOI] [PubMed] [Google Scholar]