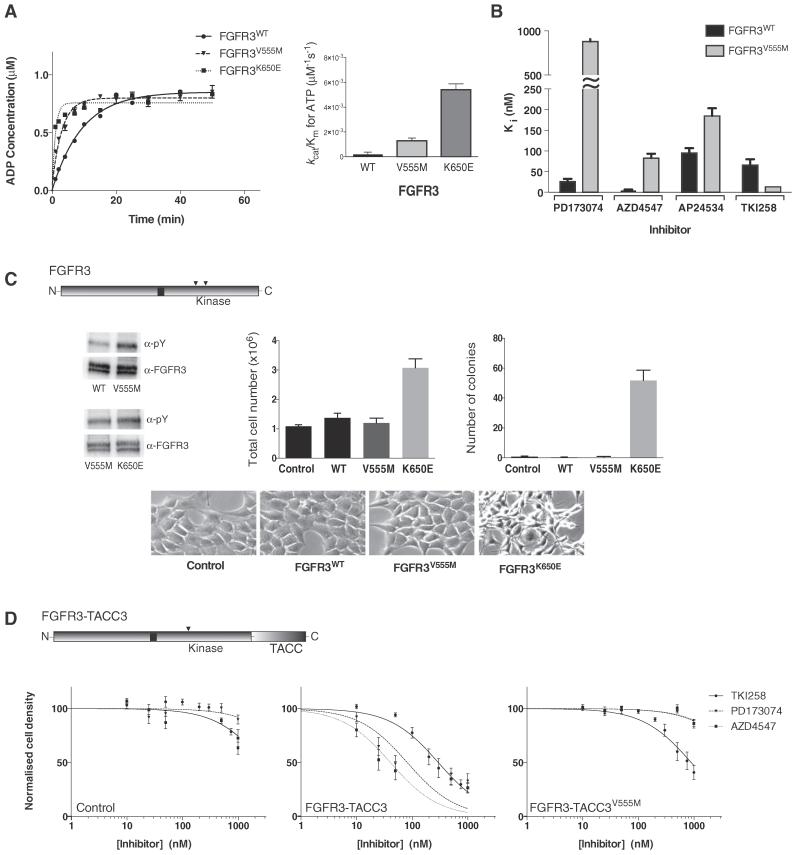
Fig. 4.
Kinase activity and inhibition of FGFR3 variants assessed in vitro and in cells. A. Left panel: Comparison of the activity of FGFR3 wild type, V555M and K650E kinase domain protein produced using the ADP-Glo Assay. Data were fit with a one-phase association model (for presentation purposes only) using Graphpad prism. Each data point was produced in triplicate and the standard errors are indicated. Right panel: Comparison of the enzyme efficiency (kcat/Km) of FGFR3 wild type, V555M and K650E kinase domain protein. Parameters were generated through Michaelis-Menten kinetic experiments and analysed using Graphpad Prism software. See also Supplemental Table S2. B. Histogram showing the inhibition constants (Ki) for four selected inhibitors upon FGFR3 kinase domain, wild type and V555M mutant. The data were generated from enzyme kinetic analyses using various concentrations of inhibitors and fitting using the Morrison equation within Graphpad Prism. Each data point was repeated in duplicate and the standard error of the mean is presented on each bar. See also Supplemental Table S1. C. Diagram at the top shows intact FGFR3 with the positions of V555 and K650 indicated in the kinase domain; in FGFR3 IIIb these residues have been assigned as V557 and K652, respectively. Top panel, left shows a representative Western blot analysis (using indicated antibodies) of samples from NIH3T3 cells stably expressing wild type (WT), V555M or K650E variants after immuno-precipitation with anti-FGFR3 antibody. Representative experiment showing the total cell numbers reached on day 7 by cells expressing wild type (WT) or mutant (V555M or K650E) FGFR3, compared to control cells (vector alone) is presented in the middle panel. Fold difference in the number of colonies formed in soft agar by cells expressing wild type or mutant FGFR3 and control cells is shown in the right panel. Bottom panels show morphology of NIH3T3 cells expressing the indicated constructs. D. Diagram at the top shows FGFR3-TACC3 fusion protein with the position of V555 in the kinase domain and the TACC3 portion at the C-terminus indicated. Control (vector only), FGFR3-TACC3 and FGFR3-TACC3-V555M stable cell lines were treated with increasing concentrations of the indicated inhibitors. Cell viability was assessed at 72 h. Data were fitted with a log(inhibitor) vs. normalised response equation within Graphpad Prism. The data in A and B are representative for 4 independent experiments and in C and D for 2 independent experiments.

