Abstract
Moving from homogeneous water-splitting photocatalytic systems to photoelectrochemical devices requires the preparation and evaluation of novel p-type transparent conductive photoelectrode substrates. We report here on the sensitization of polystyrene-block-poly-(2-vinylpyridine) (PS-b-P2VP) diblock copolymer templated NiO films with an organic push-pull dye. The potential of these new templated NiO film preparations for photoelectrochemical applications is compared with NiO material templated by F108 triblock co-polymers. We conclude that NiO films are promising materials for the construction of dye-sensitized photocathodes to be inserted into photoelectrochemical cells (PEC). However, combined effort at the interface between materials science and molecular chemistry, ideally funded within a Global Artificial Photosynthesis Project, are still needed to improve the overall performances of the photoelectrodes and progress toward economically viable PEC devices.
Introduction
The production of fuels through light-driven processes is a promising solution for the durable storage of solar energy.1-3 For example, molecular hydrogen can be produced from water splitting with O2 being generated as a side product. Alternatively, coupling photocatalytic water oxidation with the reduction of CO2 produces carbon-based fuels, with a net zero-carbon footprint. A number of molecular and supramolecular photocatalytic systems for H2 evolution, CO2 reduction or water oxidation have been reported during the last decade.4-20 These systems however only achieve one half of the targeted process and require the use of sacrificial components to furnish or accept the electrons required or produced by the catalytic reaction, respectively. Most attempts to couple light-driven oxidative and reductive processes in homogeneous phase have not been successful so far. A solution to this issue consists of separating these processes into two compartments of a photoelectrochemical cell (PEC).21 This approach has the obvious advantage of avoiding the production of potentially exploding mixtures. It however requires a fine regulation of photon, electron and proton management between both photocatalytic systems, which can be achieved through the grafting of the active components at the surface of transparent conductive electrodes substrates.22 Extending the n-type dye-sensitized solar cells (DSSCs) technology, significant achievements in this direction have been reported recently regarding the preparation of molecular-based photoanodes for water oxidation.23-29 Co-grafting of a water-oxidizing catalyst with a molecular dye on mesoscopic TiO2 substrates yielded electrodes able to deliver up to 2 mA·cm−2 photocurrent corresponding to O2 evolution under visible irradiation.27 Of note, such a current density corresponds to ~20 % of the targeted performance for implementation in a PEC device with 10 % solar to fuel efficiency.30 By contrast, the preparation of molecular photocathodes with similar architectures is strongly hampered by the lack of a suitable p-type transparent electrode substrate.31 Despite its inherently low electronic conductivity, nickel oxide (NiO) currently stands as the benchmark of such materials and efforts have targeted the preparation of nanostructured NiO films to increase the active surface area of the electrode and thus to optimize the loading in photocatalytic units.32-37 A facile synthetic route to nanostructured NiO films with a BET area of about 50 m2·g−1 has been recently described based through the use of amphiphilic polystyrene-block-poly-(2-vinylpyridine) (PS-b-P2VP) diblock copolymers as templates.38 We report here on the sensitization of such a material with an organic push-pull dye and demonstrate the potential of this templated NiO films preparation for photoelectrochemical applications.
Results and discussion
NiO films preparation
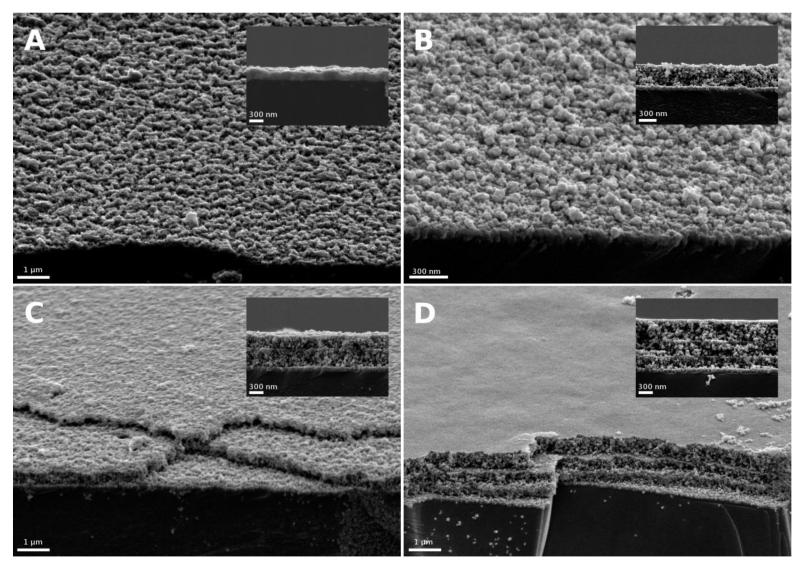
Porous nanostructured NiO films were deposited onto FTO-coated glass substrates according to a procedure, previously described for deposition on glass substrates, using amphiphilic polystyrene-block-poly-(2-vinylpyridine) (PS75-b-P2VP25) diblock copolymers– the subscripts denote the weight fraction of the corresponding block.38 The procedure was repeated three times to obtain three-layer films with homogeneous film thicknesses of 150-200 nm as measured by scanning electron microscopy (Figure 1). These films are almost transparent in the visible region (400–800 nm, Figure 3). In this study, we compared PS-b-P2VP-templated films with previously reported F108-templated films.35, 39 These films (Figure 1) have thicknesses ranging from 300-400 nm for mono-layered substrates to 900-1000 nm for 3-layer films.
Figure 1.
Scanning electron micrographs from secondary electrons (SEI) (top view & inset: cross section) of NiO films. (A) shows a triple-layer of NiO synthesized with PS-b-P2VP as template, (B) to (D) show F108-templated NiO with increasing number of layers from 1 to 3.
Figure 3.
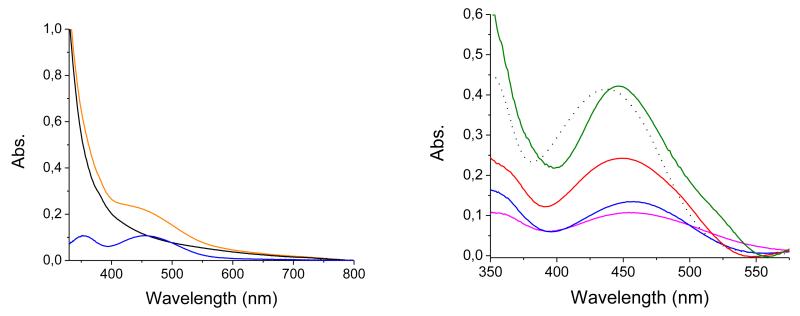
Left: absorption spectra of a blank PS-b-P2VP-templated 3-layer NiO electrode (black line) and of the same electrode after sensitization with 1 (orange line). The difference between these two spectra is shown as a blue line; Right: Comparison of corrected spectra recorded on PS-b-P2VP-templated 3 layer NiO film (blue line), F108-templated NiO films (1 layer: fuchsia line; 2 layers: red line; 3 layers: green line) and CH3CN (1 μM) solution spectrum of 1 (dotted line).
Synthesis and characterization of a push-pull organic dye
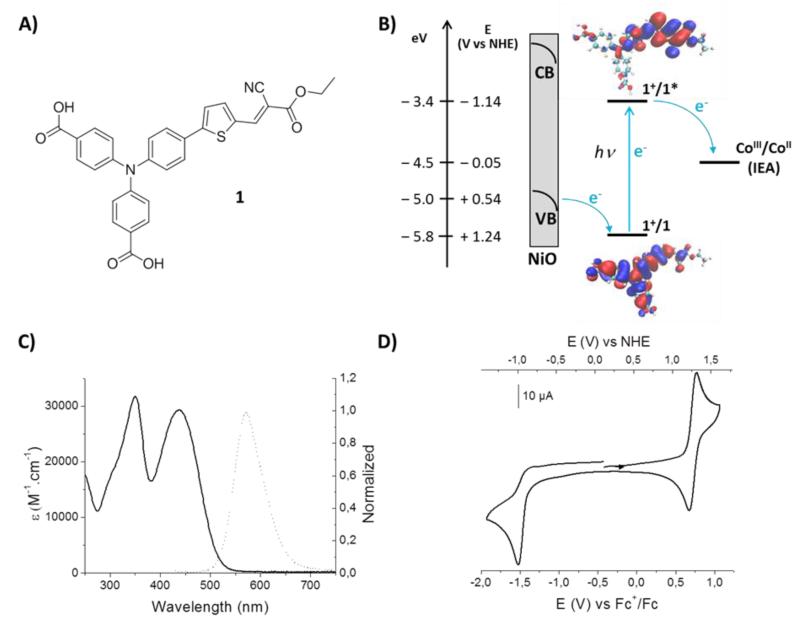
Donor-π-acceptor (push-pull) organic dyes have shown relatively high performances in NiO-based p-type DSSCs because of their large molar extinction coefficients.40 Compound 1 (Figure 2), containing a triarylamine electron-donor part and an ethyl cyanoacetate electron-acceptor part separated by a thiophene unit, has been prepared in two steps from previously described di-tert-butyl 4,4′-((4-(5-formylthiophen-2-yl)phenyl)azanediyl)dibenzoate.41 The UV-visible absorption spectrum of 1 in CH3CN solution displays a typical charge-transfer (CT) band centered at 436 nm (29300 M−1·cm−1). Upon excitation at 420 nm, emission of 1 is observed with maximum intensity at 572 nm. The cyclic voltammogram of 1 in CH3CN displays a reversible oxidation signal at +0.72 V vs Fc+/Fc and an irreversible reduction wave at Epc = −1.57 V vs Fc+/Fc (Figure 2). From these values, we could determine potential values of 1.24 V vs NHE and −1.14 V vs NHE for the 1/1+ and 1*/1+ couples, respectively, 1* representing the excited state of 1. These potentials can be approximated to the HOMO and LUMO energy levels, respectively (Figure 2, B), calculated using quantum chemistry (DFT) to be separated by 2.1 eV. This value was determined as the lowest energy from the UV-vis spectrum evaluated using a time-dependent DFT method.42 Plots of the HOMO and LUMO are shown in Figure 2B, whereas the calculated spectrum is shown in the SI. The distribution of HOMO and LUMO of 1 evidence another advantage of push-pull dyes achieving spatial charge separation in the excited state. Indeed, the donor part, where the HOMO is centered and a hole located in the excited state, was designed to support the anchor groups. It is thus connected to the electrode which optimizes hole injection. By contrast the acceptor moiety, where the LUMO is centered and an electron is located in the excited state, is located away from the electrode surface, which both limits recombination with the p-type semi-conductor material and fosters electron transfer towards an electron acceptor in solution. The HOMO energy level in 1 is lower than the top of the valence band (VB) in NiO (0.54 V vs NHE at pH 7),43 in good agreement with hole injection from photo-excited 1 to NiO VB (Figure 2, B). In that context, the presence of two anchoring carboxylate groups attached on the triarylamine moiety favors both strong binding of 1 to NiO and electronic coupling optimization between the HOMO in 1 and NiO VB orbitals.
Figure 2.
A) Structure of 1. B) Energy level diagram of a p-type NiO photocathode sensitized with 1, in presence of [Co(NH3)5Cl]Cl2 as sacrificial electron acceptor (SEA) in solution. C) UV-vis (dashed line) and normalized fluorescence (solid line, excitation at 420 nm) spectra of 1 measured in MeCN at a concentration of 5 μM. D) Cyclic voltammogram of compound 1 (1 mM) recorded at a scan rate of 100 mV·s−1 on a glassy carbon electrode in CH3CN containing 0,1 M nBu4NPF6 as supporting electrolyte.
NiO films sensitization and characterization
The different NiO substrates were sensitized through soaking in a CH3CN solution of dye 1 for 24 hours. The samples were rinsed with CH3CN and dried in air before characterization. Figure 3 displays typical absorption spectra of the dye-sensitized electrodes showing new features as compared to the spectra of pure NiO samples. Subtraction of the absorption of the blank NiO substrate45 reveals the absorption spectrum of dye 1 grafted onto the NiO surface. For all samples, a spectral broadening associated to a small red shift (ca. 10 nm) of the absorption band is observed. These modifications could result from interactions of the dye molecules with the NiO substrate through grafting and possibly from intermolecular interactions between adjacent grafted dyes (see below). Assuming that these interactions do not significantly modify the molar absorption coefficient εmax of the dye, we estimated the surface concentration of 1 using equation 1. We give in Table 2 the ranges of dye surface and volume concentrations obtained for the various substrates using equations 1 and 2.
| (equation 1) |
| (equation 2) |
Table 2.
Surface concentrations (mol cm−2) of 1 grafted on different substrates
| Substrate | Thickness (nm) | Dye surface conc. (mol·cm−2) | Dye volume conc. [mol·cm−3] |
|---|---|---|---|
| PS-b-P2VP-templated 3-layer films | 150–200 | 3·10−9–5·10−9 | 14·10−5 |
| F108-templated 1-layer films | 300–400 | 4·10−9–5·10−9 | 12·10−5 |
| F108-templated 2-layer films | 500–600 | 7·10−9–9·10−9 | 13·10−5 |
| F108-templated 3-layer films | 900–1000 | 9·10−9–1.5·10−8 | 14·10−5 |
As expected, the surface concentration of the F108-templated substrates varies almost linearly with the thickness of the films. The surface concentration of PS-b-P2VP-templated 3-layer films is slightly lower than the one obtained for the mono-layer F108-templated films, in good agreement with the reduced thickness of these films. Accordingly the calculated dye volume concentration is almost identical in all dye-sensitized films.
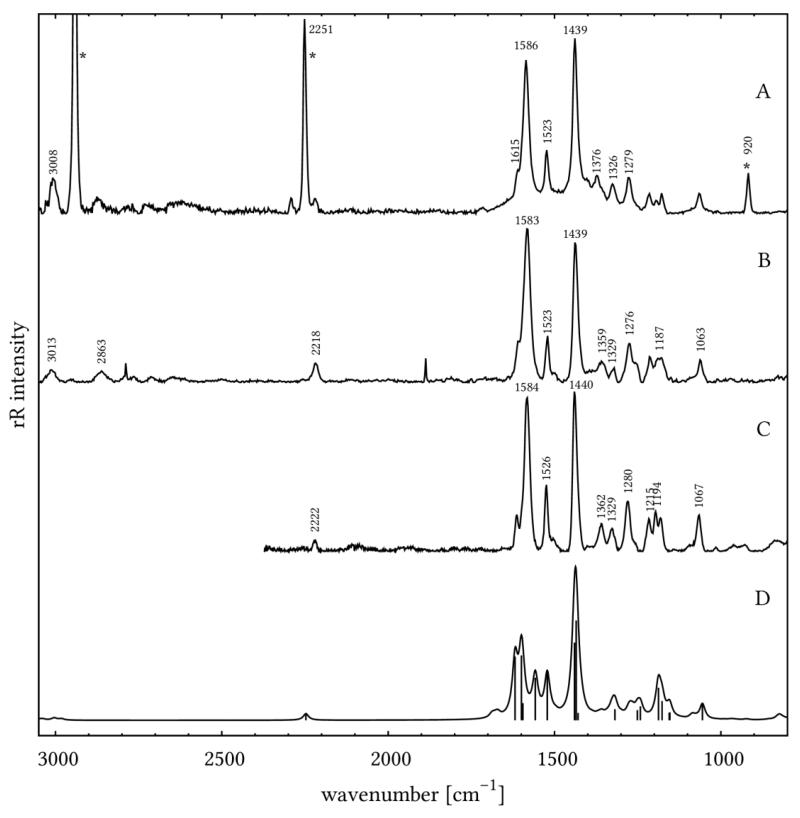
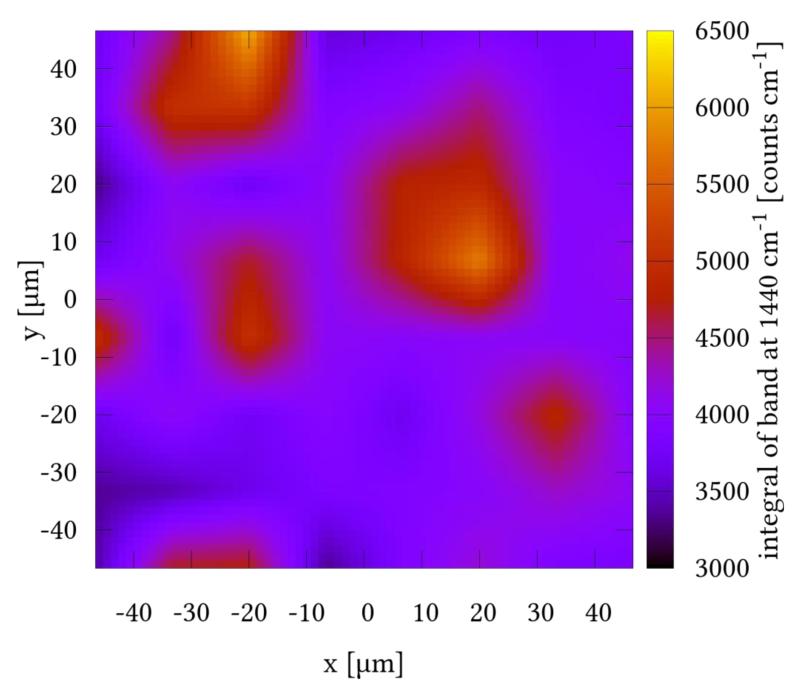
In order to detail the electron-density changes within the dye on the NiO surface, which are associated with photoabsorption, resonance Raman (rR) measurements have been carried out. Furthermore, rR mapping allows for visualizing the distribution of the dye on the NiO surface. The rR spectra in solution (Fig. 4A) and on NiO (Fig. 4B, 4C) are identical except for the fluorescence background (see below) and the Raman bands of the solvent. All of them are in good agreement with the DFT-calculated Raman spectra after application of a 0.98 scaling factor (Fig. 4D). This means that binding to the surface does not influence the nature of the initial photoexcitation in 1. Upon changing the excitation wavelength from 413 to 476 nm the overall pattern of the rR spectrum of 1 is preserved except for slight alterations of band intensities: Bands at 1440, 1526, and the three bands at about 1200 cm−1 gain intensity, while the band at 1584 cm−1 drops in intensity. The rR map (see Figure 5) shows a homogeneous distribution of the dye on the surface since most pixels of the map exhibit integrals of the band at 1440 cm−1 which correlate with the dye concentrations between 3500 and 4500 counts·cm−1. Nonetheless, some regions of higher dye concentration (up to ca. 6500 counts·cm−1) on the surface are observed. These might originate from inhomogeneities in the NiO surface introduced upon the deposition of the copolymer-Ni reaction mixture during the doctor blading.
Figure 4.
Resonance Raman spectra of 1 in CH3CN at an excitation wavelength of 413 nm (A), 1 on PS-b-P2VP-templated 3-layer NiO film at 413 nm (B) and 476 nm (C) excitation wavelengths, DFT calculated Raman spectrum of 1 after application of a 0.98 scaling factor (D).
Figure 5.
Resonance Raman map of 1 on a PS-b-P2VP-templated 3-layer NiO film.
Photoelectrochemical properties of dye-sensitized NiO films
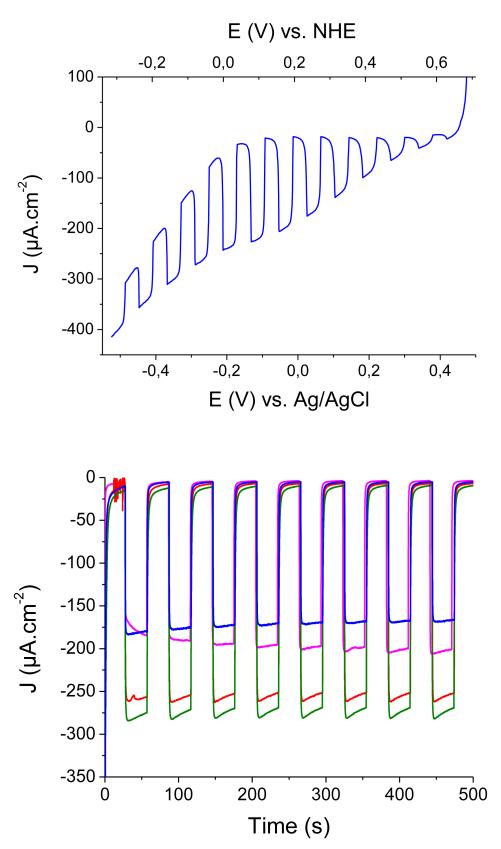
We then investigated the photoelectrochemical (PEC) properties of these dye-sensitized NiO films. The substrates were used as working electrode in a three-electrode configuration cell designed on purpose. Aqueous sodium acetate buffer (pH 4.5; 0.1 M) was first chosen as the electrolyte and the current was recorded under chopped irradiation conditions (400–800 nm filtered Xe Lamp light; 100 mW·cm−2; 2 suns) at various potentials applied to the working electrode in the presence of [Co(NH3)5Cl]Cl2 as an irreversible electron acceptor (IEA on Figure 2B) in the solution. The linear sweep voltammogram recorded under chopped light (Figure 6) shows the establishment of a photocurrent with onset at +0.61 V vs NHE, in good agreement with the potential of the valence band edge of NiO (Figure 2), and maximum photocurrent densities at +0.20 V vs NHE (0 V vs Ag/AgCl). We therefore used this potential for the whole series of experiments described below. In the absence of any electron acceptor in solution, small cathodic photocurrents (ca. 10 μA·cm−2) were recorded. This phenomenon has been previously observed and assigned to H2 evolution46 although we could not detect any hydrogen in the headspace of the cell after 12h continuous photoelectrolysis. We thus believe that a significant part of this photocurrent is due to the reduction of residual traces of O2 present in the electrolyte or trapped within the oxide films. Nevertheless, such a behavior is directly related to the presence of 1 at the surface of the films since non-sensitized NiO films do not show any photocurrent under the same conditions.
Figure 6.
Top: Linear sweep voltammogram (10 mV·s−1) recorded under chopped light on a PS-b-P2VP-templated 3-layer NiO film sensitized with 1 in [Co(NH3)5Cl]Cl2 (10 mM) / acetate buffer (pH 4.5; 0.1 M); Bottom: cathodic photocurrent measurements recorded on NiO electrodes sensitized with 1 in [Co(NH3)5Cl]Cl2 (10 mM) / acetate buffer (pH 4.5; 0.1 M) with 0 V vs. Ag/AgCl applied potential: PS-b-P2VP-templated 3-layer NiO film (blue trace) and F108-templated NiO films (1 layer: fuchsia trace; 2 layers: red trace; 3 layers: green trace).
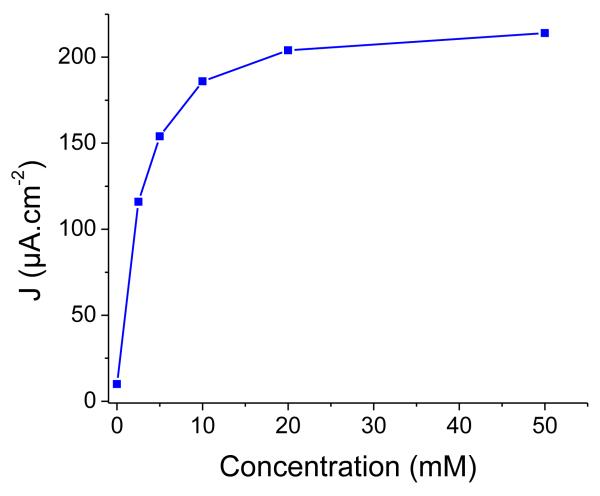
Photocurrent enhancement observed in the presence of IEA (Figure 6) is attributed to the establishment of photoinduced electron transfers from NiO to IEA, mediated by the excited dye. Two mechanisms are possible: in the oxidative quenching process, a photoinduced electron transfer occurs from photo-excited 1 to the Co(III) acceptor in solution, the ground-state of 1 being subsequently regenerated through hole transfer to the conducting band of NiO. In the alternative reductive quenching process, hole injection from the excited state of 1 to NiO occurs first, producing surface immobilized 1−, which in turns reduces the Co(III) complex and regenerates the ground state of 1. The latter mechanism is supported by the strongly reduced fluorescent background observed during resonance Raman spectra of 1 when shifting from solution onto NiO (see SI). We have studied the variation of the photocurrent value with the concentration of the Co(III) electron acceptor in solution. Figure 7 shows that the photocurrent value does not vary much for cobalt concentrations superior to 10 mM. There are two possibilities for the rate-determining step in this experiment. First, diffusion of the Co(III) electron acceptor within the porous film can limit the reaction. Second, under the assumption that diffusion does not influence photocurrents, hole injection can be rate-determining. The probability that diffusion is dominating this process is higher since hole injection is generally reported to be very fast with time-constants of hundreds of femto-seconds to a few picoseconds for organic dyes.47-51 Photocurrent densities as high as 270 μA·cm−2 are obtained for F108-templated 3-layer NiO films (Figure 6). Interestingly 1-sensitized PS-b-P2VP –templated 3-layers films display photocurrent values as high as those obtained for F108-templated 1-layer films. This indicates that the PS-b-P2VP-templated formulation proves superior to the F108-templated one for such PEC applications. For thicker films, however, the photocurrent density does not linearly vary with the film thickness or the surface concentration of the dye. Such a current plateauing may come from limited diffusion of the Co(III) complex within the films.
Figure 7.
Variation of the stabilized photocurrent with the concentration of [Co(NH3)5Cl]Cl2, measured on a PS-b-P2VP-templated 3-layer film sensitized with 1, in acetate buffer ( 0.1M, pH 4.5) at an applied potential of 0 V vs. Ag/AgCl.
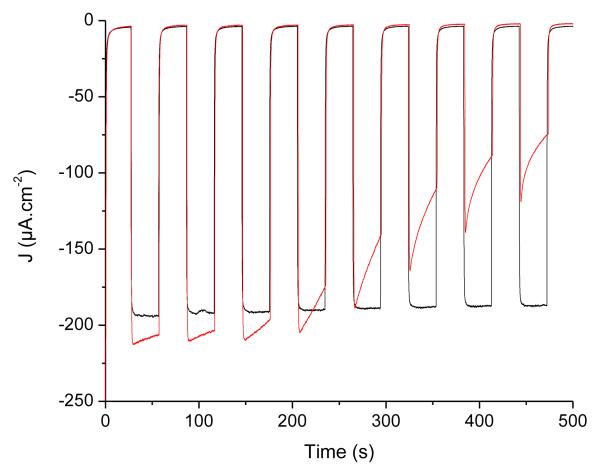
Nevertheless, in all cases, the photocurrents proved very stable with time. We thus decided to compare the aqueous acetate buffer conditions examined here with phosphate buffer conditions more typically used in the literature.52-54 Figure 8 compares the PEC performance of the same electrode recorded first in acetate buffer (pH 4.5, black trace) and then in phosphate buffer (pH 7, red trace). Photocurrents measured in phosphate buffer are clearly less stable with time than those measured in the presence of acetate as the electrolyte. After 10 min, they usually stabilize to values comprised between 40 and 60 μA·cm−2. This is likely due to the fact that phosphate ions interact more strongly with the NiO surface than the carboxylate anchors in 1, so that some dye leaches from the surface. We observe a lag phase to this phenomenon which may correspond to the time required to displace surface-anchored acetate anions which are more tightly bound than dye 1.
Figure 8.
Cathodic photocurrent measurements recorded on a PS-b-P2VP-templated 3-layer NiO electrodes sensitized with 1 in [Co(NH3)5Cl]Cl2 (10 mM) with 0 V vs. Ag/AgCl applied potential. The measurement was first carried out in acetate buffer pH 4.5 (black trace). Then the electrolyte was changed for phosphate buffer pH 7 and a new measurement was performed (red trace).
We finally compared the push-pull dye 1 with the Ru-based dye [Ru(bpy)2(4,4′-(CH2PO3H2)2-bpy)]Cl2 (2) containing two phosphonic acid functions as anchoring groups. This dye also absorbs visible light around 450 nm but with a lower molar absorptivity (ε = 11000 M−1·cm−1) as compared to 1. PS-b-P2VP-templated NiO films sensitized with 2 display similar surface concentrations in the 1.5–2.8 nmol·cm−2 range. A maximum photocurrent density value of 15 μA·cm−2 could be measured at 0 V vs Ag/AgCl for 20 mM concentrations of [Co(NH3)5Cl]Cl2 in either acetate or phosphate buffer. This value is ten-fold lower than those obtained with 1-sensitized films under similar conditions. This value is also lower compared to that (50 μA·cm−2) measured for a 500 nm-thick polymer-templated nano-ITO film sensitized with the same ruthenium-based dye 2 and a similar surface concentration (4.4 nmol·cm−2).52 This comparison supports the combination of a p-type NiO electrode substrate with push-pull organic dyes with enhanced light absorptivity as optimal architecture for the design of molecular-based photoelectrodes.
Conclusion
This study shows that state-of-the-art NiO films are suitable materials for the construction of dye-sensitized photocathodes with current densities up to 300 μA·cm−2. Such photocurrent densities can be achieved with simple and easily accessible push-pull organic dyes displaying high molar absorptivities in the visible region. Current density values seem to be limited by the injection step of the hole from the sensitizer to the NiO material. Further developments in materials chemistry are needed to increase these values to few mA·cm−2 and comply to the requirement of economically viable PEC devices.30 Nevertheless, state of the art H2-evolving molecular photocathodes still exhibit 10-fold lower photocurrents indicating that efforts should now be directed towards the optimization of directional electron transfer from the grafted dye (either in the photo-excited or reduced state) to the catalytic unit and/or the development and integration of faster multi-electron reduction catalysts. The stable photocurrents obtained in pH 4.5 acetate buffer electrolyte, i.e. conditions where cobalt-based catalysts have proved to be stable and active for H2 evolution,55, 56 hold promises for the development of functional photoelectrodes. This study resulting from the combined efforts of four distinct groups from France and Germany demonstrates the relevance of a Global Artificial Photosynthesis Project promoting interactions at the interface between various fields such as materials science, molecular chemistry, theoretical chemistry and physical chemistry. Such a global enterprise must not only be continued, but also supported and funded, at the international level.
Experimental section
All chemical reagents were purchased from Sigma sources and used as received. Di-tert-butyl-4,4′-((4-(5-formylthiophen-2-yl)phenyl)azanediyl)dibenzoate was synthetized as previously described.41 FTO-coated glass substrates (1.1 mm thickness; 80 Ω·−1) were purchased from SOLEMS S.A., Palaiseau, France. 1H and 13C NMR analyses were performed on a Bruker Avance III 300 spectrometer. Chemical shift values are given in ppm with reference to solvent residual signals.57 FTIR spectra were recorded on a Perkin-Elmer Spectrum 100 spectrometer using a Pike Miracle single reflection ATR sampling accessory equipped with a Ge crystal. UV-visible absorption and emission spectra were recorded on a Agilent Cary 60 UV-Vis spectrometer and a Jasco FP-8500 fluorimeter, respectively. Cyclic voltammograms were recorded with a Bio-logic SP300 potentiostat under nitrogen at room temperature. A standard three-electrode configuration was used consisting of a glassy carbon working electrode, an auxiliary platinum wire and an Ag/AgCl/aqueous AgClsat + KCl 3 mol·L−1 (denoted as Ag/AgCl throughout this text) reference electrode closed by a Vycor frit and dipped directly into the solution. The [Fe(CN)6]3–/[Fe(CN)6]4– couple (E0 = +0.215 V vs Ag/AgCl; referred at +0.425 V vs NHE in 0.1 M potassium phosphate buffer at pH = 7)58 was then used for the standardisation of the measurements in aqueous solution.58 The Fc+/Fc couple (measured at E0 = +0.43 V vs. Ag/AgCl) was used as a reference for CV measurements in acetonitrile (Potentials measured vs Fc+/Fc and converted to NHE by addition of +0.53 V59).
The ORCA program60 (version 3.0.2) was employed for all DFT calculations. Geometry optimizations were performed using the B3LYP functional61, 62 and the Ahlrichs TZVP basis set, which is of triple-zeta quality,63 augmented by extra polarization and diffuse functions (ORCA keyword ACCOPT). Calculations were done in both vacuum and with an implicit solvent model of acetonitrile, using ORCA’s version of the COSMO method.64 After geometry optimization, TDDFT calculations were carried out to determine the UV-vis spectra and the HOMO-LUMO gap,42 together with harmonic frequency calculations to evaluate the IR and Raman spectra. The plots of the HOMO and LUMO orbitals were made with the VMD program.65
Scanning electron microscopy was performed on a JSM-6300F (JEOL, Tokyo, Japan) field-emission microscope (FE-SEM). The lateral resolving power of the system is specified to approximately 3 nm at 15 keV. Everhardt–Thornley type detector was used for imaging for secondary electrons (SEI). If needed the specimen stage was tilted (up to 60°) to enhance the topographic visibility. The Ni2+-loaded material was deposited onto glass substrates. In order to avoid charging effects all samples were coated with approximately 20 nm carbon. Cross-sectional preparations were performed after short-term LN2-cooling in order to reduce the degree of ductility and to achieve plain true edge fracture patterns.
For the resonance Raman (rR) microspectroscopy measurements a conventional micro-Raman setup (Labram HR, Horiba Jobin Yvon) was used. The spectrometer was equipped with a 600 lines-per-millimeter grating and combined with an Olympus inverse microscope IX71. The excitation wavelengths were delivered by a Krypton-ion laser (Model Coherent Innova 301C, λ = 413 and 476 nm). For the measurements, the laser was focused onto the dye-sensitized NiO surface using an Olympus 20× UPlan FLN microscope objective. The incident laser power was 1 mW at the sample, the spot diameter was 1 μm. The spectra were recorded with an integration time of 2 s per spectrum. All spectra presented in this paper are mean spectra of a quadratic map (60 μm edge length, 10 × 10 spectra), which builds a profound and statistically reliable basis for the comparison of rR intensities. The mean spectra were processed by the statistics-sensitive non-linear iterative peak- clipping (SNIP) algorithm for background correction using Gnu R 66 and the library “Peaks” with 20 iterations.67
The synthetic procedure for the preparation of template NiO films followed the one described in literature.68 Polystyrene-block-poly(2-vinylpyridine) (PS-b-P2VP) was synthesized via sequential anionic polymerization using a procedure adopted from the literature.69 The mixture of block copolymer and Ni was deposited through doctor blading for three times on FTO-coated glass substrates with 5 min in a furnaces at 450 °C after deposition of the first and second layer and 25 min in the furnace after the third deposition step.
Di-tert-butyl-(E)-4,4′-((4-(5-(2-cyano-3-ethoxy-3-oxoprop-1-en-1-yl)thiophen-2-yl)phenyl)azanediyl)dibenzoate
To a solution of di-tert-butyl-4,4′-((4-(5-formylthiophen-2-yl)phenyl)azanediyl)dibenzoate (1 eq, 0.2 mmol, 110 mg) and ethyl cyanoacetate (95 eq, 19 mmol, 2 mL) in 5 mL of dry CHCl3, , was added piperidine (25 eq, 5 mmol ,0.5 mL). The reaction mixture was stirred at room temperature for 12 hours under argon and protected from the sunlight. The mixture was diluted with CHCl3 and washed with 1 M aqueous HCl then water. After removal of the solvent, the crude product was purified on a silica gel column using pentane / ethyl acetate (8/2) as eluent to give the di-tertbutylester as an orange solid (88 mg; 68 %). 1H NMR (CDCl3, 300 MHz): δ (ppm) 8.27 (s, 1H), 7.90 (d, J = 8.6Hz, 4H), 7.73 (d, J = 4Hz, 2H), 7.60 (d, J = 8.5Hz, 2H), 7.35 (d, J = 4Hz, 1H), 7.11 (m, 6H), 4.35 (q, J = 7.1Hz, 2H), 1.58 (s, 18H), 1.38 (t, J = 7.1Hz, 3H). 13C NMR (CDCl3, 75 MHz): δ (ppm) 165.3, 163.1, 154, 150.2, 147.8, 146.5, 139.3, 134.8, 131.1, 128.6, 127.8, 127.2, 125.3, 124.1, 123.5, 116.2, 97.9, 81, 62.5, 28.3, 14.3. HR-MS (ESI+): m/z calcd for C38H39N2O6S 651.2523; found 651.2517 [M+H]+.
(E)-4,4×-((4-(5-(2-cyano-3-ethoxy-3-oxoprop-1-en-1-yl) thiophen-2-yl)phenyl)azanediyl)dibenzoic acid (1)
To a solution of di-tertbutylester (1 eq, 35 mg. 53.8 μmol) in 3.5 mL of CH2Cl2 was added trifluoroacetic acid (10 eq, 0.4 mL, 0.52 mmol). The reaction mixture was stirred 5 hours at room temperature. After removal of the solvent, the crude product was purified by precipitation from a CH2Cl2/cyclohexane mixture. The resulting orange powder was filtered, washed with pentane and dried under a vacuum to afford pure 1 (28 mg; 97%). 1H NMR (CDCl3 + 10% MeOD, 300 MHz): δ 8.28 (s, 1H), 7.97 (d, J = 8.1Hz, 4H), 7.74 (d, J = 3.3Hz, 2H), 7.63 (d, J = 8.1Hz, 2H), 7.36 (d, J = 3.3Hz, 1H), 7.15 (m, 6H), 4.35 (q, J = 7Hz, 2H), 1.38 (t, J = 7Hz, 3H). 13C NMR (CDCl3 + 10% MeOD, 75 MHz): δ 168.4, 163.2, 154, 150.6, 147.5, 146.7, 139.5, 134.7, 131.6, 128.9, 127.9, 125.7, 125.3, 124.2, 123.3, 116.1, 97.7, 62.6, 14.2. HR-MS (ESI+): m/z calcd for C30H23N2O6S 539.1271; found 539.1268 [M+H]+.
Film sensitization
The variously prepared NiO electrodes were soaked into a 0.5mM solution of 1 in MeCN for 24 hours on an orbital stirring table. The electrodes were rinsed with MeCN and dried in air.
Photo-electrochemical measurements
Photocurrent measurements were performed in a specific cell in three-electrode configuration. The the FTO-coated glass substrate (onto which the NiO film has been deposited) is clamped on the cell, serving both as working electrode and window. The surface of the working electrode in contact with the electrolyte is 0.42 cm2. Ti wire and Ag/AgCl have been used as counter and reference electrodes respectively. We used sodium acetate buffer (0.1 M, pH = 4.5) and potassium phosphate buffer (0.1M, pH = 7) as electrolytes and [Co(NH3)5Cl]Cl2 (10 mM) as the electron acceptor in solution. Photoelectrodes were back-illuminated with a 300W ozone-free Xenon lamp (Newport) operated at 280W coupled to a water filled Spectra-Physics 6123NS Liquid filter for elimination of IR radiation and a Spectra-Physics 59472 UV cut-off filter (λ > 400nm). Irradiance at the substrate surface was measured to 100 mW.cm−2 (ca. 2 suns) thanks to the Newport PM1918-R power-meter.
Table 1.
Spectroscopic and energetic data for compound 1.
| λ max (Abs) a | λ max (Em) a | ε a | E 0-0 b | E HOMO | E LUMO | ||
|---|---|---|---|---|---|---|---|
| nm | nm | M−1·cm−1 | eV | (V vs NHE) c | eVd | (V vs NHE)e | eVe |
| 436 | 572 | 29300 | 2.39 | +1.24 | −5.82 | −1.14 | −3.43 |
Spectra measured at 5 μM in CH3CN.
0-0 transition energy, E0-0, estimated from the intercept of the normalized absorption and emission spectra in MeCN.
Estimated HOMO energy, EHOMO, obtained from the ground-state oxidation potential.
HOMO energy in eV obtained from the redox potential related to Fc+/Fc with a calculated absolute energy of – 0.51 eV.44
Estimated LUMO energy, ELUMO, obtained from the estimated HOMO energy by adding the 0-0 transition energy, E0-0.
Acknowledgements
M.B. gratefully acknowledges a PhD fellowship from the Studienstiftung des deutschen Volkes. This work was supported by the COST Action CM1202 PERSPECT-H2O, the French National Research Agency (Labex program, ARCANE, ANR-11-LABX-0003-01), the European Research Council under the European Union’s Seventh Framework Programme (FP/2007-2013)/ERC Grant Agreement n.306398 and the Life Science Division of CEA (2011 DSV-Energy program). Funding from the Royal Society related to the Chicheley Hall meeting on artificial photosynthesis (July 2014) is gratefully acknowledged.
References
- 1.Faunce TA, Lubitz W, Rutherford AW, MacFarlane D, Moore GF, Yang P, Nocera DG, Moore TA, Gregory DH, Fukuzumi S, Yoon KB, Armstrong FA, Wasielewski MR, Styring S. Energy Environ. Sci. 2013;6:695–698. [Google Scholar]
- 2.Faunce T, Styring S, Wasielewski MR, Brudvig GW, Rutherford AW, Messinger J, Lee AF, Hill CL, deGroot H, Fontecave M, MacFarlane DR, Hankamer B, Nocera DG, Tiede DM, Dau H, Hillier W, Wang L, Amal R. Energy Environ. Sci. 2013;6:1074–1076. [Google Scholar]
- 3.Thapper A, Styring S, Saracco G, Rutherford AW, Robert B, Magnuson A, Lubitz W, Llobet A, Kurz P, Holzwarth A, Fiechter S, de Groot H, Campagna S, Braun A, Bercegol H, Artero V. Green. 2013;3:43. [Google Scholar]
- 4.Artero V, Chavarot-Kerlidou M, Fontecave M. Angew. Chem. Int. Ed. 2011;50:7238–7266. doi: 10.1002/anie.201007987. [DOI] [PubMed] [Google Scholar]
- 5.Andreiadis ES, Chavarot-Kerlidou M, Fontecave M, Artero V. Photochem. Photobiol. 2011;87:946–964. doi: 10.1111/j.1751-1097.2011.00966.x. [DOI] [PubMed] [Google Scholar]
- 6.Eckenhoff WT, Eisenberg R. Dalton Trans. 2012;41:13004–13021. doi: 10.1039/c2dt30823a. [DOI] [PubMed] [Google Scholar]
- 7.Krassen H, Ott S, Heberle J. Phys. Chem. Chem. Phys. 2011;13:47–57. doi: 10.1039/c0cp01163k. [DOI] [PubMed] [Google Scholar]
- 8.Schulz M, Karnahl M, Schwalbe M, Vos JG. Coord. Chem. Rev. 2012;256:1682–1705. [Google Scholar]
- 9.Thoi VS, Sun Y, Long JR, Chang CJ. Chem. Soc. Rev. 2013;42:2388–2400. doi: 10.1039/c2cs35272a. [DOI] [PubMed] [Google Scholar]
- 10.Halpin Y, Pryce MT, Rau S, Dini D, Vos JG. Dalton Trans. 2013;42:16243–16254. doi: 10.1039/c3dt52319e. [DOI] [PubMed] [Google Scholar]
- 11.McKone JR, Marinescu SC, Brunschwig BS, Winkler JR, Gray HB. Chem. Sci. 2014;5:865–878. [Google Scholar]
- 12.Appel AM, Bercaw JE, Bocarsly AB, Dobbek H, DuBois DL, Dupuis M, Ferry JG, Fujita E, Hille R, Kenis PJA, Kerfeld CA, Morris RH, Peden CHF, Portis AR, Ragsdale SW, Rauchfuss TB, Reek JNH, Seefeldt LC, Thauer RK, Waldrop GL. Chem. Rev. 2013;113:6621–6658. doi: 10.1021/cr300463y. [DOI] [PMC free article] [PubMed] [Google Scholar]
- 13.Morris AJ, Meyer GJ, Fujita E. Acc. Chem. Res. 2009;42:1983–1994. doi: 10.1021/ar9001679. [DOI] [PubMed] [Google Scholar]
- 14.Reithmeier R, Bruckmeier C, Rieger B. Catalysts. 2012;2:544–571. [Google Scholar]
- 15.Finn C, Schnittger S, Yellowlees LJ, Love JB. Chem. Commun. 2012;48:1392–1399. doi: 10.1039/c1cc15393e. [DOI] [PubMed] [Google Scholar]
- 16.Kondratenko EV, Mul G, Baltrusaitis J, Larrazabal GO, Perez-Ramirez J. Energy Environ. Sci. 2013;6:3112–3135. [Google Scholar]
- 17.Qiao JL, Liu YY, Hong F, Zhang JJ. Chem. Soc. Rev. 2014;43:631–675. doi: 10.1039/c3cs60323g. [DOI] [PubMed] [Google Scholar]
- 18.Romain S, Vigara L, Llobet A. Acc. Chem. Res. 2009;42:1944–1953. doi: 10.1021/ar900240w. [DOI] [PubMed] [Google Scholar]
- 19.Sala X, Romero I, Rodriguez M, Escriche L, Llobet A. Angew. Chem. Int. Ed. 2009;48:2842–2852. doi: 10.1002/anie.200802659. [DOI] [PubMed] [Google Scholar]
- 20.Herrero C, Quaranta A, Leibl W, Rutherford AW, Aukauloo A. Energy Environ. Sci. 2011;4:2353–2365. [Google Scholar]
- 21.Meyer TJ. Nature Chemistry. 2011;3:757–758. doi: 10.1038/nchem.1161. [DOI] [PubMed] [Google Scholar]
- 22.Artero V, Fontecave M. C. R. Chim. 2011;14:799–810. [Google Scholar]
- 23.Hocking RK, Brimblecombe R, Chang L-Y, Singh A, Cheah MH, Glover C, Casey WH, Spiccia L. Nature Chem. 2011;3:461–466. doi: 10.1038/nchem.1049. [DOI] [PubMed] [Google Scholar]
- 24.Brimblecombe R, Koo A, Dismukes GC, Swiegers GF, Spiccia L. J. Am. Chem. Soc. 2010;132:2892–2894. doi: 10.1021/ja910055a. [DOI] [PubMed] [Google Scholar]
- 25.Youngblood WJ, Lee SHA, Kobayashi Y, Hernandez-Pagan EA, Hoertz PG, Moore TA, Moore AL, Gust D, Mallouk TE. J. Am. Chem. Soc. 2009;131:926–927. doi: 10.1021/ja809108y. [DOI] [PubMed] [Google Scholar]
- 26.Zhao YX, Swierk JR, Megiatto JD, Sherman B, Youngblood WJ, Qin DD, Lentz DM, Moore AL, Moore TA, Gust D, Mallouk TE. Proc. Natl. Acad. Sci. USA. 2012;109:15612–15616. doi: 10.1073/pnas.1118339109. [DOI] [PMC free article] [PubMed] [Google Scholar]
- 27.Roy S, Shinde S, Hamilton GA, Hartnett HE, Jones AK. Eur. J. Inorg. Chem. 2011:1050–1055. [Google Scholar]
- 28.Sano Y, Onoda A, Hayashi T. Chem. Commun. 2011;47:8229–8231. doi: 10.1039/c1cc11157d. [DOI] [PubMed] [Google Scholar]
- 29.Sano Y, Onoda A, Hayashi T. J. Inorg. Biochem. 2012;108:159–162. doi: 10.1016/j.jinorgbio.2011.07.010. [DOI] [PubMed] [Google Scholar]
- 30.Walter MG, Warren EL, McKone JR, Boettcher SW, Mi Q, Santori EA, Lewis NS. Chem. Rev. 2010;110:6446–6473. doi: 10.1021/cr1002326. [DOI] [PubMed] [Google Scholar]
- 31.Odobel F, Pellegrin Y. Journal of Physical Chemistry Letters. 2013;4:2551–2564. [Google Scholar]
- 32.He JJ, Lindstrom H, Hagfeldt A, Lindquist SE. J. Phys. Chem. B. 1999;103:8940–8943. [Google Scholar]
- 33.Li L, Gibson EA, Qin P, Boschloo G, Gorlov M, Hagfeldt A, Sun LC. Adv. Mater. 2010;22:1759–1762. doi: 10.1002/adma.200903151. [DOI] [PubMed] [Google Scholar]
- 34.Nattestad A, Ferguson M, Kerr R, Cheng YB, Bach U. Nanotechnology. 2008;19 doi: 10.1088/0957-4484/19/29/295304. [DOI] [PubMed] [Google Scholar]
- 35.Sumikura S, Mori S, Shimizu S, Usami H, Suzuki E. J. Photochem. Photobiol. A. 2008;199:1–7. [Google Scholar]
- 36.Awais M, Gibson E, Vos JG, Dowling DP, Hagfeldt A, Dini D. Chemelectrochem. 2014;1:384–391. [Google Scholar]
- 37.Gibson EA, Awais M, Dini D, Dowling DP, Pryce MT, Vos JG, Boschloo G, Hagfeldt A. Phys. Chem. Chem. Phys. 2013;15:2411–2420. doi: 10.1039/c2cp43592f. [DOI] [PubMed] [Google Scholar]
- 38.Carey JR, Ma SK, Pfister TD, Garner DK, Kim HK, Abramite JA, Wang ZL, Guo ZJ, Lu Y. J. Am. Chem. Soc. 2004;126:10812–10813. doi: 10.1021/ja046908x. [DOI] [PubMed] [Google Scholar]
- 39.Ji Z, He M, Huang Z, Ozkan U, Wu Y. J. Am. Chem. Soc. 2013;135:11696–11699. doi: 10.1021/ja404525e. [DOI] [PubMed] [Google Scholar]
- 40.Mishra A, Fischer MKR, Bauerle P. Angew. Chem. Int. Ed. 2009;48:2474–2499. doi: 10.1002/anie.200804709. [DOI] [PubMed] [Google Scholar]
- 41.Lense S, Dutta A, Roberts JAS, Shaw WJ. Chem. Commun. 2014;50:792–795. doi: 10.1039/c3cc46829a. [DOI] [PubMed] [Google Scholar]
- 42.Zhang G, Musgrave CB. J. Phys. Chem. A. 2007;111:1554–1561. doi: 10.1021/jp061633o. [DOI] [PubMed] [Google Scholar]
- 43.Boschloo G, Hagfeldt A. J. Phys. Chem. B. 2001;105:3039–3044. [Google Scholar]
- 44.Weidelener M, Powar S, Kast H, Yu Z, Boix PP, Li C, Müllen K, Geiger T, Kuster S, Nüesch F, Bach U, Mishra A, Bäuerle P. Chemistry – An Asian Journal. 2014 doi: 10.1002/asia.201402654. n/a-n/a. [DOI] [PubMed] [Google Scholar]
- 45.Blanks were measured on the same sample before sensitization
- 46.Tong L, Iwase A, Nattestad A, Bach U, Weidelener M, Gotz G, Mishra A, Bauerle P, Amal R, Wallace GG, Mozer AJ. Energy Environ. Sci. 2012;5:9472–9475. [Google Scholar]
- 47.Qin P, Wiberg J, Gibson EA, Linder M, Li L, Brinck T, Hagfeldt A, Albinsson B, Sun L. The Journal of Physical Chemistry C. 2010;114:4738–4748. [Google Scholar]
- 48.Gibson EA, Smeigh AL, Le Pleux L, Fortage J, Boschloo G, Blart E, Pellegrin Y, Odobel F, Hagfeldt A, Hammarstrom L. Angew. Chem. Int. Ed. 2009;48:4402–4405. doi: 10.1002/anie.200900423. [DOI] [PubMed] [Google Scholar]
- 49.Morandeira A, Boschloo G, Hagfeldt A, Hammarström L. The Journal of Physical Chemistry B. 2005;109:19403–19410. doi: 10.1021/jp053230e. [DOI] [PubMed] [Google Scholar]
- 50.Le Pleux L, Smeigh AL, Gibson E, Pellegrin Y, Blart E, Boschloo G, Hagfeldt A, Hammarstrom L, Odobel F. Energy Environ. Sci. 2011;4:2075–2084. [Google Scholar]
- 51.Morandeira A, Boschloo G, Hagfeldt A, Hammarström L. The Journal of Physical Chemistry C. 2008;112:9530–9537. doi: 10.1021/jp053230e. [DOI] [PubMed] [Google Scholar]
- 52.Hamd W, Chavarot-Kerlidou M, Fize J, Muller G, Leyris A, Matheron M, Courtin E, Fontecave M, Sanchez C, Artero V, Laberty-Robert C. Journal of Materials Chemistry A. 2013;1:8217–8225. doi: 10.1039/C3TA10728K. [DOI] [PMC free article] [PubMed] [Google Scholar]
- 53.Li L, Duan LL, Wen FY, Li C, Wang M, Hagfeld A, Sun LC. Chem. Commun. 2012;48:988–990. doi: 10.1039/c2cc16101j. [DOI] [PubMed] [Google Scholar]
- 54.Gao Y, Ding X, Liu JH, Wang L, Lu ZK, Li L, Sun LC. J. Am. Chem. Soc. 2013;135:4219–4222. doi: 10.1021/ja400402d. [DOI] [PubMed] [Google Scholar]
- 55.Varma S, Castillo CE, Stoll T, Fortage J, Blackman AG, Molton F, Deronzier A, Collomb MN. Phys. Chem. Chem. Phys. 2013;15:17544–17552. doi: 10.1039/c3cp52641k. [DOI] [PubMed] [Google Scholar]
- 56.Andreiadis ES, Jacques PA, Tran PD, Leyris A, Chavarot-Kerlidou M, Jousselme B, Matheron M, Pecaut J, Palacin S, Fontecave M, Artero V. Nature Chemistry. 2013;5:48–53. doi: 10.1038/nchem.1481. [DOI] [PubMed] [Google Scholar]
- 57.Gottlieb HE, Kotlyar V, Nudelman A. J. Org. Chem. 1997;62:7512–7515. doi: 10.1021/jo971176v. [DOI] [PubMed] [Google Scholar]
- 58.O’Reilly JE. Biochim. Biophys. Acta. 1973;292:509–515. doi: 10.1016/0005-2728(73)90001-7. [DOI] [PubMed] [Google Scholar]
- 59.Parker VD, Handoo KL, Roness F, Tilset M. J. Am. Chem. Soc. 1991;113:7493–7498. [Google Scholar]
- 60.Neese F. The ORCA program system. WIREs Comput Mol Sci. 2012;2:73–78. [Google Scholar]
- 61.Becke AD. Phys. Rev. A. 1988;38:3098–3100. doi: 10.1103/physreva.38.3098. [DOI] [PubMed] [Google Scholar]
- 62.Lee C, Yang W, Parr RG. Phys. Rev. B. 1988;37:785–789. doi: 10.1103/physrevb.37.785. [DOI] [PubMed] [Google Scholar]
- 63.Weigend F, Ahlrichs R. Phys. Chem. Chem. Phys. 2005;7:3297–3305. doi: 10.1039/b508541a. [DOI] [PubMed] [Google Scholar]
- 64.Sinnecker S, Rajendran A, Klamt A, Diedenhofen M, Neese F. J. Phys. Chem. A. 2006;110:2235–2245. doi: 10.1021/jp056016z. [DOI] [PubMed] [Google Scholar]
- 65.Humphrey W, Dalke A, Schulten K. J. Molec. Graphics. 1996;14:33–38. doi: 10.1016/0263-7855(96)00018-5. [DOI] [PubMed] [Google Scholar]
- 66.R Development Core Team . R: A Language and Environment for Statistical Computing. Vienna, Austria: 2012. http://www.R-project.org/ [Google Scholar]
- 67.Bräutigam M, Schulz M, Inglis J, Popp J, Vos JG, Dietzek B. Phys. Chem. Chem. Phys. 2012;14:15185–15190. doi: 10.1039/c2cp42938a. [DOI] [PubMed] [Google Scholar]
- 68.Bräutigam M, Weyell P, Rudolph T, Dellith J, Krieck S, Schmalz H, Schacher FH, Dietzek B. Journal of Materials Chemistry A. 2014;2:6158–6166. [Google Scholar]
- 69.Giebeler E, Stadler R. Macromol. Chem. Phys. 1997;198:3815–3825. [Google Scholar]


