Abstract
Adaptation by natural selection depends on the rates, effects, and interactions of many mutations, making it difficult to determine what proportion of mutations in an evolving lineage are beneficial. We analysed 264 complete genomes from 12 Escherichia coli populations to characterize their dynamics over 50,000 generations. The populations that retained the ancestral mutation rate support a model where most fixed mutations are beneficial, the fraction of beneficial mutations declines as fitness rises, and neutral mutations accumulate at a constant rate. We also compared these populations to mutation-accumulation lines evolved under a bottlenecking regime that minimizes selection. Nonsynonymous mutations, intergenic mutations, insertions, and deletions are overrepresented in the long-term populations, further supporting the inference that most mutations that reached high frequency were favoured by selection. These results illuminate the shifting balance of forces that govern genome evolution in populations adapting to a new environment.
Comparative genomic studies have identified the molecular basis of adaptations including lactase permanence in humans1, domestication of plants2 and animals3, and pathogenicity in bacteria4. Nevertheless, it is difficult to determine more generally what fraction of new mutations in an evolving lineage are beneficial. Answering this question is important for modelling sequence changes used in phylogenetic methods5 and would inform debate about adaptive and nonadaptive modes of genome evolution6,7.
The combination of experimental evolution and genome sequencing provides a way forward that has been used with viruses, bacteria, yeast, and flies8–13. In a study of bacteria, the diversity of mutations involved in adaptation to high-temperature stress was studied by sequencing >100 lineages after a 2000-generation experiment10. In another study, sequencing a series of clones from one population over 40,000 generations showed the trajectory of genome evolution9. However, a short-term experiment reveals only the early steps of adaptation, and it is difficult to distinguish adaptive “driver” and nonadaptive “passenger” mutations when only one population is examined. Beneficial mutations can also be identified by lineage tracking14 and genetic reconstruction15 experiments, but these approaches become impractical after an initial selective sweep or when mutations become too numerous over time, respectively.
To overcome these limitations, we analysed complete genomes of 264 clones from 12 populations across 50,000 generations of the long-term evolution experiment (LTEE) with Escherichia coli16,17. These populations have evolved in a defined medium with scarce resources since 1988. Mean fitness measured in competition with their ancestor increased by ~70% in that time17. The LTEE is a model system for studying many fundamental evolutionary questions9,15–23.
Genome-wide mutations and hypermutability
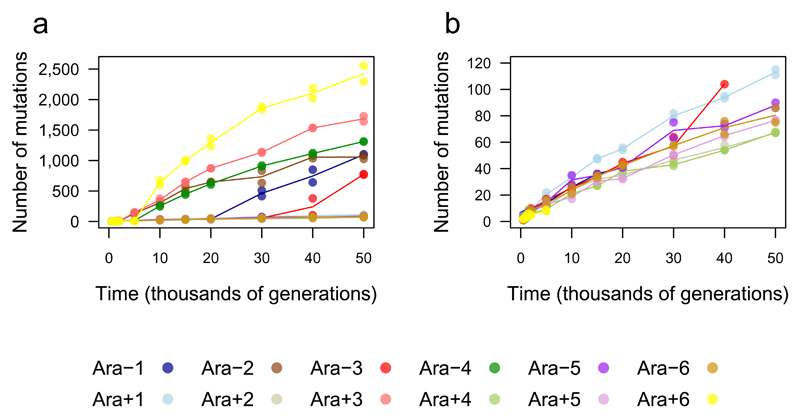
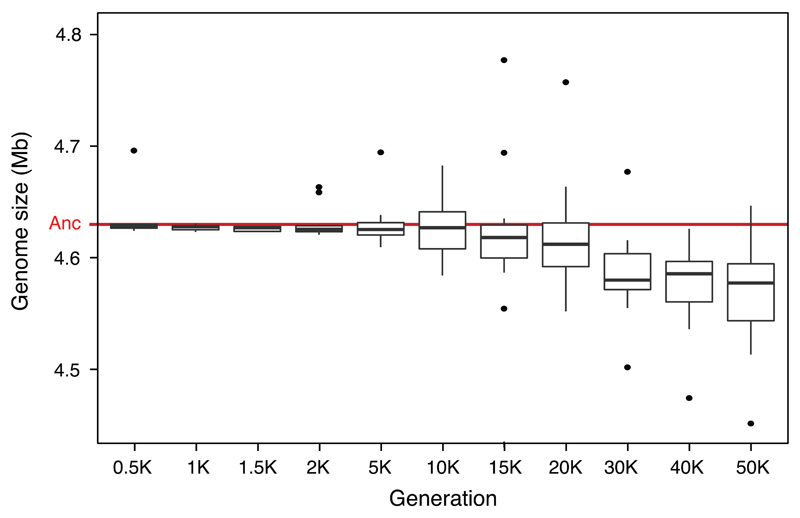
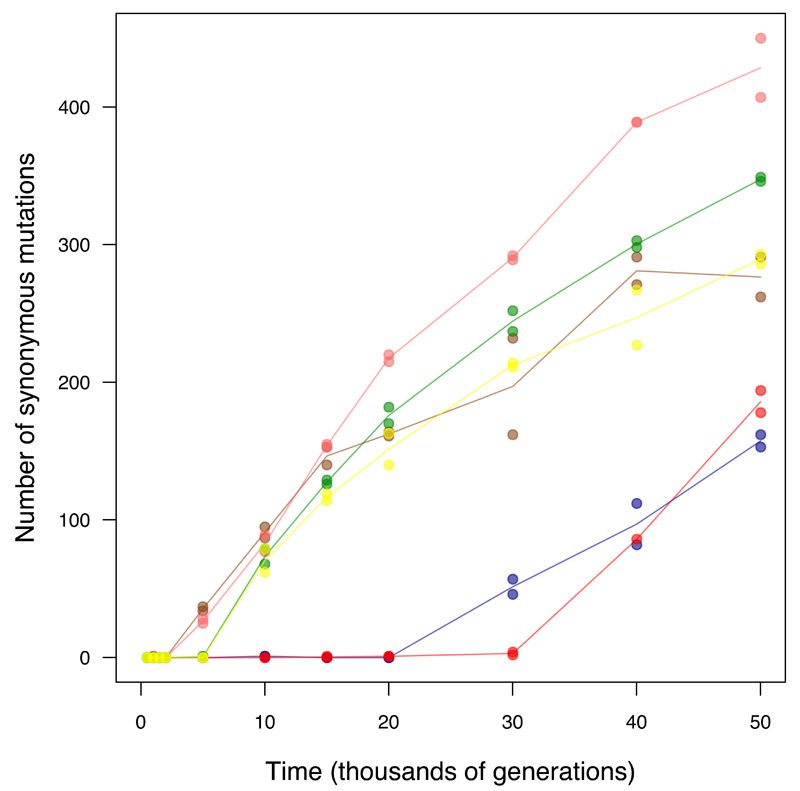
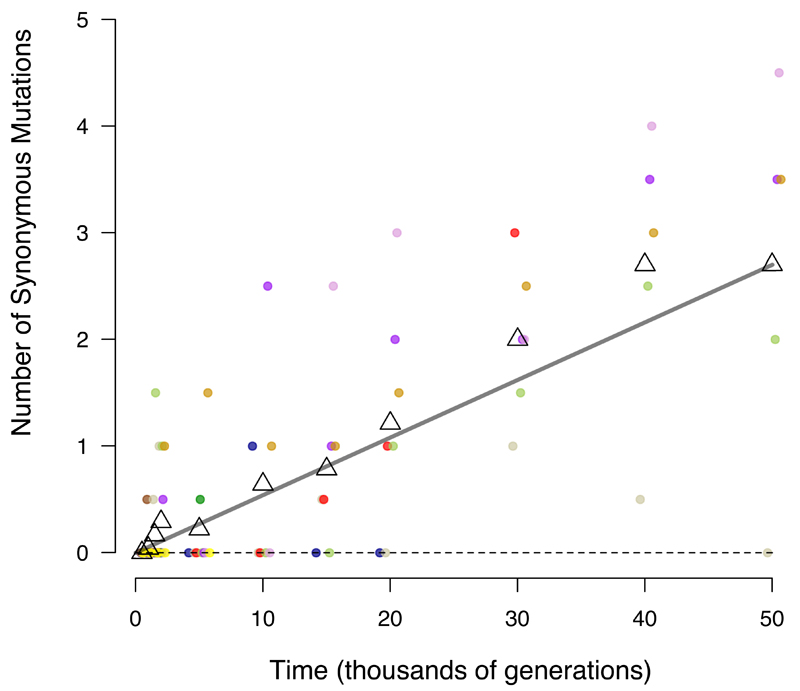
We sequenced the genomes of 2 clones from each population after 500, 1000, 1500, 2000, 5000, 10,000, 15,000, 20,000, 30,000, 40,000 and 50,000 generations using the Illumina platform (Supplementary Data 1). We called mutations, including structural variants, using the breseq pipeline24,25. In total, we found 14,572 point mutations; 500 insertions of IS (insertion sequence) elements; 726 deletions and 1132 insertions each ≤50 bp (small indels); and 267 deletions and 45 duplications each >50 bp (large indels). After 50,000 generations, average genome length declined by 63 kbp (~1.4%) relative to the ancestor (Extended Data Fig. 1). Mutations were not distributed uniformly across the populations. Instead, six populations (Ara–1, Ara–2, Ara–3, Ara–4, Ara+3 and Ara+6) had 96.5% of the point mutations, having evolved hypermutable phenotypes caused by mutations that affect DNA repair or removal of oxidized nucleotides18,20. Fig. 1a shows the trajectories for the total mutations in all 12 populations; Fig. 1b is rescaled for better resolution of those that did not become point-mutation mutators. Hypermutability tended to decline over time as the load of deleterious mutations favoured antimutator alleles20. All four populations that were hypermutable at 10,000 generations accumulated synonymous substitutions (a proxy for the underlying point-mutation rate) between generations 40,000 and 50,000 at much lower rates than from 10,000 to 20,000 generations (Extended Data Fig. 2).
Figure 1. Total number of mutations over time in the 12 LTEE populations.
a, Total mutations in each population. b, Total mutations rescaled to reveal the trajectories for the six populations that did not become hypermutable for point mutations, and for the other six before they evolved hypermutability. Each symbol shows a sequenced genome; some points are hidden behind others. Each line passes through the average of the genomes from the same population and generation.
Increased numbers of IS elements can also cause hypermutability26, with higher rates not only of transpositions but also deletions and duplications through homologous recombination. In population Ara+1, 31.8% of all mutations through 50,000 generations were IS150 insertions, compared with 12.3% for the other populations that never evolved elevated point-mutation rates. This mode of hypermutability arose early in Ara+1; IS150 insertions are overrepresented in each Ara+1 clone from 5,000 generations onward when compared individually to all other nonmutator clones from the same generation (Fisher’s exact test with Bonferroni correction, p < 0.05). Two clones from other populations were also IS150 hypermutators by this test: 38.7% of the mutations in a 30,000-generation clone from Ara–5 and 31.7% of the mutations in a 40,000-generation clone from Ara–3 were IS150 insertions. The aberrant Ara–5 clone shares only one mutation with other sequenced Ara–5 clones, indicating early divergence; it does not share point mutations with any other population, excluding cross-contamination. The emergence of these various mutator types shows that evolution can alter the production of genetic diversity20,27, which in turn changes the tempo and mode of genome evolution.
Population phylogenies
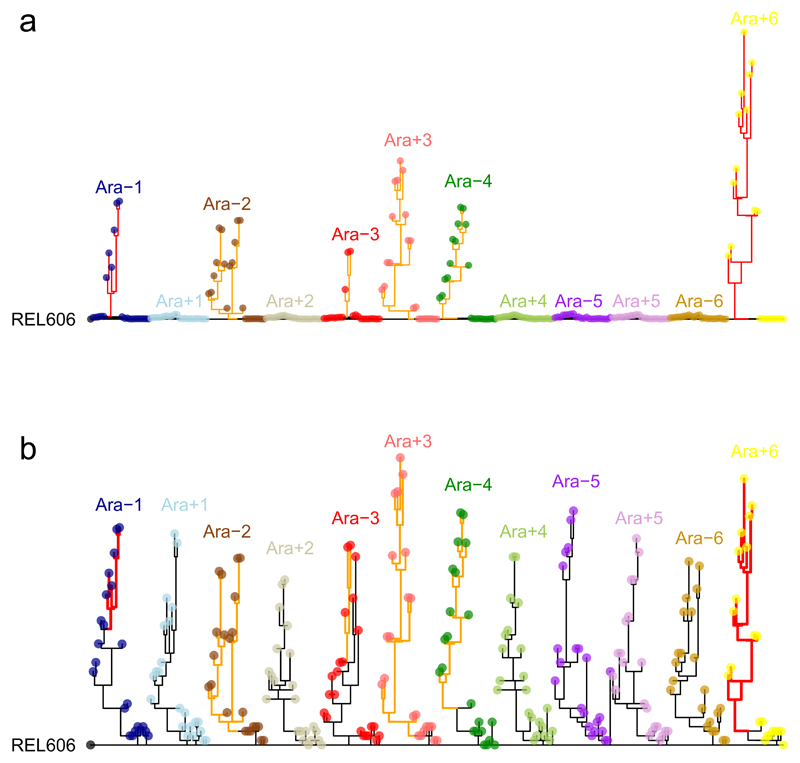
Fig. 2a shows phylogenetic trees constructed using point mutations for each population; Fig. 2b shows the trees with branches rescaled after mutators evolved. Some populations—including Ara–2, which became hypermutable early, and Ara–6, which never did—harbour lineages that coexisted for tens of thousands of generations. Some others—including Ara–4, which became hypermutable, and Ara+2, which did not—are more linear in structure, without deep branches among the sequenced clones. Deep branches were likely supported by the diversity-promoting effects of negative frequency-dependent interactions, as shown in the Ara–2 population22,23. Sequencing whole-population samples would provide more detailed information on within-population diversity11,12.
Figure 2. Phylogenetic trees for LTEE populations.
a, Phylogenies for 22 genomes from each population, based on point mutations. b, The same trees, except branches are rescaled as followed: branches for lineages with mismatch-repair defects are orange and shortened by a factor of 25; branches for mutT mutators are red and shortened by a factor of 50. Strain REL606 (at left) is the ancestor. No early mutations are shared between any populations, confirming their independent evolution. Most populations have multiple basal lineages that reflect early diversification and extinction; some have deeply divergent lineages with sustained persistence, most notably Ara−2.
Dynamics of genome evolution
The accumulation of point mutations increased greatly in hypermutable populations9,19,20, potentially overwhelming the genomic signature of adaptation. Although mutator lineages may experience higher rates of fitness improvement17,27, the effect is usually small owing to clonal interference between competing beneficial mutations28,29 and the increased load of deleterious mutations20,30. Therefore, beneficial mutations become harder to detect in a sea of unselected mutations in mutator lineages. To better understand the dynamic coupling between adaptation and genome evolution, we first analysed the populations that retained the ancestral mutation rate through 50,000 generations and the others before they became point-mutation or IS150 mutators.
Wiser et al.17 found the LTEE’s mean-fitness trajectory is well described by a power-law relation, in which log fitness increases linearly with log time. Moreover, the power law accurately predicts fitness to 50,000 generations using data from only the first 5,000 generations. Wiser et al. showed that a population-dynamical model that incorporates two phenomena known to be important in the LTEE—clonal interference29,31 and diminishing-returns epistasis15,29—generates a power-law relation. This model in turn predicts that the number of beneficial mutations should increase with the square root of time17. However, not all mutations that accumulate are beneficial; neutral and nearly neutral mutations can spread by recurring mutation, random drift, and hitchhiking32–34. Selective sweeps will purge some neutral mutations but cause others to increase; overall, the expected number of neutral mutations should increase linearly with time35.
To test these predictions, we fit three models to the trajectory for the total number of mutations in the nonmutator and premutator lineages:
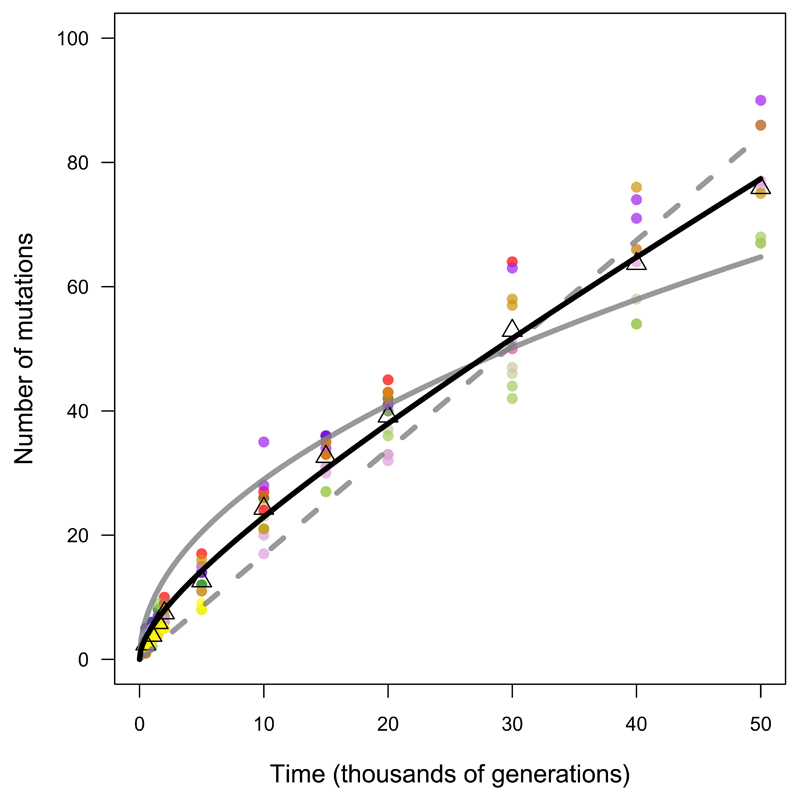
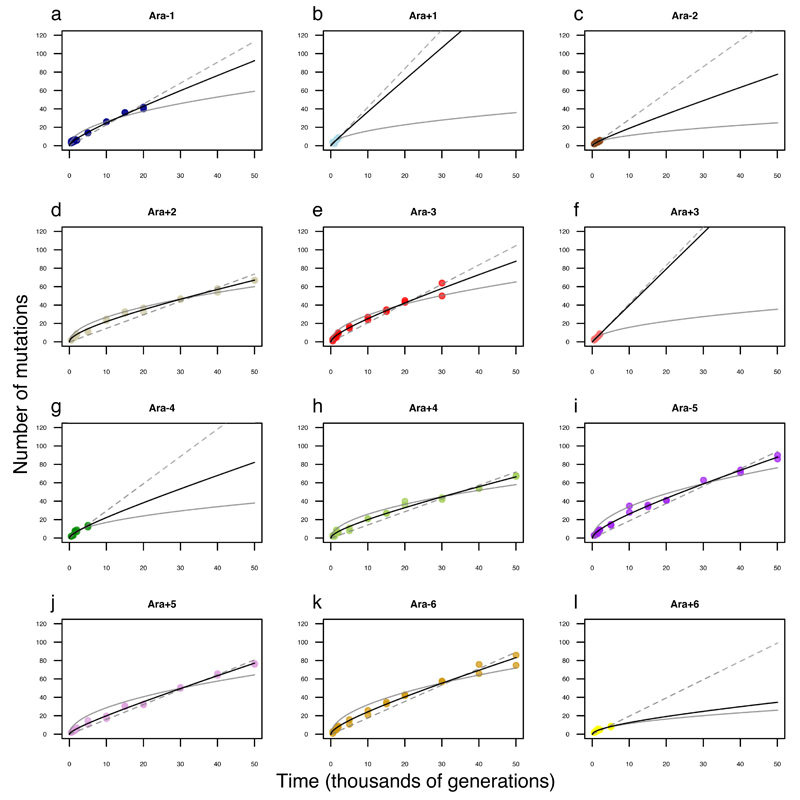
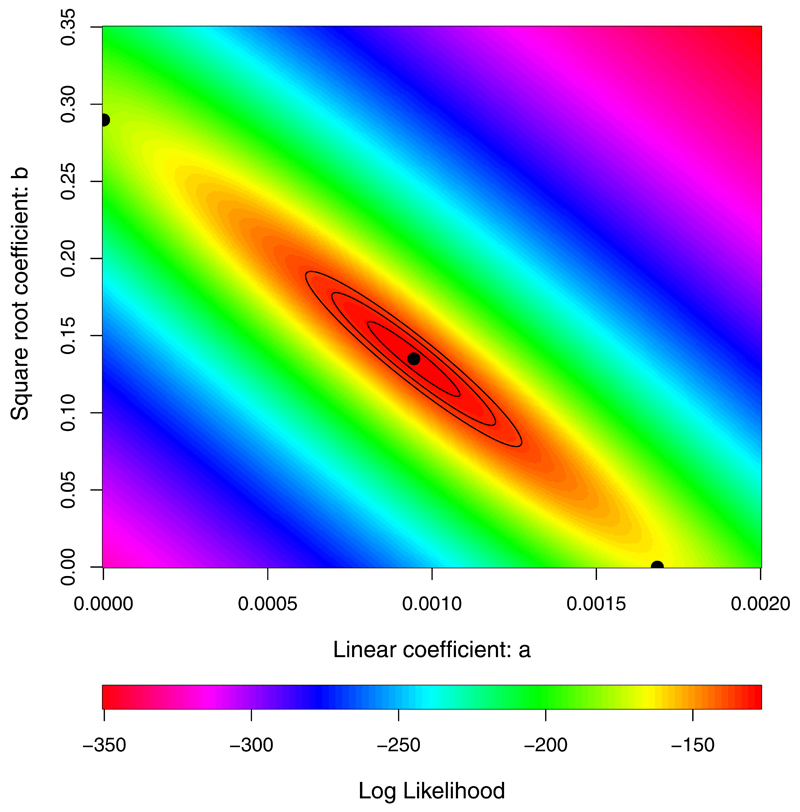
where m is the number of mutations, t is time (generations), and a and b govern the genome-wide rates of accumulation of neutral and beneficial mutations, respectively (Fig. 3). (Extended Data Fig. 3 shows the models fit to each population separately.) Using the Akaike information criterion (AIC), the two-parameter model fits the data much better than those with only the linear (ΔAIC = −77.7) or square-root (ΔAIC = −99.7) terms. Because the one-parameter models are nested within the two-parameter model, we can also assess the significance of adding the second parameter; p-values are 7.5 × 10⁻⁵ and 5.2 × 10⁻⁷ relative to the linear and square-root models, respectively. The trajectory for genome evolution thus shows signatures of both adaptive and nonadaptive changes. However, the model that predicts the square-root trajectory of beneficial substitutions makes various assumptions (e.g., about the form of epistasis), and both the predicted and observed trajectories have statistical uncertainties. (Extended Data Fig. 4 shows the uncertainty in estimating a and b from the observed trajectory.) Therefore, we examined additional evidence to shed light on the proportion and identity of beneficial mutations.
Figure 3. Alternative models fit to the trajectory of genome evolution.
Each symbol shows total mutations in a clone from five populations that never became mutators and seven before point-mutation or IS150 hypermutability evolved. Colours are the same as in Figure 1; open triangles indicate grand means. Dashed grey line shows the best fit to the linear model, m = at. Solid grey curve shows the fit to the square-root model, m = b sqrt(t). Black curve is fit to the composite model, m = at + b sqrt(t), where a = 0.000944 and b = 0.134856. See text for statistical analysis.
Evidence for beneficial mutations
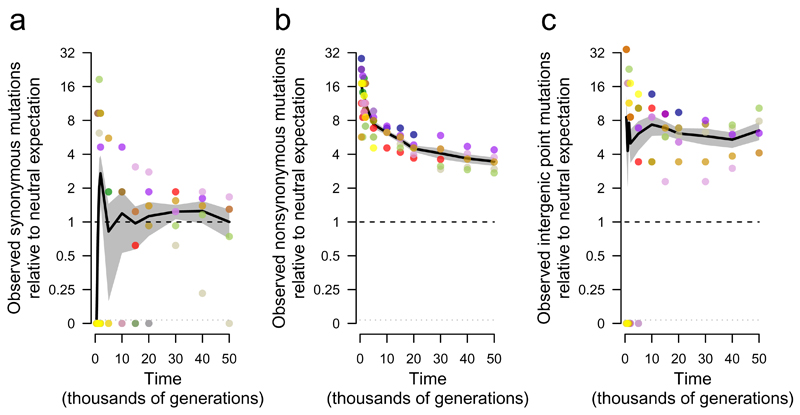
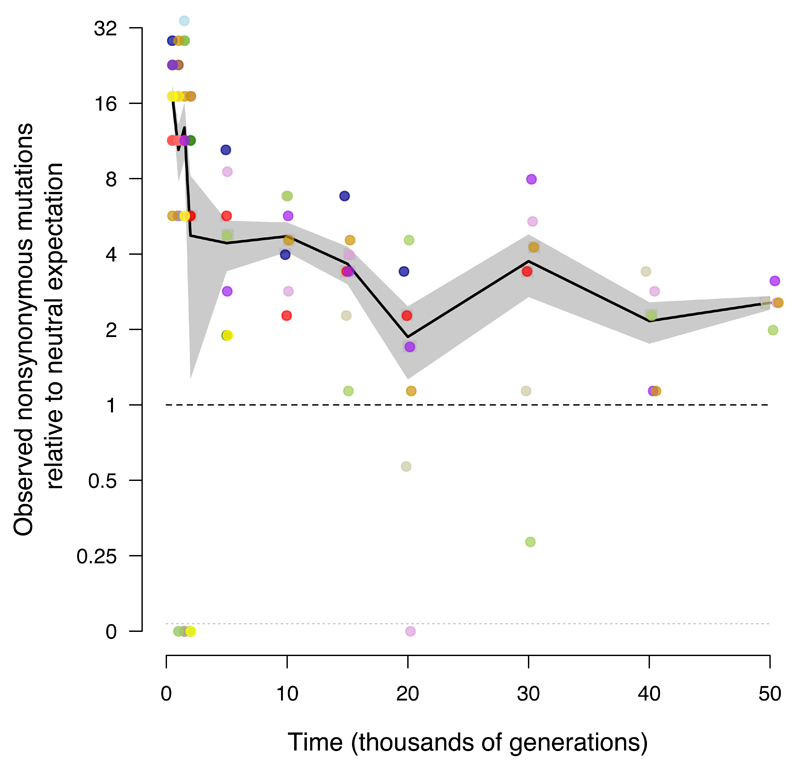
What proportion of the genomic changes in the nonmutator populations was adaptive, and how did it change over time? One line of evidence derives from the expectation that synonymous substitutions—point mutations in protein-coding genes that do not affect the amino-acid sequence—are neutral and should therefore accumulate at a rate equal to the underlying mutation rate20,35. This expectation is not strictly true owing to selection on codon usage, RNA folding, and other effects, but it is generally thought that such selection is extremely weak, affects only a small fraction of sites at risk for synonymous mutations, or both36,37. We calculate whether nonsynonymous and intergenic point mutations are found in excess relative to synonymous mutations, given the number of sites at risk for each class. Fig. 4a shows the number of synonymous mutations in nonmutator and premutator populations, scaled so the mean at 50,000 generations is unity. As expected, synonymous mutations accumulated at an approximately constant rate (Extended Data Fig. 5). Fig. 4b shows the number of nonsynonymous mutations relative to the neutral expectation based on synonymous mutations. Nonsynonymous mutations accumulated ~17.1 times faster than synonymous ones during the first 500 generations and ~3.4 times faster over 50,000 generations. Nonsynonymous mutations continued to accumulate at over twice the rate of synonymous mutations in the later generations (Extended Data Fig. 6), implying that most nonsynonymous mutations that reached high frequency were beneficial even after so long in a constant environment. The same approach applied to intergenic point mutations (Fig. 4c) also reveals a large excess relative to synonymous mutations, although the number of events is smaller and the uncertainty greater. This result implicates adaptive changes in noncoding regions that presumably affect the binding sites for regulatory proteins38–40.
Figure 4. Trajectories for synonymous, nonsynonymous, and intergenic point mutations.
a, Synonymous mutations, scaled so mean of five nonmutator populations (excluding point-mutation and IS150 hypermutators) is unity at 50,000 generations. b, Nonsynonymous mutations, scaled using same rate as synonymous mutations after adjusting for sites at risk for both classes. c, Intergenic point mutations, scaled using same rate as synonymous mutations after adjusting for sites at risk. Each symbol shows the mean for sequenced genomes from a nonmutator or premutator lineage. Colours are as in Figure 1. Note discontinuous scale; populations with zero mutations are plotted below. Black lines connect grand means; shading shows standard errors calculated from replicate populations.
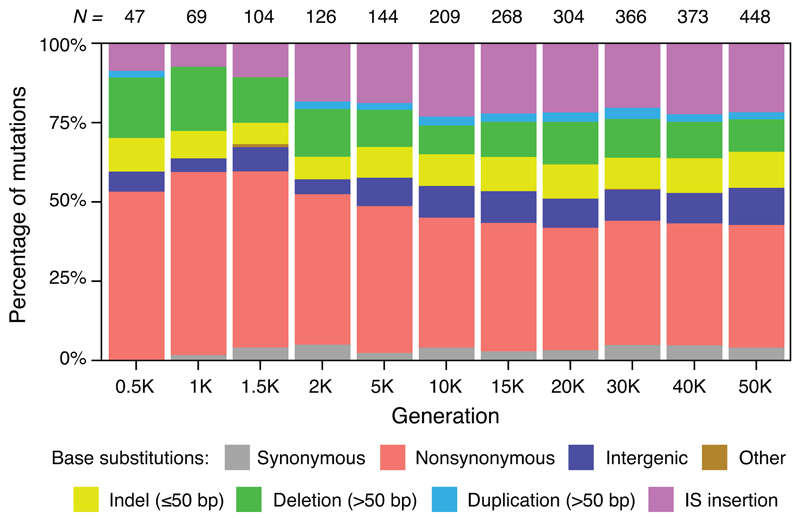
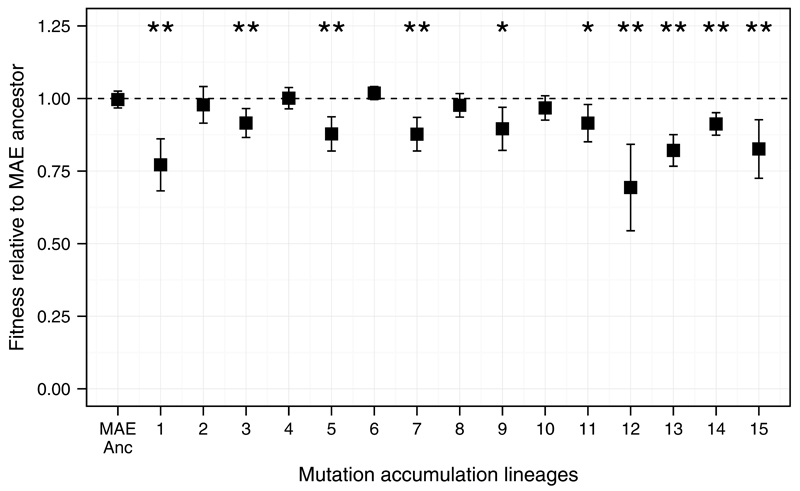
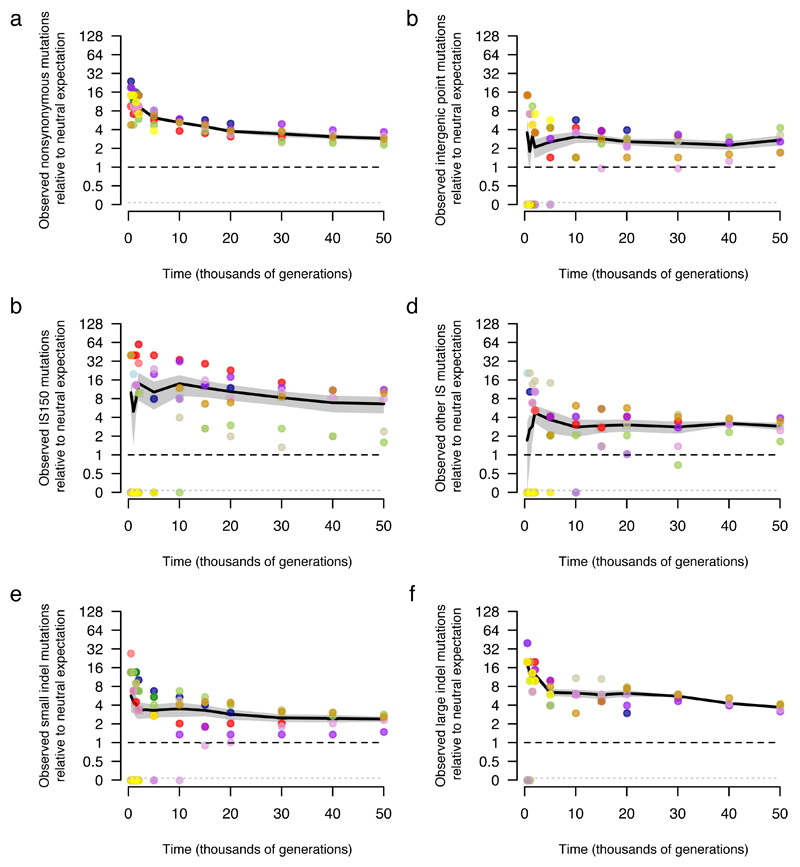
Synonymous mutations provide an internal benchmark for nonsynonymous and intergenic point mutations. However, synonymous mutations are not directly informative for understanding how selection affects the accumulation of insertions and deletions that comprise almost half the mutations in nonmutator clones at 50,000 generations (Extended Data Fig. 7). To estimate the proportion of beneficial changes for other types of mutation, we compare the LTEE and a Mutation Accumulation Experiment (MAE) in which 15 lines were propagated via repeated single-cell bottlenecks41. Such bottlenecks eliminate the variation needed for natural selection, so that all types of mutations accumulate at the rates at which they happen, regardless of fitness effects, except for lethal or highly deleterious mutations that preclude cells from making colonies used to propagate lines29. MAE lines thus provide an external baseline for distinguishing beneficial and nonbeneficial mutations. In fact, because more unselected mutations are deleterious than beneficial, MAE lines are expected to lose fitness over time, which they did (Extended Data Fig. 8).
To quantify the relative rates for all types of mutations in the absence of selection, we sequenced clones from the MAE lines after 550 daily bottlenecks (Supplementary Data 1). Consistent with the random accumulation of mutations, the number of nonsynonymous (including nonsense) mutations was similar to the expectation based on synonymous mutations (117 observed, 105.02 expected); the resulting ratio of 1.11 is well within the 95% confidence interval (0.70–1.50) obtained by a randomization test. Also, there was no among-line variation in total mutations (χ2 = 5.46, df = 14, p = 0.978). We can therefore reasonably use the MAE lines to estimate relative rates of different types of mutations, with synonymous ones providing a benchmark largely free of selection in both experiments. For example, LTEE population Ara–1 had 21 nonsynonymous mutations at 20,000 generations and the expected number of synonymous mutations based on the average nonmutator population was 1.08 (Extended Data Fig. 5); the 15 MAE lines in total had 117 nonsynonymous and 39 synonymous mutations; thus, the ratio of observed mutations to the neutral expectation is (21/1.08)/(117/39) = 6.5. These ratios show that all major classes of mutations—including various insertions and deletions—are substantially overrepresented in the LTEE relative to the MAE (Extended Data Fig. 9), implying that many mutations in each class were adaptive during the LTEE.
Parallel evolution at many gene loci
Parallel evolution occurs when similar changes arise independently in multiple lineages, and it is often used to discover putative targets of selection4,8,10–13,21. Genetic parallelism can be studied at the level of DNA sequence, affected genes, or integrated functions. Parallelism at the nucleotide level tends to be rare because different mutations in a gene often produce similar benefits4,10–12,21, although there are exceptions8. Parallelism at a functional level requires detailed understanding that may be unavailable, and it is difficult to interpret when there are many mutations. We therefore examined parallelism at the gene level.
We focused on lineages that retained the ancestral point-mutation rate (including clones from populations that later became hypermutable) because, as shown above, most mutations are drivers in those cases; we expect hypermutability to make the analysis less informative because many more mutations are passengers. We first calculated the expected number of nonsynonymous mutations for each single-copy protein-coding gene based on its length as a fraction of all such genes and the total number of nonsynonymous mutations in the relevant lineages (Supplementary Data 2). We computed G scores for goodness-of-fit between observed and expected values; the total score is 2592.9. We compared that total with simulated datasets where positions of mutations in the coding genome were randomized, and the observed total significantly exceeded the simulations (mean simulated G = 1933.7, Z = 25.5, p < 10−144). Fifty-seven genes had two or more mutations; these genes had 50.1% of the nonsynonymous mutations but constituted only 2.1% of the coding genome. (Only one gene had multiple synonymous changes.) Table 1 shows the 15 genes that contribute the most to the total G score. Several encode proteins with core metabolic or regulatory functions, including three involved in peptidoglycan synthesis.
Table 1. Protein-coding genes with the highest G scores.
| Genec |
Length |
Observed |
Expected |
G |
Annotation |
|---|---|---|---|---|---|
| pykF | 1413 | 19 | 0.16 | 180 | pyruvate kinase |
| iclR | 825 | 13 | 0.10 | 128 | transcriptional repressor, glyoxylate bypass |
| spoT | 2109 | 14 | 0.25 | 113 | stringent response |
| nadR | 1233 | 12 | 0.14 | 106 | bifunctional transcriptional repressor and NMN adenylyltransferase |
| hslU | 1332 | 11 | 0.16 | 94 | molecular chaperone and ATPase component of protease |
| yijC (fabR) | 705 | 7 | 0.08 | 62 | transcriptional repressor, fatty acid and phosphatidic acid pathway |
| topA | 2598 | 8 | 0.30 | 52 | DNA topoisomerase I subunit |
| malT | 2706 | 8 | 0.32 | 52 | transcriptional activator, maltotriose-ATP-binding |
| mrdA | 1902 | 7 | 0.22 | 48 | transpeptidase in peptidoglycan synthesis |
| mreB | 1044 | 6 | 0.12 | 47 | longitudinal peptidoglycan synthesis |
| infB | 2673 | 7 | 0.31 | 44 | translation initiation factor IF-2 |
| arcA | 717 | 5 | 0.08 | 41 | response regulator in two-component system, anoxic redox control |
| argR | 471 | 4 | 0.05 | 34 | repressor of arginine regulon |
| rplF | 534 | 4 | 0.06 | 33 | 50S ribosomal subunit protein |
| mreC | 1103 | 4 | 0.13 | 28 | longitudinal peptidoglycan synthesis |
Genes are ranked by G scores computed using observed independent nonsynonymous mutations relative to expected number given gene length (bp). The parenthetical gene name is a synonym. Data are from populations with the ancestral point-mutation rate throughout and other populations before they evolved hypermutability.
We ran the same analysis for lineages that evolved hypermutability (Supplementary Data 3), and the randomization test indicates significant parallelism (G statistic = 5098.4, mean simulated G = 4581.1, Z = 5.745, p < 10−8). As expected, however, the signal-to-noise ratio reflected in the significance level is much weaker than for the nonmutator lineages. Most genes with the highest scores in mutator lineages differ from those in nonmutators, in part because those genes often had beneficial mutations before hypermutability evolved.
Table 2 lists the 16 genes with the most deletions, duplications, insertions, and intergenic point mutations in nonmutator lineages (Supplementary Data 2). For mutations that impact multiple genes, we show the most frequently affected gene (or adjacent pair when most events are intergenic). In 12 cases, the majority of the mutations were mediated by IS elements; these include insertions as well as deletions and duplications that appear to involve homologous recombination. In six cases (five with IS insertions), the same or nearly identical mutations occurred in one or more MAE lines, suggesting mutational hotspots. These changes may indicate high-frequency events, but recall that IS insertions and large indels are enriched in the LTEE relative to the MAE (Extended Data Fig. 9), implying that many are also beneficial. Indeed, the IS-mediated rbsD deletions occur at a high rate and are beneficial in the LTEE environment42, and some IS-mediated mutations appear to be beneficial in other studies as well43,44.
Table 2. Genes with the most deletions, duplications, insertions, and intergenic point mutations.
| Genes |
Mutations |
Number |
IS |
MAE |
Annotation |
|---|---|---|---|---|---|
| rbsD | mostly large deletions | 41 | yes | no | D-ribose utilization; most deletions affect entire rbs operon |
| nupC | various intergenic | 19 | yes | yes | nucleoside transporter |
| iap | mostly large indels | 19 | yes | no | alkaline-phosphatase isozyme conversion; most indels affect tens of adjacent genes including rpoS, which encodes stationary-phase σ factor |
| mokB | various indels | 17 | yes | yes | enables hokB toxin expression |
| yhgI/gntT | intergenic point mutations | 16 | no | no | gluconate transport |
| mokC | various indels | 15 | yes | yes | enables hokC toxin expression |
| ybcU (borD) | large indels | 14 | yes | no | indels affect this and adjacent remnants of DLP12 prophage |
| ECB_02013 | various indels | 14 | no | yes | indels affect this and adjacent remnants of P2-like prophage |
| ECB_02816(kpsD) | various indels | 14 | yes | no | polysialic-acid transport protein precursor |
| acs/nrfA | various intergenic | 14 | no | no | acetyl-CoA synthase; nitrite reductase |
| hokE | large indels | 12 | yes | no | toxin in plasmid-derived toxin-antitoxin system; most indels affect several adjacent genes involved in iron acquisition |
| ybeB/phpB | various intergenic | 11 | yes | no | unknown functions, but adjacent to genes involved in cell-wall synthesis |
| ydiJ/ydiK | various intergenic | 11 | no | no | predicted FAD-linked oxidoreductase; putative inner membrane protein |
| ldrC | various indels | 10 | yes | yes | small toxic polypeptide |
| menC | IS insertions | 10 | yes | yes | menaquinone biosynthesis |
| fimA | mostly IS insertions | 10 | yes | no | component of fimbrial complex |
Genes are ranked by total mutations excluding nonsynonymous and synonymous point mutations. When two genes are separated by a slash, the affected sequence includes the intergenic region between them. Parenthetical gene names are synonyms. IS column indicates whether the majority of mutations involve IS elements. MAE column indicates whether the same or nearly identical mutations occurred in one or more MAE lines. Data are from populations with the ancestral point-mutation rate throughout and others before they evolved hypermutability.
The parallelisms involving nonsynonymous substitutions and other mutations in the LTEE, coupled with their high rates of accumulation relative to the MAE, indicate that many observed mutations were drivers of adaptation. For insertions and deletions, however, the specific target genes are difficult to identify owing to the multiplicity of genes affected and the potentially confounding effect of mutational hotspots.
Discussion
Adaptation by natural selection sits at the heart of phenotypic evolution. However, the random processes of spontaneous mutation and genetic drift often overwhelm and obscure genomic signatures of adaptation. We overcame this difficulty by analysing genomes from twelve bacterial populations that evolved for 50,000 generations under identical culture conditions. Even so, six populations evolved hypermutable phenotypes that increased point-mutation rates ~100-fold, and another evolved hypermutability caused by a transposable element. By focusing on populations that retained the ancestral mutation rate, we identified several key features of the tempo and mode of their genome evolution. First, a population-genetic model with two terms—one for beneficial drivers, the other for neutral hitchhikers—fits the dynamics much better than models without both terms. Second, the great majority of mutations observed during the early generations were beneficial drivers. Third, the proportion of observed mutations that were beneficial declined over time but remained substantial even after 50,000 generations. The second and third findings follow from the population-genetic model. Both are also strongly supported by the excess of nonsynonymous to synonymous substitutions in the LTEE and by the excess of several classes of mutations, including insertions and deletions, in comparison to mutation-accumulation lines. Fourth, there was strong gene-level parallel evolution across the replicate LTEE populations.
Our analyses also show a contrast between the contributions of beneficial mutations to molecular evolution and to the fitness trajectory in a stable environment. In particular, beneficial mutations continued to constitute a large fraction of genetic changes throughout the LTEE’s 50,000 generations, whereas the resulting fitness gains were only a few per cent in the last 10,000 generations17. Beneficial mutations with very small selection coefficients are nonetheless visible to natural selection17. Hence, adaptation can remain a major driver of molecular evolution long after an environmental shift. Our experimental results thus support a selectionist view of molecular evolution, complementing indirect evidence based on comparative genomics in bacteria, Drosophila, and humans45–47. Of course, the LTEE may differ from many natural populations in important respects including its low mutation rate, the absence of sex or horizontal gene transfer, and a stable environment. As we showed, high mutation rates tend to obscure the role of selection in molecular evolution. The effects of horizontal gene transfer48 and variable environments49,50 on the dynamic coupling of genomic and adaptive evolution should also be examined further. Long-term experiments with microorganisms provide opportunities for rigorous analyses of these issues.
Methods
Long-term evolution experiment
The LTEE has 12 populations founded from two almost identical strains of Escherichia coli. Six populations, designated Ara–1 to Ara–6, started from REL606, a descendant of the B strain of Luria and Delbrück51–53. The other six, Ara+1 to Ara+6, derive from REL607, which differs from REL606 by point mutations in araA and recD. The mutation in araA was selected prior to starting the LTEE; it confers the ability to grow on L-arabinose, which provides a marker in competition assays used to measure fitness16,17. The recD mutation arose inadvertently before starting the LTEE. The LTEE began in 1988, and the populations have been propagated (with occasional interruptions) at 37°C by daily 100-fold dilutions in 10 mL Davis minimal medium with 25 μg/mL glucose (http://lenski.mmg.msu.edu/ecoli/dm25liquid.html). The regrowth allows ~6.67 generations per day; the population size fluctuates between ~3 × 10⁶ and ~3 × 10⁸ cells except in population Ara–3, which has had a population size several times larger since ~33,000 generations, when cells gained the ability to consume the citrate that is also present in the medium19,54. Whole-population samples are taken every 75th transfer (500 generations) and stored with glycerol as a cryoprotectant at –80°C, where they are available for later analysis. Here we analysed the genomes of two clones sampled from each population at 500, 1000, 1500, 2000, 5000, 10,000, 15,000, 20,000, 30,000, 40,000, and 50,000 generations (Supplementary Data 1). We deliberately included clones from the deeply diverged lineages in population Ara–2 from 20,000 generations onward and both the majority Cit+ lineage and the minority Cit− lineage in population Ara–3 at generation 40,000. This sampling scheme does not affect inferences about the rates and patterns of genome evolution because both populations were hypermutable at these time points and thus excluded from the main analyses. These clones were included to illustrate diversity within populations, although we also found previously unknown cases of divergent lineages.
Mutation-accumulation experiment
The 15 MAE lines analysed here started from strain REL1207, which is an Ara+ mutant of a clone sampled from LTEE population Ara–1 at 2000 generations. REL1207 differs from REL606 by a total of eight mutations, including one in araA that confers the Ara+ marker phenotype. Each line was propagated through 550 single-cell bottlenecks by picking a colony at random from a Davis minimal agar plate with glucose at 200 μg/mL and streaking the cells onto a fresh plate. Given ~25 cell doublings to produce a typical colony41, the 550 cycles represent ~13,750 generations. The bottlenecks imposed by this procedure eliminate the genetic variation that fuels adaptation by natural selection; as a consequence, mutations accumulate at rates that depend on their underlying mutation rate but not their fitness effects, except for highly deleterious mutations that preclude sufficient growth to form a colony29. Because more mutations are deleterious than are beneficial, fitness declined under this regime (Extended Data Fig. 8). The 15 sequenced clonal isolates, each from a different MAE line, are JEB807–JEB821 (Supplementary Data 1). None of the lineages became hypermutable based on their mutational signatures and the absence of significant heterogeneity in the total mutations accumulated (see main text). However, the mean per-generation rate at which synonymous mutations arose was ~3.5-fold higher in the MAE lines than in the five LTEE populations that remained nonmutators for all 50,000 generations (Supplementary Data 4; ts = 3.0755, p = 0.0065). This difference may reflect the different conditions in liquid and agar media, including the glucose concentration and local cell density, which might affect the reactive oxygen species that cells experience. The comparisons between the LTEE and MAE (Extended Data Fig. 9) would change if the underlying rates of the various types of mutation responded disproportionately to the different conditions in the MAE. That possibility seems implausible for the different classes of point mutation (Extended Data Fig. 9a,b), and the differences would have to be substantially larger than the different rates of synonymous mutations to produce the excess IS150 insertions (Extended Data Fig. 9c) and large indels (Extended Data Fig. 9f) observed in the LTEE relative to the MAE.
Genome sequencing
Frozen samples from the LTEE and MAE were revived via overnight growth at 37°C in either LB or Davis minimal medium supplemented with 1000 μg/mL glucose. Genomic DNA was isolated from each culture using the Qiagen Genomic-tip 100/G kit or equivalent. The DNA samples were sequenced at Genoscope or Intragen SA (Évry, France), the Michigan State University Research Technology Support Facility (East Lansing, USA), or the University of Texas at Austin Genome Sequencing and Analysis Facility (Austin, USA). Illumina Genome Analyzer and HiSeq instruments were used to generate single-end or paired-end reads ranging in length from 35 to 150 bases according to standard procedures, with median coverage of 80-fold and 95-fold for the 264 LTEE and 15 MAE clones, respectively (Supplementary Data 1). Of the 264 LTEE genomes in this study, 40 were previously analysed in other studies9,19,20,55–57. All sequencing datasets are available in the NCBI Sequence Read Archive (BioProject accession PRJNA294072). Supplementary Data 4 shows the number of every type of mutation inferred after performing the analyses described below on each of the LTEE and MAE genomes used in this study.
Mutation calling
We used breseq (versions 0.26.0 to 0.27.0) to predict both single-nucleotide and structural differences24, 25 based on how the Illumina reads for each sample mapped to the genome sequence of E. coli B REL606 (GenBank: NC_012967.1)52. We counted and classified mutations using an updated version of the REL606 reference genome with improved feature annotations. The updated genome file (in both GenBank and GFF3 formats) and lists of predicted mutations in each evolved genome (in the Genome Diff format described in an appendix to the breseq manual) are freely available online (http://github.com/barricklab/LTEE-Ecoli).
Most types of single-step mutations, including large deletions and transposition events leading to copies of IS elements at new positions in the genome, are directly predicted by breseq when they occur in nonrepetitive genomic regions. The initial lists of predicted mutations were curated and refined as previously described24. Briefly, complex mutations involving multiple steps (such as a new IS insertion followed by a flanking deletion) and structural mutations that overlap repetitive regions of the genome were manually resolved from unassigned new junction and missing coverage evidence in the breseq output. Large duplications and amplifications were detected by examining the coverage depth of mapped reads across the reference genome and comparing this information with the positions of repeat sequences and unassigned junctions. Owing to limitations of short-read DNA sequencing data, we could not fully predict point mutations and indels of one to a few base pairs within repeat regions (e.g., IS elements) or gene conversions, in which intragenomic recombination between nearly identical copies of a large repeat region (e.g., the seven copies of the rRNA operon) converts a minor variation in one copy to match exactly the sequence of another copy. Instead, all such genetic changes in repetitive regions of the genome were uniformly ignored in downstream analyses, as described below.
To validate the final lists of mutations predicted in each clone, we applied these changes to the ancestral REL606 sequence and used breseq to compare the Illumina reads against this simulated evolved genome to verify there were no further, unexplained discrepancies. This step of applying mutations to the reference genome was also used to estimate the final genome size of each evolved clone, with the assumption that new IS insertions were of the most common size for that IS element in the reference genome.
For six of the 264 LTEE samples, there was evidence of nonclonality in the sequence data. Some samples appeared to be mixtures of two very closely related clones that shared nearly all mutations but had one to several mutations specific to each type, together adding to a frequency of 100% (e.g., sets of mutations at frequencies of 35% and 65%). This situation might result from inadvertently sampling two adjacent colonies on an agar plate when picking clones from an LTEE population. In other cases, only one or two mutations were found at an intermediate frequency. This type of heterogeneity might arise from strong selection favouring new mutations during colony outgrowth, subculturing, and revival of samples prior to DNA extraction, as these conditions differ from the LTEE. In each case, we reconstructed the major genotype in the sample, as noted in Supplementary Data 1.
We also ignored putative genome variation associated with a cryptic 186-like prophage element (REL606 genome coordinates 880528-904682). In 10 of the LTEE populations, we observed clones with increased read-coverage depth of this region and reads spanning a new sequence junction consistent with either tandem head-to-tail amplifications of this region or the production of circular DNA molecules joined at these exact nucleotides. The changes in the apparent copy number of this region often deviated from the integral values expected for a stable duplication or amplification. The prophage-related changes in coverage appeared most often in genomes isolated from 2,000 generations or earlier in the LTEE. There is no evidence of infective phage production in the LTEE, but it is possible that replication of DNA encoding a defective phage occurs stochastically at some low level in the ancestral strain REL606 or that production of this DNA is induced by stress when culturing samples for DNA isolation.
Phylogenetic consistency
Owing to the long duration of the LTEE and the evolution of mutators in several lineages, some mutations may be hidden or initially grouped with other mutations into a single change when comparing a late-generation evolved genome with the ancestral genome. For example, a point mutation might occur early in the experiment and then the region containing that mutation is later deleted. Similarly, the deletion of one base early and the subsequent deletion of an adjacent base would be called as a single two-base deletion in later samples. To obtain more accurate counts in light of these issues, we used each population’s inferred phylogeny to split or add mutations, as appropriate, so that the mutation list for each clone reflects the most parsimonious set of mutational steps between that clone and its ancestor. Specifically, we chose histories with the fewest total mutations, the fewest mutations on early branches (in case of ties), and the fewest total nucleotide changes summed over all mutations. Because this procedure is conservative in adding mutations to achieve phylogenetic consistency, it might underestimate the number of mutations on branches leading to an evolved genome when intermediate states are not resolved by the relationships of the sequenced clones.
Final mutation lists
We performed two final filtering steps to enable the sets of mutations to be uniformly compared across all genomes. In doing so, we classified as “small mutations” all single-nucleotide substitutions, insertions and deletions of 20 or fewer bp, substitutions replacing 20 or fewer bp in the reference genome with 20 or fewer other bp, and all simple sequence repeat (SSR) mutations regardless of their size. SSR mutations add or remove one or more copies of a tandem-repeat unit consisting of one or a few bp. We defined SSR mutations as containing at least two copies of the repeat unit and having a total length of at least five bp when including all copies of the tandem repeat in the reference genome. For example, the genetic changes GGGGG→GGGG, TATATA→TATATATA, and TACGTTACGT→TACGT would all be classified as SSR mutations, but GGGG→GGGGG, TATA→TATATA, and TACGT→TACGTTACGT would not. All other genomic changes were considered “large mutations” for purposes of filtering.
The ability to call small mutations located in repetitive regions of the genome is dependent on read length, so we removed all such mutations in regions where it would be a problem to uniformly detect them from the mutation lists before further analyses. To do this, we enumerated all regions of ≥20 bp that had an exact match elsewhere in the genome of the ancestral strain REL606 using MUMmer v3.2358. We then merged regions from this list that were separated by five or fewer bp. All resulting regions that were now ≥35 bp were included in a list of masked genomic intervals. We also added to this list a hypervariable SSR consisting of seven copies of a tetranucleotide sequence that could not be reliably called in datasets with short reads (coordinates 2103889-2103919). Any small mutations contained in these masked regions were excluded from all downstream analyses.
Lastly, we flagged all nucleotide substitutions or small indels occurring within 20 bp of the end of an IS element. The sequences directly adjacent to IS elements appear to experience an unusually high mutation rate, possibly due to frequent transposase cleavage and DNA repair. Mutations at these IS-adjacent sites probably have no effect on cellular phenotypes and fitness. We excluded them from the final lists of mutations used in all further analyses because they could bias the inferred mutational spectra and rates.
Phylogenetic analyses
To produce the phylogenetic trees shown in Figure 2, we used the point mutations associated with each clone. A minimum-evolution tree was built using the Jukes-Cantor one-parameter model59. We used this model for two reasons. First, the mutator lineages had very different mutational spectra from the nonmutators9,20,55,57. Second, many mutations seen in nonmutator lineages were under positive selection, and so it is appropriate to give the mutations equal weight and not, for instance, reduce the importance of transitions relative to transversions. The trees were plotted with the R package APE60. The composite tree has the star-like structure expected for independent evolution of the populations. Therefore, trees were made separately for each population and then combined in Figure 2, which allowed multiple basal branches to be placed with the appropriate populations.
Parallel evolution in nonmutator lineages
For genomes that did not come from point-mutation hypermutator lineages (Supplementary Data 1), we examined the extent of parallelism at the gene level in two ways. The first approach was based only on nonsynonymous mutations, because it is straightforward to quantify the overall extent of parallelism, determine the statistical significance of the parallelism, and rank genes based on their contributions to the significance. For each protein-coding gene i, we know its length, Li, and the number of independent nonsynonymous mutations observed in that gene across all clones from nonmutator and premutator lineages, Ni. We summed the lengths and relevant mutations over all single-copy protein-coding genes in the ancestral genome to obtain Ltot (3,920,306) and Ntot (457, including two mutations that each affected overlapping reading frames), respectively. We computed the expected number of mutations in each gene, Ei, as follows:
We then computed a Gi score for each gene for which Ni > 0 as follows:
We set Gi = 0 for those genes for which Ni = 0. This analysis ignores variability among genes in the proportion of sites at risk for nonsynonymous mutations. However, such differences are small and should hardly affect the analysis. The total G statistic equals the sum of the scores over all genes. To compute the expected G statistic under the null hypothesis of a random distribution of mutations, we generated 1000 simulated datasets in which Ntot mutations were randomly placed throughout the coding genome. We computed the total G statistic for each simulated dataset, and we calculated its mean and standard deviation across the 1000 simulations. To assess the significance of the observed G statistic, we computed the Z score as the difference between the observed and mean simulated values, divided by the standard deviation of the simulated values. Supplementary Data 2 lists each gene and the information used to calculate its G score. Table 1 shows the 15 genes with the highest G scores.
Supplementary Data 2 also shows other categories of mutation in or near each protein-coding gene including synonymous mutations, intergenic point mutations (between any particular gene and one of its immediately adjacent genes), IS insertions, small indels (≤50 bp), large deletions (>50 bp), and long duplications (>50 bp). Table 2 shows the 16 genes that had the most total deletions, duplications, insertions, and intergenic point mutations (i.e., all mutations except synonymous and nonsynonymous mutations in the coding gene itself).
Parallel evolution in mutator lineages
We examined parallel changes in lineages that evolved point-mutation hypermutability by analysing nonsynonymous substitutions as above. To identify mutations that occurred after a lineage became hypermutable (Supplementary Data 3), we subtracted the mutations that occurred on nonmutator branches from the total mutations. This approach may result in a few mutations that arose prior to hypermutability being included in the counts for mutator lineages, but given the large increases in the point-mutation rate in the mutators (Fig. 1) it provides a reasonable approximation.
Extended Data
Extended Data Figure 1. Changes in genome size during the LTEE.
Box-and-whiskers plot showing the distribution of average genome length (Mb, million bp) for each of the 12 LTEE populations based on the two clones sequenced at each time point shown from 500 to 50,000 generations. The red line shows the length of the ancestral genome. The boxes are the interquartile range (IQR), which spans the second and third quartiles of the data (25th to 75th percentiles); the thick black lines are medians; the whiskers extend to the outermost values that are within 1.5 times the IQR; and the points show all outlier values beyond the whiskers.
Extended Data Figure 2. Accumulation of synonymous mutations in populations that evolved point-mutation hypermutability.
Each symbol shows a sequenced genome from a hypermutable lineage. Colours are the same as those in Fig. 1. The accumulation of synonymous substitutions serves as a proxy for the underlying point-mutation rate. All four of the populations that became hypermutable before 10,000 generations accumulated synonymous mutations at higher rates between 10,000 and 20,000 generations than between 40,000 and 50,000 generations, indicating the evolution of reduced mutability.
Extended Data Figure 3. Alternative models fit to trajectory of genome evolution for each LTEE population.
a, Ara−1. b, Ara+1. c, Ara−2. d, Ara+2. e, Ara−3. f, Ara+3. g, Ara−4. h, Ara+4. i, Ara−5. j, Ara+5. k, Ara−6. l, Ara+6. Each symbol shows the total mutations in a sequenced genome; in many cases, the symbols for the two genomes from the same population and generation are not distinguishable because they have the same, or almost the same, number of mutations. For the populations that evolved hypermutability, data are shown only for time points before mutators arose. In each panel, the dashed grey line shows the best fit to the linear model; the solid grey curve shows the best fit to the square-root model; and the solid black curve shows the best fit to the composite model with both linear and square-root terms.
Extended Data Figure 4. Uncertainty in parameter estimation for model describing the rates of accumulation for neutral and beneficial mutations.
Contours show relative likelihoods for simultaneously estimating the linear and square-root coefficients from the observed numbers of mutations that accumulated over time in nonmutator and premutator lineages (Fig. 3). The black central point shows the maximum likelihood estimates, and the three black contours show solutions 2, 6, and 10 log units away. The points on the horizontal and vertical axes show values for the best one-parameter models.
Extended Data Figure 5. Accumulation of synonymous substitutions in nonmutator lineages.
Each filled symbol shows the mean number of synonymous mutations in the (usually two) nonmutator genomes from an LTEE population that were sequenced at that time point; noninteger values can occur if the two genomes have different numbers. Small horizontal offsets were added so that overlapping points are visible. Colours are the same as in Fig. 1. Open triangles show the grand means of the replicate populations. The grey line extends from the intercept to the final grand mean. The slope of that line was used to scale the relative rates of synonymous, nonsynonymous, and intergenic point mutations in Fig. 5.
Extended Data Figure 6. Temporal trend in accumulation of nonsynonymous mutations relative to the neutral expectation in nonmutator lineages.
Interval-specific accumulation of nonsynonymous mutations calculated from changes in the total number of nonsynonymous mutations between successive samples. As with the cumulative data in Fig. 5b, values are scaled by the average rate of accumulation for synonymous mutations over 50,000 generations, after adjusting for the numbers of genomic sites at risk for nonsynonymous and synonymous mutations. Each point shows the average rate calculated for a nonmutator or premutator population; small horizontal offsets were added so that overlapping points are visible. Note the discontinuous scale; populations with no additional mutations over an interval are plotted below. Colours are the same as in Fig. 1. Black lines connect grand means; the grey shading shows standard errors calculated from the replicate populations.
Extended Data Figure 7. Mutational spectrum for nonmutator lineages in the LTEE.
Shaded bars show the distribution of different types of genetic change for all independent mutations found in the set of nonmutator clones that were sequenced at each generation. The total number of mutations in this set at each time point (N) is shown above each column. Base substitutions are divided into synonymous, nonsynonymous, intergenic, and other categories; the nonsynonymous category includes nonsense mutations, and the “other” category includes rare point mutations in noncoding RNA genes and pseudogenes.
Extended Data Figure 8. Changes in fitness of MAE lines after 550 single-cell bottlenecks and ~13,750 generations.
Each point shows the mean fitness based on 9 competition assays between the MAE ancestor (REL1207) or one of the 15 MAE lineages (JEB807–JEB821) and the Ara− variant of the MAE ancestor (REL1206). One-day competition assays were performed using the standard procedures and same conditions as for the LTEE16,17. Error bars show 95% confidence intervals. Above each mean, one or two asterisks indicate p < 0.05 or p < 0.01, respectively, based on two-tailed t-tests of the null hypothesis that relative fitness equals 1. Ten of the 15 MAE lines experienced significant fitness declines, while none had significant gains.
Extended Data Figure 9. Trajectories for mutations by class in the LTEE in comparison with neutral expectations based on the MAE.
Accumulation of a, nonsynonymous mutations, b, intergenic point mutations, c, IS150 insertions, d, all other IS-element insertions, e, small indels, and f, large indels. Colours are the same as in Fig. 1. All values are expressed relative to the rate at which synonymous mutations accumulated in nonmutator LTEE lineages over 50,000 generations (Fig. 5a), and then scaled by the ratio of the number of the indicated class of mutation relative to the number of synonymous mutations in the MAE lines. In all panels, each symbol shows a nonmutator or premutator population. Note the discontinuous scale, in which populations with no mutations of the indicated type are plotted below. Black lines connect grand means over the replicate LTEE populations; the grey shading shows the corresponding standard errors.
Supplementary Material
Supplementary Information is available in the online version of the paper.
Acknowledgments
We thank N. Hajela for assistance, R. Maddamsetti and Z. Blount for discussions, and M. Lynch for starting the MAE lines. This research was supported by the US National Science Foundation (DEB-1451740 to R.E.L.), BEACON Center for the Study of Evolution in Action (DBI-0939454), European Research Council (FP7 grant 310944 to O.T.), European Union (FP7 grant 610427 to D.S.), French National Funding Agency (ANR-08-GENM-023-001 to D.S., O.T., and C.M), French CNRS International Associated Laboratory (to D.S. and R.E.L.), and US National Institutes of Health (R00-GM087550 to J.E.B.). D.E.D. was supported by a traineeship from the Cancer Prevention and Research Institute of Texas. We acknowledge the use of high-performance computing resources at the Texas Advanced Computing Center.
Footnotes
Author Contributions O.T., J.E.B., D.S., and R.E.L. conceived the project; R.E.L. and J.L.B. provided strains; O.T., J.E.B., D.E.D., A.D., G.C.W., S.W., S.C., and C.M. analyzed genomes and generated other data; N.R. developed theory; R.E.L., O.T., and J.E.B. wrote the paper. All authors approved the submitted version.
Author information Genome data have been deposited in the NCBI Sequence Read Archive (http://www.ncbi.nlm.nih.gov/sra). The breseq analysis pipeline is available at GitHub (http://github.com/barricklab/breseq). Other analysis scripts are available at the Dryad Digital Repository (http://dx.doi.org/10.5061/dryad.6226d). Reprints and permissions information is available at www.nature.com/reprints. R.E.L. will make strains available to qualified recipients, subject to a material transfer agreement.
The authors declare no competing financial interests.
References
- 1.Bersaglieri T, et al. Genetic signatures of strong recent positive selection at the lactase gene. Am J Hum Genet. 2004;74:1111–1120. doi: 10.1086/421051. [DOI] [PMC free article] [PubMed] [Google Scholar]
- 2.Hufford MB, et al. Comparative population genomics of maize domestication and improvement. Nat Genet. 2012;44:808–811. doi: 10.1038/ng.2309. [DOI] [PMC free article] [PubMed] [Google Scholar]
- 3.vonHoldt BM, et al. Genome-wide SNP and haplotype analyses reveal a rich history underlying dog domestication. Nature. 2010;464:898–902. doi: 10.1038/nature08837. [DOI] [PMC free article] [PubMed] [Google Scholar]
- 4.Lieberman TD, et al. Parallel bacterial evolution within multiple patients identifies candidate pathogenicity genes. Nat Genet. 2011;43:1275–1280. doi: 10.1038/ng.997. [DOI] [PMC free article] [PubMed] [Google Scholar]
- 5.Yang Z. PAML 4: phylogenetic analysis by maximum likelihood. Mol Biol Evol. 2007;24:1586–1591. doi: 10.1093/molbev/msm088. [DOI] [PubMed] [Google Scholar]
- 6.Lynch M, Conery JS. The origins of genome complexity. Science. 2003;302:1401–1404. doi: 10.1126/science.1089370. [DOI] [PubMed] [Google Scholar]
- 7.Whitney KD, Garland T. Did genetic drift drive increases in genome complexity? PLOS Genet. 2010;6:e1001080. doi: 10.1371/journal.pgen.1001080. [DOI] [PMC free article] [PubMed] [Google Scholar]
- 8.Wichman HA, Badgett MR, Scott LA, Boulianne CM, Bull JJ. Different trajectories of parallel evolution during viral adaptation. Science. 1999;285:422–424. doi: 10.1126/science.285.5426.422. [DOI] [PubMed] [Google Scholar]
- 9.Barrick JE, et al. Genome evolution and adaptation in a long-term experiment with Escherichia coli. Nature. 2009;461:1243–1247. doi: 10.1038/nature08480. [DOI] [PubMed] [Google Scholar]
- 10.Tenaillon O, et al. The molecular diversity of adaptive convergence. Science. 2012;335:457–461. doi: 10.1126/science.1212986. [DOI] [PubMed] [Google Scholar]
- 11.Lang GI, et al. Pervasive genetic hitchhiking and clonal interference in forty evolving yeast populations. Nature. 2013;500:571–574. doi: 10.1038/nature12344. [DOI] [PMC free article] [PubMed] [Google Scholar]
- 12.Kvitek DJ, Sherlock G. Whole genome, whole population sequencing reveals that loss of signaling networks is the major adaptive strategy in a constant environment. PLOS Genet. 2013;9:e1003972. doi: 10.1371/journal.pgen.1003972. [DOI] [PMC free article] [PubMed] [Google Scholar]
- 13.Burke MK, et al. Genome-wide analysis of a long-term evolution experiment with Drosophila. Nature. 2010;467:587–590. doi: 10.1038/nature09352. [DOI] [PubMed] [Google Scholar]
- 14.Levy SF, et al. Quantitative evolutionary dynamics using high-resolution lineage tracking. Nature. 2015;519:181–186. doi: 10.1038/nature14279. [DOI] [PMC free article] [PubMed] [Google Scholar]
- 15.Khan AI, Dinh DM, Schneider D, Lenski RE, Cooper TF. Negative epistasis between beneficial mutations in an evolving bacterial population. Science. 2011;332:1193–1196. doi: 10.1126/science.1203801. [DOI] [PubMed] [Google Scholar]
- 16.Lenski RE, Rose MR, Simpson SC, Tadler SC. Long-term experimental evolution in Escherichia coli. I. Adaptation and divergence during 2000 generations. Am Nat. 1991;138:1315–1341. [Google Scholar]
- 17.Wiser MJ, Ribeck N, Lenski RE. Long-term dynamics of adaptation in asexual populations. Science. 2013;342:1364–1367. doi: 10.1126/science.1243357. [DOI] [PubMed] [Google Scholar]
- 18.Sniegowski PD, Gerrish PJ, Lenski RE. Evolution of high mutation rates in experimental populations of E. coli. Nature. 1997;387:703–705. doi: 10.1038/42701. [DOI] [PubMed] [Google Scholar]
- 19.Blount ZD, Barrick JE, Davidson CJ, Lenski RE. Genomic analysis of a key innovation in an experimental Escherichia coli population. Nature. 2012;489:513–518. doi: 10.1038/nature11514. [DOI] [PMC free article] [PubMed] [Google Scholar]
- 20.Wielgoss S, et al. Mutation rate dynamics in a bacterial population reflect tension between adaptation and genetic load. Proc Natl Acad Sci USA. 2013;110:222–227. doi: 10.1073/pnas.1219574110. [DOI] [PMC free article] [PubMed] [Google Scholar]
- 21.Woods R, Schneider D, Winkworth CL, Riley MA, Lenski RE. Tests of parallel molecular evolution in a long-term experiment with Escherichia coli. Proc Natl Acad Sci USA. 2006;103:9107–9112. doi: 10.1073/pnas.0602917103. [DOI] [PMC free article] [PubMed] [Google Scholar]
- 22.Rozen DE, Lenski RE. Long-term experimental evolution in Escherichia coli. VIII. Dynamics of a balanced polymorphism. Am Nat. 2000;155:24–35. doi: 10.1086/303299. [DOI] [PubMed] [Google Scholar]
- 23.Plucain J, et al. Epistasis and allele specificity in the emergence of a stable polymorphism in Escherichia coli. Science. 2014;343:1366–1369. doi: 10.1126/science.1248688. [DOI] [PubMed] [Google Scholar]
- 24.Deatherage DE, Barrick JE. Identification of mutations in laboratory-evolved microbes from next-generation sequencing data using breseq. Methods Mol Biol. 2014;1151:165–188. doi: 10.1007/978-1-4939-0554-6_12. [DOI] [PMC free article] [PubMed] [Google Scholar]
- 25.Barrick JE, et al. Identifying structural variation in haploid microbial genomes from short-read resequencing data using breseq. BMC Genomics. 2014;15:1039. doi: 10.1186/1471-2164-15-1039. [DOI] [PMC free article] [PubMed] [Google Scholar]
- 26.Chao L, Vargas C, Spear BB, Cox EC. Transposable elements as mutator genes in evolution. Nature. 1983;303:633–635. doi: 10.1038/303633a0. [DOI] [PubMed] [Google Scholar]
- 27.Tenaillon O, Taddei F, Radman M, Matic I. Second-order selection in bacterial evolution: selection acting on mutation and recombination rates in the course of adaptation. Res Microbiol. 2001;152:11–16. doi: 10.1016/s0923-2508(00)01163-3. [DOI] [PubMed] [Google Scholar]
- 28.Gerrish PJ, Lenski RE. The fate of competing beneficial mutations in an asexual population. Genetica. 1998;102/103:127–144. [PubMed] [Google Scholar]
- 29.Barrick JE, Lenski RE. Genome dynamics during experimental evolution. Nat Rev Genet. 2013;14:827–839. doi: 10.1038/nrg3564. [DOI] [PMC free article] [PubMed] [Google Scholar]
- 30.Good BH, Desai MM. Deleterious passengers in adapting populations. Genetics. 2014;198:1183–1208. doi: 10.1534/genetics.114.170233. [DOI] [PMC free article] [PubMed] [Google Scholar]
- 31.Maddamsetti R, Lenski RE, Barrick JE. Adaptation, clonal interference, and frequency-dependent interactions in a long-term evolution experiment with Escherichia coli. Genetics. 2015;200:619–631. doi: 10.1534/genetics.115.176677. [DOI] [PMC free article] [PubMed] [Google Scholar]
- 32.Gillespie JH. Genetic drift in an infinite population: the pseudohitchhiking model. Genetics. 2000;155:909–919. doi: 10.1093/genetics/155.2.909. [DOI] [PMC free article] [PubMed] [Google Scholar]
- 33.Neher RA, Shraiman BI. Genetic draft and quasi-neutrality in large facultatively sexual populations. Genetics. 2011;188:975–996. doi: 10.1534/genetics.111.128876. [DOI] [PMC free article] [PubMed] [Google Scholar]
- 34.Kosheleva K, Desai MM. The dynamics of genetic draft in rapidly adapting populations. Genetics. 2013;195:1007–1025. doi: 10.1534/genetics.113.156430. [DOI] [PMC free article] [PubMed] [Google Scholar]
- 35.Kimura M. The Neutral Theory of Molecular Evolution. Cambridge Univ. Press; 1983. [Google Scholar]
- 36.Sharp PM, Emery LR, Zeng K. Forces that influence the evolution of codon bias. Philos Trans R Soc Lond B Biol Sci. 2010;365:1203–1212. doi: 10.1098/rstb.2009.0305. [DOI] [PMC free article] [PubMed] [Google Scholar]
- 37.Plotkin JB, Kudla G. Synonymous but not the same: the causes and consequences of codon bias. Nat Rev Genet. 2011;12:32–42. doi: 10.1038/nrg2899. [DOI] [PMC free article] [PubMed] [Google Scholar]
- 38.Stern DL. Evolutionary developmental biology and the problem of variation. Evolution. 2000;54:1079–1091. doi: 10.1111/j.0014-3820.2000.tb00544.x. [DOI] [PubMed] [Google Scholar]
- 39.Carroll SB. Evo-devo and an expanding evolutionary synthesis: a genetic theory of morphological evolution. Cell. 2008;134:25–36. doi: 10.1016/j.cell.2008.06.030. [DOI] [PubMed] [Google Scholar]
- 40.Oren Y, et al. Transfer of noncoding DNA drives regulatory rewiring in bacteria. Proc Natl Acad Sci USA. 2014;111:16112–16117. doi: 10.1073/pnas.1413272111. [DOI] [PMC free article] [PubMed] [Google Scholar]
- 41.Kibota TT, Lynch M. Estimate of the genomic mutation rate deleterious to overall fitness in E. coli. Nature. 1996;381:694–696. doi: 10.1038/381694a0. [DOI] [PubMed] [Google Scholar]
- 42.Cooper VS, Schneider D, Blot M, Lenski RE. Mechanisms causing rapid and parallel losses of ribose catabolism in evolving populations of Escherichia coli B. J Bacteriol. 2001;183:2834–2841. doi: 10.1128/JB.183.9.2834-2841.2001. [DOI] [PMC free article] [PubMed] [Google Scholar]
- 43.Miskinyte M, et al. The genetic basis of Escherichia coli pathoadaptation to macrophages. PLOS Path. 2013;9:e1003802. doi: 10.1371/journal.ppat.1003802. [DOI] [PMC free article] [PubMed] [Google Scholar]
- 44.Wielgoss S, Bergmiller T, Bischofberger AM, Hall AR. Adaptation to parasites and costs of parasite resistance in mutator and nonmutator bacteria. Mol Biol Evol. 2015;33:770–782. doi: 10.1093/molbev/msv270. [DOI] [PMC free article] [PubMed] [Google Scholar]
- 45.Charlesworth J, Eyre-Walker A. The rate of adaptive evolution in enteric bacteria. Mol Biol Evol. 2006;23:1348–1356. doi: 10.1093/molbev/msk025. [DOI] [PubMed] [Google Scholar]
- 46.Sawyer SA, Kulathinal RJ, Bustamante CD, Hartl DL. Bayesian analysis suggests that most amino acid replacements in Drosophila are driven by positive selection. J Mol Evol. 2003;57:S154–S164. doi: 10.1007/s00239-003-0022-3. [DOI] [PubMed] [Google Scholar]
- 47.Bustmante CD, et al. Natural selection on protein-coding genes in the human genome. Nature. 2005;437:1153–1157. doi: 10.1038/nature04240. [DOI] [PubMed] [Google Scholar]
- 48.Cooper TF. Recombination speeds adaptation by reducing competition between beneficial mutations in populations of Escherichia coli. PLOS Biol. 2007;5:e225. doi: 10.1371/journal.pbio.0050225. [DOI] [PMC free article] [PubMed] [Google Scholar]
- 49.Satterwhite RS, Cooper TF. Constraints on adaptation of Escherichia coli to mixed-resource environments increase over time. Evolution. 2015;69:2067–2078. doi: 10.1111/evo.12710. [DOI] [PubMed] [Google Scholar]
- 50.Paterson S, et al. Antagonistic coevolution accelerates molecular evolution. Nature. 2010;464:275–278. doi: 10.1038/nature08798. [DOI] [PMC free article] [PubMed] [Google Scholar]
- 51.Daegelen P, Studier FW, Lenski RE, Cure S, Kim JF. Tracing ancestors and relatives of Escherichia coli B, and the derivation of B strains REL606 and BL21(DE3) J Mol Biol. 2009;394:634–643. doi: 10.1016/j.jmb.2009.09.022. [DOI] [PubMed] [Google Scholar]
- 52.Jeong H, et al. Genome sequences of Escherichia coli B strains REL606 and BL21(DE3) J Mol Biol. 2009;394:644–652. doi: 10.1016/j.jmb.2009.09.052. [DOI] [PubMed] [Google Scholar]
- 53.Luria SE, Delbrück M. Mutations of bacteria from virus sensitivity to virus resistance. Genetics. 1943;28:491–511. doi: 10.1093/genetics/28.6.491. [DOI] [PMC free article] [PubMed] [Google Scholar]
- 54.Blount ZD, Borland CZ, Lenski RE. Historical contingency and the evolution of a key innovation in an experimental population of Escherichia coli. Proc Natl Acad Sci USA. 2008;105:7899–7906. doi: 10.1073/pnas.0803151105. [DOI] [PMC free article] [PubMed] [Google Scholar]
- 55.Wielgoss S, et al. Mutation rate inferred from synonymous substitutions in a long-term evolution experiment with Escherichia coli. G3 (Bethesda) 2011;1:183–186. doi: 10.1534/g3.111.000406. [DOI] [PMC free article] [PubMed] [Google Scholar]
- 56.Raeside C, et al. Large chromosomal rearrangements during a long-term evolution experiment with Escherichia coli. mBio. 2014;5:e01377–14. doi: 10.1128/mBio.01377-14. [DOI] [PMC free article] [PubMed] [Google Scholar]
- 57.Maddamsetti R, et al. Synonymous genetic variation in natural isolates of Escherichia coli does not predict where synonymous substitutions occur in a long-term experiment. Mol Biol Evol. 2015;32:2897–2904. doi: 10.1093/molbev/msv161. [DOI] [PMC free article] [PubMed] [Google Scholar]
- 58.Kurtz S, et al. Versatile and open software for comparing large genomes. Genome Biol. 2004;5:R12. doi: 10.1186/gb-2004-5-2-r12. [DOI] [PMC free article] [PubMed] [Google Scholar]
- 59.Desper R, Gascuel O. Fast and accurate phylogeny reconstruction algorithms based on the minimum-evolution principle. J Comp Biol. 2002;9:687–705. doi: 10.1089/106652702761034136. [DOI] [PubMed] [Google Scholar]
- 60.Paradis E, Claude J, Strimmer K. APE: analyses of phylogenetics and evolution in R language. Bioinformatics. 2004;20:289–290. doi: 10.1093/bioinformatics/btg412. [DOI] [PubMed] [Google Scholar]
Associated Data
This section collects any data citations, data availability statements, or supplementary materials included in this article.


