Abstract
Background: In humans, the adrenal glands and gonads undergo distinct biological events between 6-10 weeks post conception (wpc), such as testis determination, the onset of steroidogenesis and primordial germ cell development. However, relatively little is currently known about the genetic mechanisms underlying these processes. We therefore aimed to generate a detailed genomic atlas of adrenal and gonad development across these critical stages of human embryonic and fetal development.
Methods: RNA was extracted from 53 tissue samples between 6-10 wpc (adrenal, testis, ovary and control). Affymetrix array analysis was performed and differential gene expression was analysed using Bioconductor. A mathematical model was constructed to investigate time-series changes across the dataset. Pathway analysis was performed using ClueGo and cellular localisation of novel factors confirmed using immunohistochemistry.
Results: Using this approach, we have identified novel components of adrenal development (e.g. ASB4, NPR3) and confirmed the role of SRY as the main human testis-determining gene. By mathematical modelling time-series data we have found new genes up-regulated with SOX9 in the testis (e.g. CITED1), which may represent components of the testis development pathway. We have shown that testicular steroidogenesis has a distinct onset at around 8 wpc and identified potential novel components in adrenal and testicular steroidogenesis (e.g. MGARP, FOXO4, MAP3K15, GRAMD1B, RMND2), as well as testis biomarkers (e.g. SCUBE1). We have also shown that the developing human ovary expresses distinct subsets of genes (e.g. OR10G9, OR4D5), but enrichment for established biological pathways is limited.
Conclusion: This genomic atlas is revealing important novel aspects of human development and new candidate genes for adrenal and reproductive disorders.
Keywords: adrenal, testis, ovary, sex development, steroidogenesis, germ cell, human development, gene expression
Introduction
The development of the adrenal gland and gonads (testes, ovaries) are two of the most important embryological events, but relatively little is known about the exact mechanisms of these processes in humans.
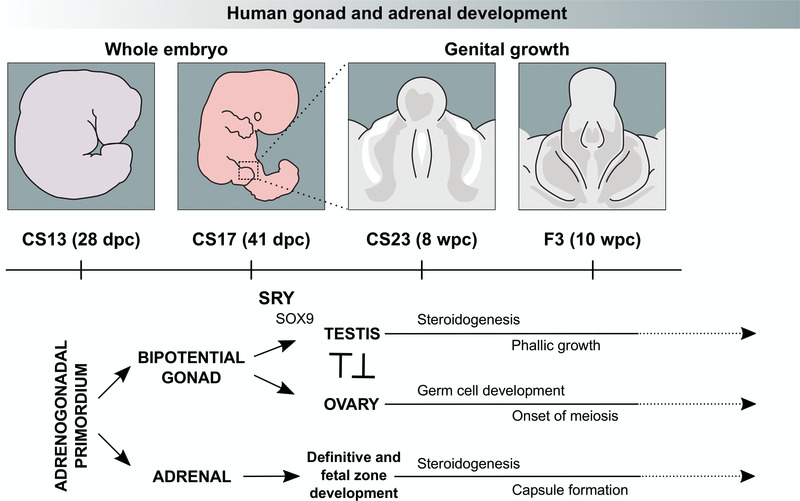
Development of these structures is closely linked as they arise from a shared region of intermediate mesoderm in early embryogenesis and subsequently have common biological processes, such as the ability to synthesise steroid hormones (see Figure 1 for an overview).
Figure 1. Current model of human gonad and adrenal development between Carnegie Stage 13 (CS13) and Fetal Stage 3 (F3).
The bipotential gonad and adrenal gland both arise from the adrenogonadal primordium around CS13. Sex determination in the bipotential gonad occurs between CS17 and CS23 when transient SRY expression promotes the upregulation of genes, including SOX9, in the developing testis. Sex differentiation starts with the onset of steroidogenesis around CS23, which results in development of the external genitalia and phallic growth (right panel). Ovary-specific genes are thought to suppress male pathway specification. The ovary also supports germ cell expansion and entry into meiosis. The fetal adrenal cortex develops into definitive and fetal zones, producing steroid hormones and adrenal androgens. Chromaffin cells derived from the sympathetic nervous system migrate into the developing adrenal gland, merging later to form the adrenal medulla.
The primordial adrenal gland arises as a distinct structure at around 28 days post-conception (dpc) and undergoes rapid growth during late embryonic and early fetal life (Ishimoto & Jaffe, 2011). The adrenal cortex develops into definitive and fetal zones that can produce steroid hormones (cortisol, aldosterone) and large amounts of adrenal androgens, such as dehydroepiandrosterone (DHEA) (Miller & Auchus, 2011; Xing et al., 2015). Chromaffin cells derived from the sympathetic nervous system migrate into the developing adrenal gland and later coalesce to form the adrenal medulla, which secretes adrenaline and noradrenaline (Figure 1). It has been proposed that the entire hypothalamic-pituitary-adrenal (HPA) axis is functionally intact during early fetal life (Goto et al., 2006).
In contrast, the developing gonad remains “bipotential” until around 41 dpc as it can differentiate into either a testis or ovary (Figure 1) (Bashamboo et al., 2017; Svingen & Koopman, 2013).
In the developing 46,XY embryo, transient expression of the testis-determining gene, SRY, on the Y chromosome is believed to lead to upregulation of genes such as SOX9 and the process of testis determination (Bashamboo et al., 2017; Hanley et al., 2000; Hiramatsu et al., 2009; Koopman et al., 2016; Sekido & Lovell-Badge, 2008). At around 7–8 weeks post conception (wpc), Sertoli cells secrete the peptide hormone Anti-Müllerian Hormone (AMH, also known as Müllerian Inhibiting Substance, MIS) to regress Müllerian structures (uterus and upper vagina). Fetal Leydig cells develop and synthesise testosterone. Testosterone stabilises Wolffian structures and stimulates development of the external genitalia through its peripheral conversion to dihydrotestosterone (Figure 1) (Miller & Auchus, 2011).
Ovary development in the 46,XX embryo was originally thought to be a “passive” process that occurs in the absence of SRY and other components of the testis-determining pathway. Although the morphological changes in the ovary are less striking, data from mice and from 46,XX individuals with rare forms of ovotestis development suggest that distinct pathways are up-regulated (e.g. RSPO1/WNT4/β-catenin), which may function largely to repress testis development (Figure 1) (Bashamboo et al., 2017; Beverdam & Koopman, 2006; Bouma et al., 2007; Jameson et al., 2012; Nef et al., 2005). The ovary also has expansion of primordial germ cells starting towards the end of this early fetal period (Fowler et al., 2009).
Given the limited data currently available (Gerrard et al., 2016; Houmard et al., 2009; O’Shaughnessy et al., 2007; Ostrer et al., 2007), we aimed to generate a genomic atlas of human adrenal and gonad development between 6 and 10 wpc. This period represents a critical window for organogenesis during which many key biological events occur in tissue specification and cellular differentiation. This unique dataset is supported by our current knowledge of key genetic components in these processes and by human conditions affecting adrenal and gonadal function. By comparing datasets at different times and in different tissues, as well as by mathematical modelling of time series data, several novel insights into human adrenal and gonad development are emerging.
Methods
Tissue samples
Human embryonic and fetal tissue samples used in this study were obtained in collaboration with the MRC/Wellcome Trust-funded Human Developmental Biology Resource (HDBR). The HDBR is a tissue bank regulated by the Human Tissue Authority. Samples were collected with appropriate maternal written consent and with approval from the NRES Committee London-Fulham (REC reference 08/H0712/34+5). Material was obtained only from surgical terminations of pregnancy to avoid any potentially interfering effects of anti-progestogens on nuclear receptor gene transcription.
All materials were kept on ice and processed rapidly after collection. The adrenal glands, gonads and any control tissues needed were identified and removed by blunt dissection under a dissecting microscope. Samples were immediately immersed in RNAlater® (Ambion, Austin, TX, USA) and stored at -20 C. The age of the embryonic or fetal sample was calculated using published guidelines (Hern, 1984; O’Rahilly & Müller, 1987) by a single experienced researcher (DG) (Supplementary Table 1). Each tissue sample was also karyotyped using standard G-banding, to determine the sex of the embryo/fetus and also to ensure there were no significant aneuploidies or chromosomal rearrangements present.
A total of 53 different organs between 42 days post conception (dpc) (Carnegie Stage 17) and 10 weeks post conception (wpc) (Fetal Stage 3) were included in the analysis. This dataset consisted of 17 adrenal glands, 20 testes and 10 ovaries, as well as 6 “control” samples (46, XY) from spine, brain, muscle, heart, kidney and liver. The adrenal gland and testis samples came from the same fetus in 11 cases across the age range. Control samples were obtained from 2 of these. An overview of all samples is provided in Supplementary Table 1.
RNA extraction
RNA was extracted using the TRIzol method. In brief, the tissue sample was removed from RNAlater® and homogenized in 1ml TRIzol reagent using a Pellet Pestle micro-grinder (Kontes/Kimble Chase, USA). Chloroform (0.2 ml) was added to allow phase separation, and RNA was precipitated from aqueous phase by addition of 0.5 ml isopropyl alcohol. The RNA pellet was washed in 1ml ice-cold 75% ethanol and air dried before resuspension in nuclease-free water. The concentration and A260/A280 ratio was measured using a NanoDrop ND-1000 spectrophotometer (NanoDrop Technologies, Witec, Littau, Switzerland). RNA was stored at -80 C prior to use.
Arrays
Expression assay was performed using the Affymetrix GeneChip Human Gene 1.0 ST array, covering approximately 36000 RefSeq transcripts. In brief, RNA concentration and quality was assessed using an Agilent Bioanalyzer. 250ng of total RNA was converted to ssDNA using the Ambion Whole Transcript Sense Target Labeling Assay and labelled and prepared for hybridisation using the Affymetrix Genechip WT Terminal Labelling and Hybridisation kits, as per the manufacturer’s protocol. Hybridisation was performed for 16 hours at 45 C. Arrays were washed and stained using the Affymetrix Fluidics Station 450 and scanned on the Affymetrix Genechip 3000S scanner as per the manufacturer’s instructions.
After passing quality control, CEL files were normalised using the Robust Multi-array Average (RMA) algorithm (oligo package in R, version 1.38.0). Adjustments for batch effects was performed using ComBat (sva package, version 3.22.0) (Leek et al., 2012). One adrenal sample that was an extreme outlier in several QC platforms was excluded prior to further analysis (leaving the 17 adrenal samples reported above). Statistical analysis of the microarray data was carried out in R programming environment (version 3.3.3 running under Ubuntu 16.04.2) using Bioconductor packages ‘oligo’(Carvalho & Irizarry, 2010) and ‘limma’ (version 3.30.12) (Smyth, 2004). The hierarchical cluster dendrogram was generated using the agglomeration method ward.D2. Differentially expressed genes were obtained using linear models and the Benjamini and Hochberg method was applied to adjust the P-values for multiple testing (Benjamini & Hochberg, 1995). The cut-off values for adjusted P-values and log2 fold-changes were 0.05 and 1 or 2, respectively. The pheatmap (version 1.0.8) and VennDiagram packages (version 1.6.17) were used to generate the heatmaps and Venn diagrams, respectively. Pathway enrichment analysis was carried out using the Cytoscape plug-in ClueGO (version numbers 3.4.0 and 2.3.3, respectively) (Bindea et al., 2009).
Array data are available from the ArrayExpress database under the accession number E-MTAB-5525.
A model of expression changes over time
A phenomenological model (“BALT model”) was developed to pinpoint the time when gene expression levels change, as well as evaluating the speed and magnitude of this transition. The general form of the model is a sigmoid function relating the transcript concentration X (on a 2-log scale) to the time elapsed since conception (t, expressed in days):
In the formula above, B (“basis”) is the basic expression level at the start of the time course and A (“amplitude”) is the amplitude of the difference between the finishing expression level and the starting one. For down-regulated genes this latter parameter takes negative values. The parameter L (“localisation”) captures the inflexion point of the sigmoid, and hence can identify at which point in time a gene undergoes a change of expression level. Finally, T (“Transition”) is a measure of the speed of this transition and the sub-function f was chosen so that this parameter can also be expressed in days.
The model was fitted to the data for each gene using a least square objective function (maximum likelihood) with a gradient following algorithm (Levenberg-Marquardt). With this, the values for the aforementioned parameters that best fit the data were obtained as well as an evaluation of the goodness of fit (and thus, of the validity of the model). Furthermore, robustness of the parameters were estimated using a Markov Chain Monte Carlo procedure.
It was found that most of the differentially expressed genes in our biological system could be well described by this model or simplified versions of it. Hence the procedure was seen as a way to compress high dimensional data into a smaller set of easily interpretable indicators. This modelling framework allowed genes to be grouped according to their transition times between different expression levels in a developmental process as well as the manner of this transition. This model was used predominantly to investigate time course data in the testis. The two main groups of genes that were analysed were those that followed a curvilinear upregulation in expression from the start of the dataset similar to SOX9, as well as genes that showed a sigmoidal upregulation in expression with the onset of steroidogenesis. The mid-point (in dpc) of the Carnegie or Fetal Stage was used when analysing data for the model (Supplementary Table 1).
Quantitative RT-PCR
Purified RNA from adrenal glands and control tissue (heart) was quantified using the NanoDrop 1000 spectrophotometer (Thermo Fisher Scientific). First-strand cDNA was synthesised using SuperScript II Reverse Transcriptase (Invitrogen) and random primers according to the manufacturer’s instructions. Taqman® probes were obtained for the following genes of interest: MAP3K15, ASB4, MGARP (OSAP), TDGF1, FOXO4 and NRK (Applied Biosystems, Warrington, UK). Amplification was performed in a total volume of 20 µl per reaction using TaqMan® Gene Expression Master Mix on the StepOnePlus™ System (Thermo Fisher Scientific). The relative quantification of gene expression was calculated as 2-ΔΔCt using the comparative Ct (ΔΔCt) method and GAPDH as the housekeeping internal control. Data were analysed with StepOne software (v 2.1) and results expressed as fold change above control.
Immunohistochemistry
Human adrenal glands and testes of the relevant ages of interest were obtained with approval from the HDBR. Tissues were sunk and positioned in Tissue-Tek® O.C.T. (Fisher Scientific, Loughborough, UK) and frozen on dry ice. Frozen sections were cut at 12 µm thickness, collected on Superfrost slides (Fisher Scientific), dried and stored at -20 C. For immunohistochemistry, sections were fixed briefly in 4% PFA in TBS, rinsed in TBS and blocked for 1 hour in 1% BSA in TBS-Tween (0.5% Tween), before being incubated overnight with the following primary antibodies: NR5A1 (Invitrogen N1665/434200, 1:200), CYP11A1 (Sigma HPA016436, 1:20), NRK (Sigma HPA017238, 1:250), SOX9 (Sigma HPA001758, 1:200), CITED1 (Abcam ab15036, 1:200), GRAMD1B (Sigma HPA008557, 1:200; Abnova PAB15705, 1:200), RMDN2 (Sigma HPA034706, 1:200), FOXO4 (Cell Signalling 2499, 1:200), AMH (Abcam ab103233 1:200), INSL3 (Sigma HPA028615, 1:1000), SCUBE1 (Abcam ab105358, 1:50). The next morning, sections were washed in TBS-Tween and incubated for 1 hour with the relevant secondary antibodies: Alexa488 goat anti-mouse (Invitrogen A11001, 1:400) and Alexa555 goat anti-rabbit (Invitrogen A21429, 1:400). Nuclei were counterstained with DAPI (10 µg/ml, Sigma). Slides were washed with TBS-Tween and mounted using ProLong Gold Antifade Mountant (Life Technologies). Images were collected on a Zeiss LSM 710 confocal microscope (Carl Zeiss) and analysed using Zeiss Zen 2009 and Image J (version 1.46r).
Results
Generation of an atlas of gene expression in human adrenal gland, testis and ovary
Human embryonic and fetal tissues of interest were obtained following ethical approval and with informed consent from the Human Developmental Biology Resource (HDBR, www.hdbr.org). RNA was extracted and gene expression profiling performed using Affymetrix ST1.0 Gene arrays. A total of 53 different organs between 42 days (6 weeks) and 70 days (10 weeks) post-conception were included in the final analysis (Supplementary Table 1). This dataset consisted of 17 adrenal glands (46,XY), 10 ovaries (46,XX), and 20 testes (46,XY), as well as 6 control samples (46,XY) from spine, brain, muscle, heart, kidney and liver. Adrenal and control samples with a 46,XY karyotype were intentionally chosen so that subtle effects of Y-chromosome genes on testis determination and sex development could be analysed. All relevant CEL files have been deposited in the ArrayExpress database (E-MTAB-5525) and the entire dataset of log2 normalised values is included in Dataset 1.
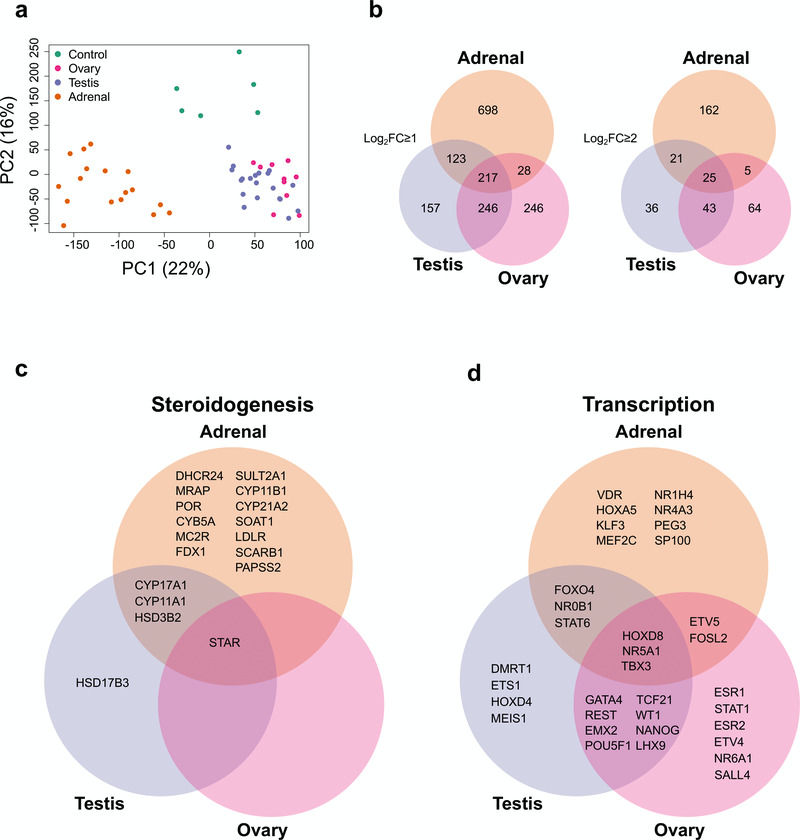
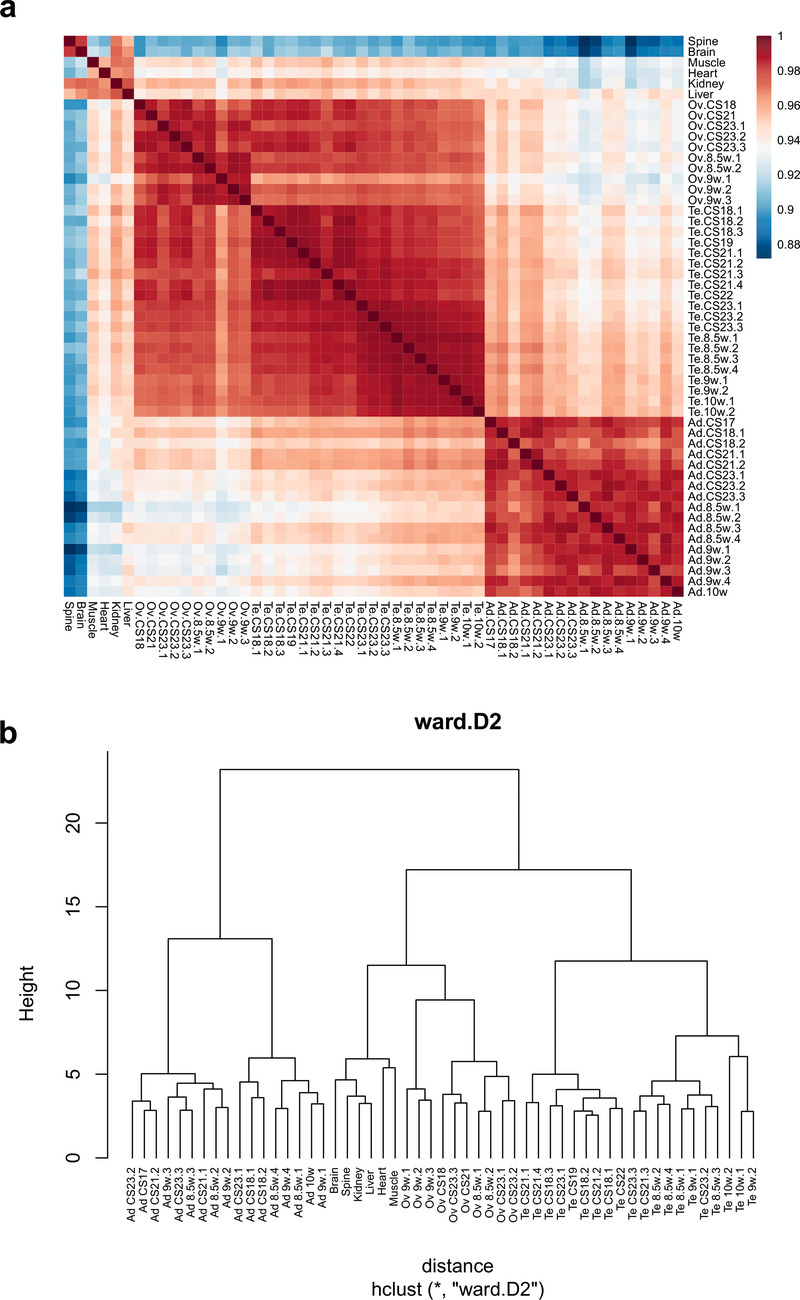
Initial comparisons of gene expression profiles in the different samples were undertaken using principal components analysis (PCA) and by generating correlation plots (heatmaps) and cluster dendrograms (Figure 2a, Figure 3). Samples from each tissue clearly clustered together, with more similarity between testis and ovary profiles than adrenal gland (Figure 2a, Figure 3).
Figure 2. Differential gene expression in adrenal gland, testis and ovary compared to controls.
(a) Principal component analysis of the 53 samples included in the study (17 adrenal, 20 testes, 10 ovary and 6 controls). The scatter plot shows the position of samples based on the two first principal components (PC1, PC2). (b) Venn diagram showing the overlap between differentially up-regulated genes in the adrenal, testis and ovary compared with control samples using either log2FC≥1 or log2FC≥2. (c) Selected examples of differentially up-regulated genes (log2FC≥2) involved in steroidogenesis (d) Selected transcription factors differentially expressed in each tissue (log2FC≥1). For all comparisons, P-value≤0.05.
Figure 3. Cluster analysis for all 53 samples included in the study.
(a) Correlation plot (heatmap) of gene expression. (b) Hierarchical cluster dendrogram using the agglomeration method ward.D2.
Global gene expression patterns reveal known disease-causing genes and identify novel tissue-specific factors
An analysis of global gene expression patterns was initially performed for the three tissues (adrenal, testis, ovary) compared to controls. Genes were identified that were up-regulated with a log2 fold change (FC) of ≥ 2 or ≥ 1 and adjusted P-value lower than 0.05 (P≤ 0.05) (Dataset 2–Dataset 4).
An overview of the number of differentially up-regulated genes that are specific to each tissue, or overlapping, is shown in Figure 2b. As expected, there was greater overlap between testis and adrenal (due to shared steroidogenic pathways) and testis and ovary (due to their gonadal origin and presence of germ cells) than between adrenal and ovary, which are developmentally and functionally more distinct.
Analysis of factors known to be involved in steroidogenesis showed that shared components of the steroidogenic pathways overlapped in the adrenal and testis datasets (e.g. CYP11A1, HSD3B2, CYP17A1), whereas the gene responsible for conversion of delta-4 steroids (e.g. androstenedione) into testosterone, HSD17B3, was the only testis-specific steroidogenic enzyme (Figure 2c). Adrenal-specific steroidogenic components included the enzymes needed to make aldosterone and cortisol from precursors (e.g. CYP11B1, CYP21A2) as well as adrenal-specific receptors involved in signalling pathways (e.g. MC2R [also known as the ACTH receptor], MRAP).
A similar analysis of known transcription factors (Figure 2d) revealed several key genes shared between the testis and ovary involved in gonad development (e.g., WT1, EMX2, LHX9, GATA4) or in germ cell maturation (e.g., POU5F1 [also known as OCT4] and NANOG) (Figure 2d). One key transcription factor shared between the adrenal and testis was the nuclear receptor NR0B1 (also known as DAX-1), responsible for X-linked adrenal hypoplasia congenita with male infertility (Suntharalingham et al., 2015). Another key nuclear receptor common to all three tissues was NR5A1 (also known as steroidogenic factor-1), responsible for adrenal insufficiency, testicular dysgenesis and primary ovarian insufficiency (Achermann et al., 1999; Lourenço et al., 2009; Suntharalingham et al., 2015). Therefore, the dataset seemed validated based on known factors involved in development as well as in genetic conditions in humans.
Known and novel adrenal-specific genes
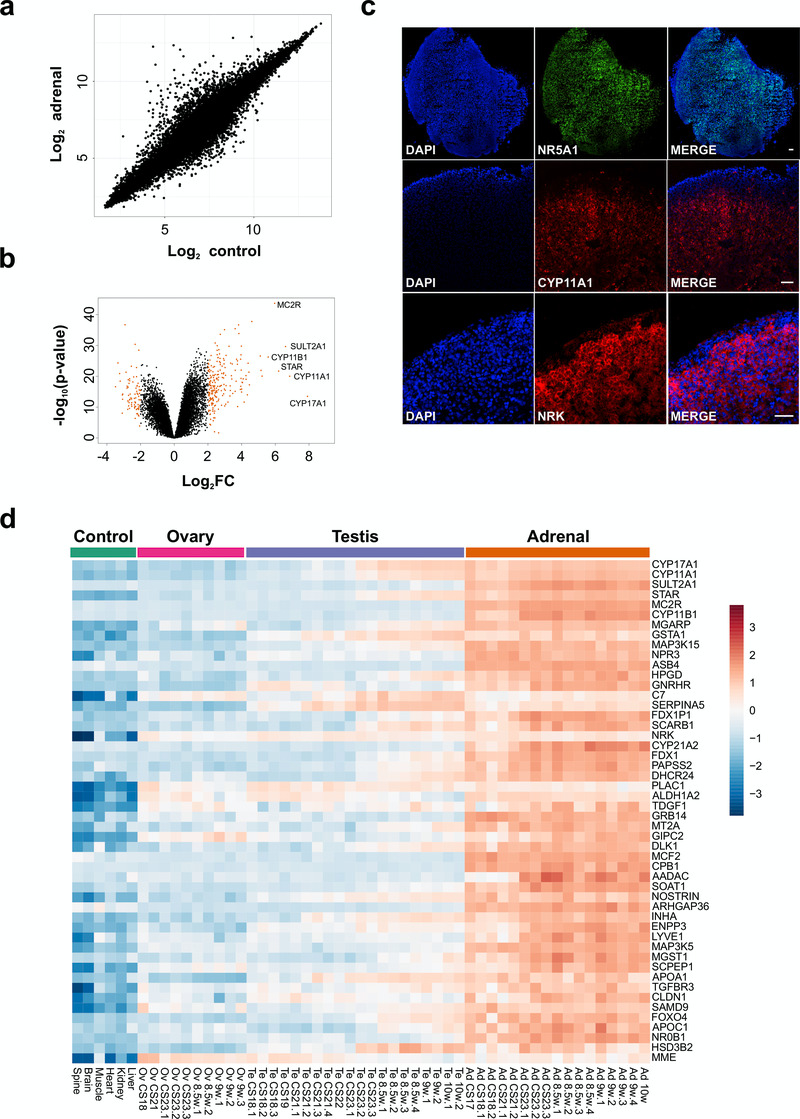
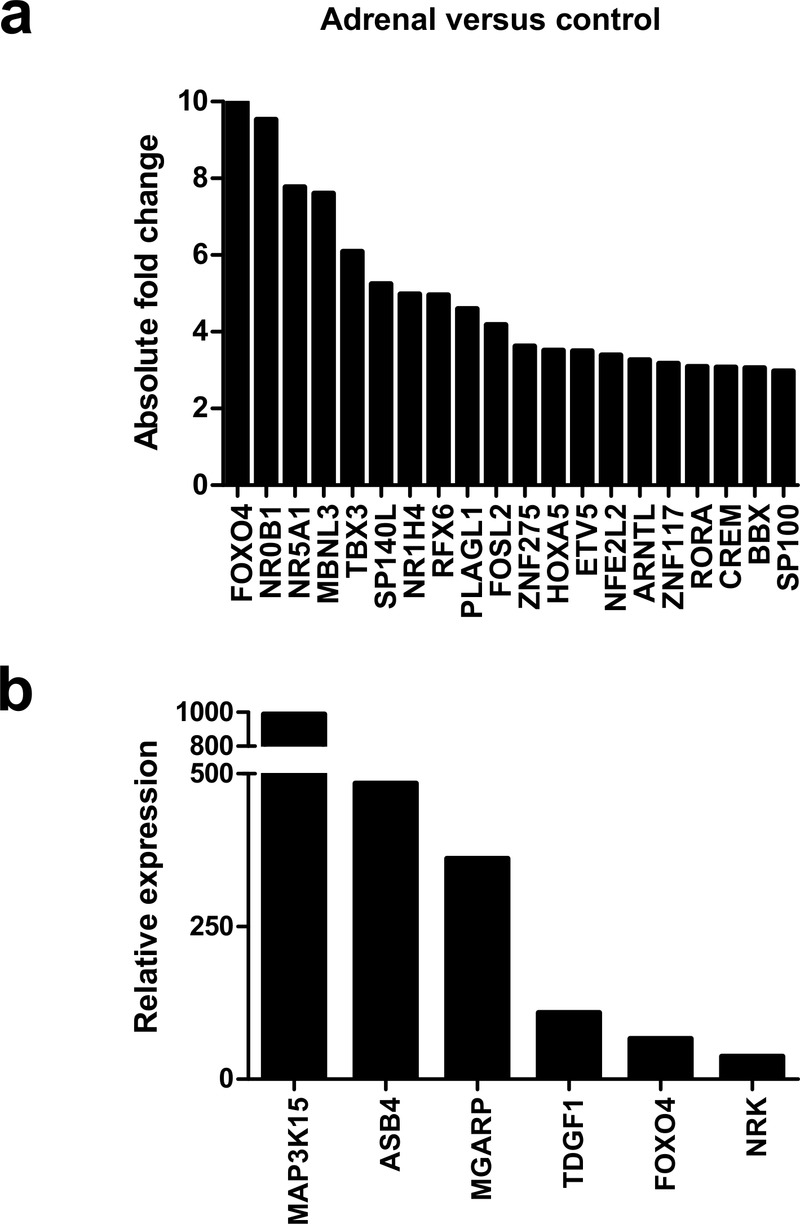
Initial analysis focused on genes up-regulated in the adrenal gland compared to controls (Figure 4a, Table 1 and Dataset 2). The most strongly differentially expressed adrenal genes were CYP17A1 (absolute FC 240.2), CYP11A1 (absolute FC 115.4), SULT2A1 (absolute FC 97.3), STAR (absolute FC 73.4), MC2R (the ACTH receptor) (absolute FC 62.3) and CYP11B1 (absolute FC 47.8) (Figure 4a–d and Table 1). These genes are known core components of adrenal steroidogenesis and most are associated with monogenic disorders in humans (Table 1). The most strongly differentially expressed transcription factors were FOXO4 (absolute FC 10), NR0B1 (DAX-1) (absolute FC 9.5) and NR5A1 (SF-1) (absolute FC 7.8) (Figure 5a). Key novel genes or those that have not been extensively studied in the adrenal gland before include MGARP (also known as OSAP), MAP3K15, ASB4, NRK, and TDGF1 (Figure 4d). Expression of these genes was confirmed by qRTPCR and/or immunohistochemistry (Figure 4c, Figure 5b). Analysis of the heatmap for the top 50 differentially expressed genes revealed that several novel genes appear to be highly adrenal-specific (e.g., ASB4, NPR3, GRB14), whereas others are also expressed in the later testis samples, suggesting a potential novel role for these genes in steroidogenesis (see below) (Figure 4d).
Figure 4. Differential expression of genes in the adrenal gland.
(a) Correlation plot for log2 mean gene expression levels in the adrenal versus control samples (Pearson’s product-moment correlation test correlation coefficient=0.96, P-value≤ 2.2e-16). (b) Volcano plot analysis of differentially expressed genes in adrenal versus control samples. Genes with a log2FC≥2 (or log2FC≥-2) and P-value≤0.000005 are shown in orange. (c) Immunohistochemistry of NR5A1, CYP11A1 and NRK in the human adrenal gland (9 wpc). Nuclei are stained blue with DAPI, which also highlights the outer capsule. Scale bars, 100 µm. (d) Heatmap representing normalised gene expression values for the top 50 differentially up-regulated adrenal genes compared to control samples across the whole sample dataset. Genes are ordered according to descending log2FC values. The intensity of gene expression is indicated by a colour scale: blue for lowest and red for highest expression levels. For all samples shown, P-value≤1e-10.
Table 1. The top 20 differentially expressed adrenal genes and other selected genes associated with monogenic disorders in humans.
Genes are ranked based on log2FC in the adrenal (n=17) compared to control samples (n=6). Further clinical information is available at Online Mendelian Inheritance in Man (OMIM).
| Rank | Gene | log 2FC | Fold change |
OMIM gene | Clinical condition (monogenic) |
|---|---|---|---|---|---|
| 1 | CYP17A1 | 7.91 | 240.2 | 609300 | Congenital adrenal hyperplasia (due to 17 α-hydroxylase deficiency) |
| 2 | CYP11A1 | 6.85 | 115.4 | 118485 | Congenital adrenal hyperplasia (due to CYP11A1/ P450scc deficiency) |
| 3 | SULT2A1 | 6.60 | 97.3 | - | |
| 4 | STAR | 6.20 | 73.4 | 600617 | Congenital lipoid adrenal hyperplasia; Familial glucocorticoid deficiency type 3 |
| 5 | MC2R | 5.96 | 62.3 | 607397 | Familial glucocorticoid deficiency, type 1 |
| 6 | CYP11B1 | 5.58 | 47.8 | 610613 | Congenital adrenal hyperplasia (due to 11 β-hydroxylase deficiency) |
| 7 | MGARP | 5.21 | 37.1 | - | |
| 8 | GSTA1 | 5.15 | 35.5 | - | |
| 9 | MAP3K15 | 5.11 | 34.5 | - | |
| 10 | NPR3 | 4.62 | 24.6 | - | |
| 11 | ASB4 | 4.60 | 24.3 | - | |
| 12 | HPGD | 4.46 | 22.0 | 601688 | Cranioosteoarthropathy; Primary hypertrophic osteoarthropathy type 1 |
| 13 | GNRHR | 4.43 | 21.6 | 138850 | Hypogonadotropic hypogonadism |
| 14 | C7 | 4.34 | 20.3 | 217070 | C7 (complement) deficiency |
| 15 | SERPINA5 | 4.26 | 19.2 | - | |
| 16 | FDX1P1 | 4.26 | 19.1 | - | |
| 17 | SCARB1 | 4.15 | 17.8 | 601040 | High-density lipoprotein elevation |
| 18 | NRK | 4.09 | 17.1 | - | |
| 19 | CYP21A2 | 4.09 | 17.1 | 613815 | Congenital adrenal hyperplasia (due to 21-hydroxylase deficiency) |
| 20 | FDX1 | 4.03 | 16.3 | - | |
| 21 | PAPSS2 | 4.00 | 16.0 | 603005 | Brachyolmia type 4 with mild epiphyseal and metaphyseal changes, adrenal hyperandrogenism |
| 22 | DHCR24 | 4.00 | 15.9 | 606418 | Desmosterolosis |
| 25 | TDGF1 | 3.96 | 15.6 | 187395 | Forebrain defects |
| 36 | INHA | 3.67 | 12.8 | 147380 | Adrenocortical carcinoma (paediatric) |
| 43 | APOA1 | 3.42 | 10.7 | 107680 | Apoplipoprotein A-I deficiency |
| 46 | SAMD9 | 3.34 | 10.2 | 610456 | MIRAGE syndrome (includes growth restriction, adrenal hypoplasia, testicular dysfunction) |
| 49 | NR0B1 (DAX-1) |
3.25 | 9.5 | 300473 | X-linked adrenal hypoplasia congenita |
| 50 | HSD3B2 | 3.19 | 9.1 | 613890 | Congenital adrenal hyperplasia (due to 3 β-hydroxysteroid dehydrogenase deficiency type 2) |
| 60 | NR5A1 (SF-1) | 2.96 | 7.8 | 184757 | DSD (testicular dysgenesis/impaired testosterone synthesis) +/- adrenal insufficiency |
| 72 | LDLR | 2.81 | 7.0 | 600694 | Familial hypercholesterolaemia |
| 77 | AMHR2 | 2.73 | 6.7 | 600956 | Persistent Müllerian duct syndrome, type 2 |
| 105 | POR | 2.53 | 5.8 | 124015 | P450 oxidoreductase deficiency/Antley-Bixler syndrome |
| 117 | MRAP | 2.43 | 5.4 | 615410 | Familial glucocorticoid deficiency, type 2 |
| 142 | NPC1 | 2.31 | 5.0 | 607623 | Niemann-Pick disease type C1 |
Figure 5. Analysis of differentially expressed adrenal genes.
(a) Absolute fold change (FC) of the top 20 up-regulated transcription factors in the adrenal gland compared to control samples. Data are derived from the array dataset. (b) Confirmation of differential expression of several novel genes in the adrenal gland (9 wpc) by qRT-PCR. Heart was used as a control tissue. GAPDH was used as a housekeeping gene.
SRY is the primary driver of human testis development
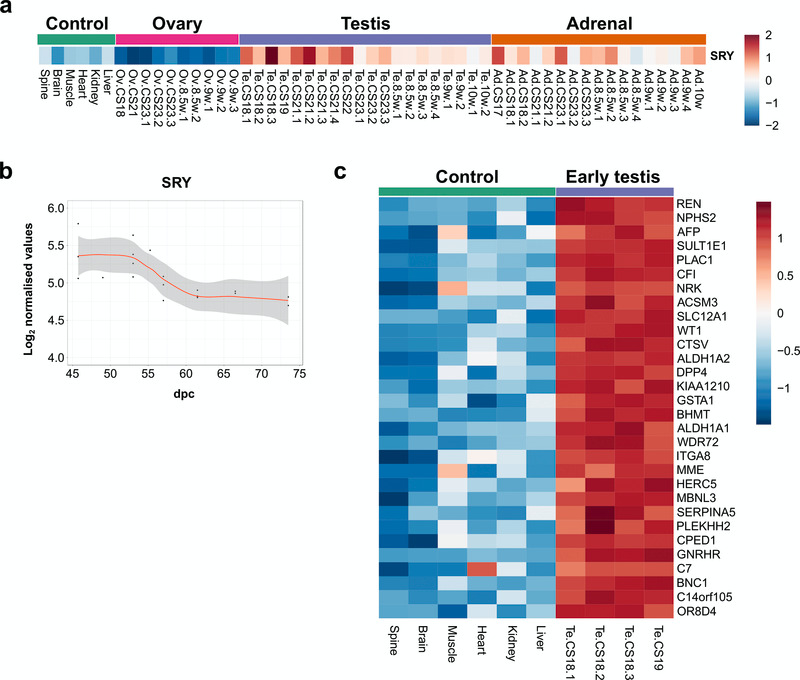
Studies in transgenic mice and humans with SRY deletions and translocations have suggested that SRY is the primary Y-chromosomal testis-determining gene in humans, but direct evidence is limited (Bashamboo et al., 2017; Hanley et al., 2000; Koopman et al., 2016). SRY is thought to be transiently up-regulated in the 46,XY bipotential gonad at around 42 dpc, leading to downstream expression of testis development pathways (Hanley et al., 2000). Analysis of SRY expression in early testis samples (CS18–CS19) compared to control tissues (all 46,XY) showed that SRY is the only significantly differentially-expressed protein coding Y-chromosomal gene (absolute FC 2, P-value≤0.003) (Figure 6a and Dataset 5). Although changes are subtle, there was a clear transient expression of SRY that had occurred by the start of our dataset (around 45 dpc), with a reduction in intensity around CS23 (57 dpc) (Figure 6a, Figure 6b).
Figure 6. SRY expression in early human testis and differential expression of other genes.
(a) Heatmap showing normalised gene expression values for SRY across the whole sample dataset. (b) Scatter plot of normalised gene expression of SRY in testis samples between 45 and 74 dpc. Loess method was used to fit a smooth curve between expression values. (c) Heatmap representing normalised gene expression values for the top 30 differentially up-regulated genes in early testis samples (CS18 and CS19 stages) (N=4) compared to control samples (N=6). Genes are ordered according to decreasing log2FC values. The intensity of gene expression is indicated by a colour scale: blue for lowest and red for highest expression levels. For all samples shown, P-value≤0.05.
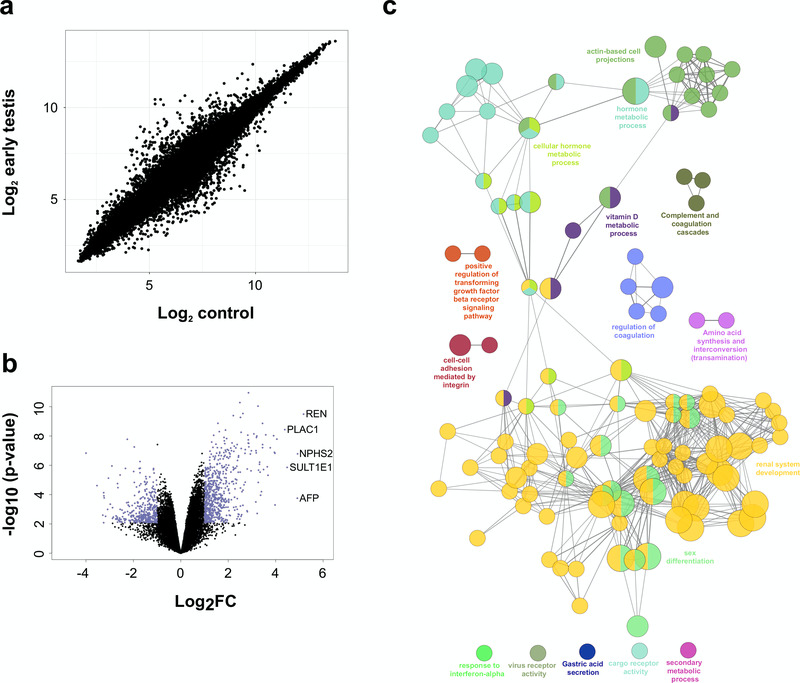
Other genes that are differentially expressed in the early testis compared to controls are shown in the heatmap in Figure 6c, Figure 7a and Figure 7b. These include the gene encoding renin (REN) as well as mesonephric factors such as NPHS2 and WT1. Pathway-enrichment analysis using ClueGO confirmed “sex differentiation” and “renal system development” as the two major up-regulated pathways in the dataset (Figure 7c).
Figure 7. Differentially expressed genes in the early testis compared to control samples.
(a) Correlation plot for log2 mean gene expression levels in the early testis (CS18 to CS19) (N=4) versus control samples (N=6) (Pearson’s product-moment correlation test correlation coefficient=0.968, P-value≤ 2.2e-16). (b) Volcano plot for the differentially expressed genes in early testis versus control samples. Purple colour indicates genes with absolute log2FC≥1 and P-value≤ 0.05. (c) Pathway-enrichment analysis using ClueGO for differentially expressed up-regulated pathways in early testis compared to control samples (log2FC≥1, P-value≤0.005).
Modelling dynamic changes in the testis downstream of SRY
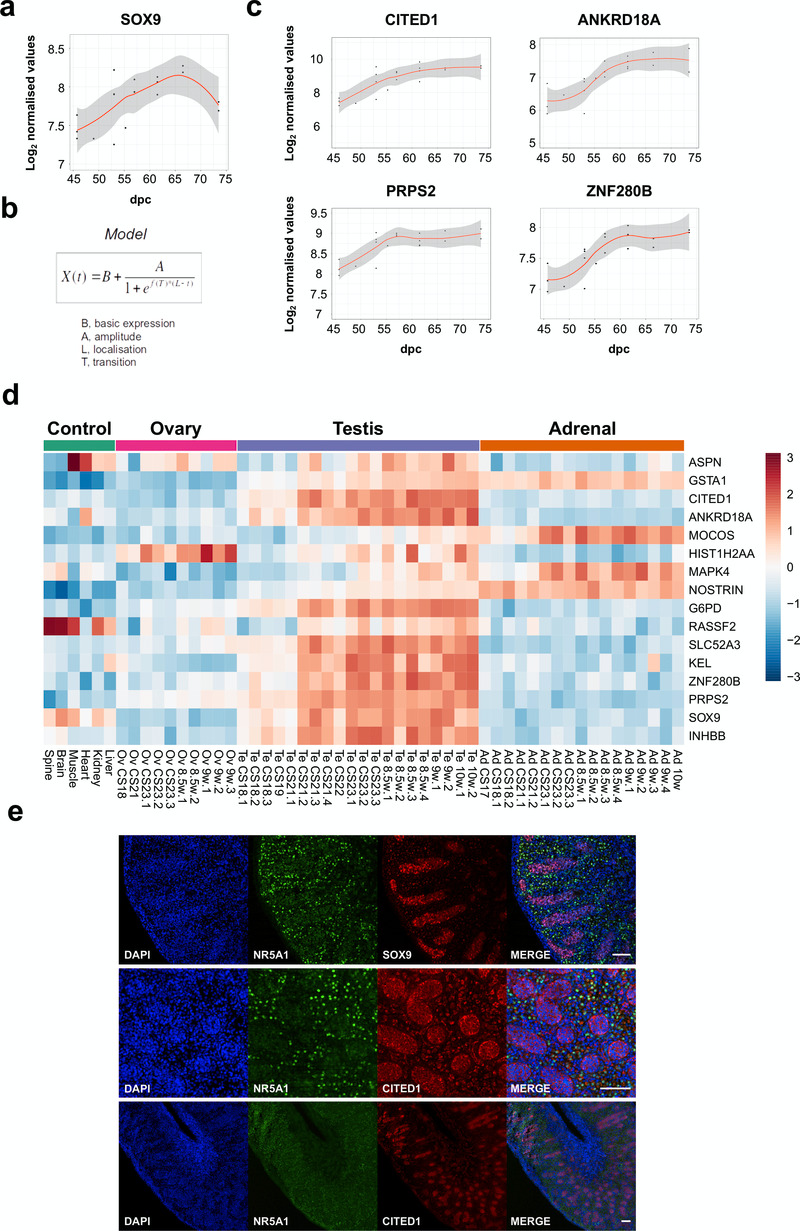
Studies in mice have shown that SOX9 is a target of SRY, and disruption of SOX9 in humans results in testicular dysgenesis (Bashamboo et al., 2017; Bishop et al., 2000; Sekido & Lovell-Badge, 2008). However, the dynamics of SOX9 expression in human testis development are still not well understood and it is not established whether SOX9 is the only potential SRY target (Hanley et al., 2000; Ostrer et al., 2007). Analysis of SOX9 across the testis series revealed an approximate 2-fold increase in gene expression levels with a curvilinear pattern (Figure 8a).
Figure 8. Identification of potential genes downstream of SRY using the BALT model.
(a) Scatter plot showing curvilinear upregulation of SOX9 during testis development (45 to 74 dpc). Loess method was used for fitting a smooth curve between variables. (b) Equation used in the BALT mathematical model (see methods for details). (c) Scatter plots showing changes in gene expression patterns for CITED1, ANKRD18A, PRPS2 and ZNF280B in the developing testis (45 to 74 dpc). Loess method was used for fitting a smooth curve between variables. (d) Heatmap representing normalised gene expression values for genes showing similar expression patterns to SOX9, based on the BALT mathematical model. The intensity of gene expression is indicated by a colour scale: blue for lowest and red for highest expression levels. For all samples shown, P-value≤0.005. (e) Immunohistochemistry for NR5A1 (SF-1, staining Leydig cells), SOX9, and CITED1 in the human fetal testis (11 wpc). Nuclei are counterstained blue with DAPI. Scale bars, 100 µm.
In order to assess detailed patterns and changes in gene expression across the time series dataset, and to be able to group genes with similar dynamic expression patterns together, a phenomenological mathematical model was developed that allowed expression points of any gene to be described based on the basal gene expression value (“B”), the amplitude of the change (“A”), the localisation time of the maximum transition (“L”), and the rate of transition (“T”) (“BALT model”) (Figure 8b) (See methods for details).
Using this approach, several genes were found to have similar expression dynamics to SOX9 (Figure 8c, Figure 8d, Table 2 and Supplementary Table 2). Analysis of the heatmap for these factors in the entire dataset showed that a subset of these genes had predominantly testis-specific upregulation (CITED1, ANKRD18A, G6PD, SLC52A3, KEL, ZNF280B, PRPS2, INHBB) (Figure 8d). Immunohistochemistry of human fetal testis showed strong expression of CITED1 in seminiferous cords in a similar pattern to SOX9 (Figure 8e). Similar expression data are seen for CITED1 in the adult testis (CITED1 in the Human Protein Atlas). Adult expression data confirmed predominant testis expression of ZNF280B and PRPS2, whereas several other genes are expressed in adult testis but also strongly in at least one other system (e.g., ANKRD18A, SLC52A3, KEL) (Human Protein Atlas). In addition, INHBB encodes the β-subunit of inhibin B, a well-established testis protein, which together with SOX9 provides validation for the dataset (Valeri et al., 2013).
Table 2. Potential biological functions of genes up-regulated during early testis development.
Monogenic disorders associated with these factors are shown in italics. Potential function has been summarised from data in the GeneCards database.
| Gene | Protein | Potential function |
|---|---|---|
| ASPN | Asporin | Leucine-rich repeat (LRR) protein associated with the cartilage matrix |
| GSTA1 | Glutathione- S-transferase, alpha-1 | Enzyme involved in detoxification of cellular compounds by conjugation with reduced glutathione |
| CITED1 | CBP/p300-interacting transactivator with Glu/Asp-rich-C-terminal domain |
Transcriptional co-regulator |
| ANKRD18A | Ankyrin repeat domain-containing protein 18A |
Unknown |
| MOCOS | Molybdenum cofactor sulfurase | Enzyme involved in sulphuration of the molybdenum cofactor of xanthine dehydrogenase and aldehyde oxidase |
| HIST1H2AA | Histone gene cluster 1, H2A histone family, member A |
Replication-dependent histone |
| MAPK4 | Mitogen-activated protein kinase 4 | Regulator of cell signalling |
| NOSTRIN | Nitric oxide synthase trafficker | Protein that binds endothelial nitric oxide synthase (eNOS) and triggers translocation of ENOS from the plasma membrane to sub-cellular structures |
| G6PD | Glucose-6-phosphate dehydrogenase |
Enzyme involved in generation of NADPH in the hexose monophosphate pathway (associated with G6PD deficiency) |
| RASSF2 | RAS association domain family protein 2 |
Protein that interacts with RAS proteins in cell growth and mitogenesis |
| SLC52A3 | Solute carrier family 52, member 3 | Transmembrane protein that mediates cellular uptake of riboflavin (associated with Brown-Vialetto-van Laere syndrome type 1) |
| KEL | Kell blood group metalloendopeptidase |
Metalloendopeptidase that generates active endothelin-3 from big endothelin-3 |
| ZNF280B | Zinc finger protein 280B | Transcription factor that upregulates expression of MDM2 and negatively regulates p53 |
| PRPS2 | Phosphoribosylpyrophosphate synthetase 2 |
Enzyme involved in regulation of nucleotide production pathways |
| SOX9 | SRY-box 9 | Transcription factor involved in the regulation of testis development |
| INHBB | Inhibin beta B | Growth and differentiation factor involved in reproduction and development |
Identifying known and novel components of steroidogenesis
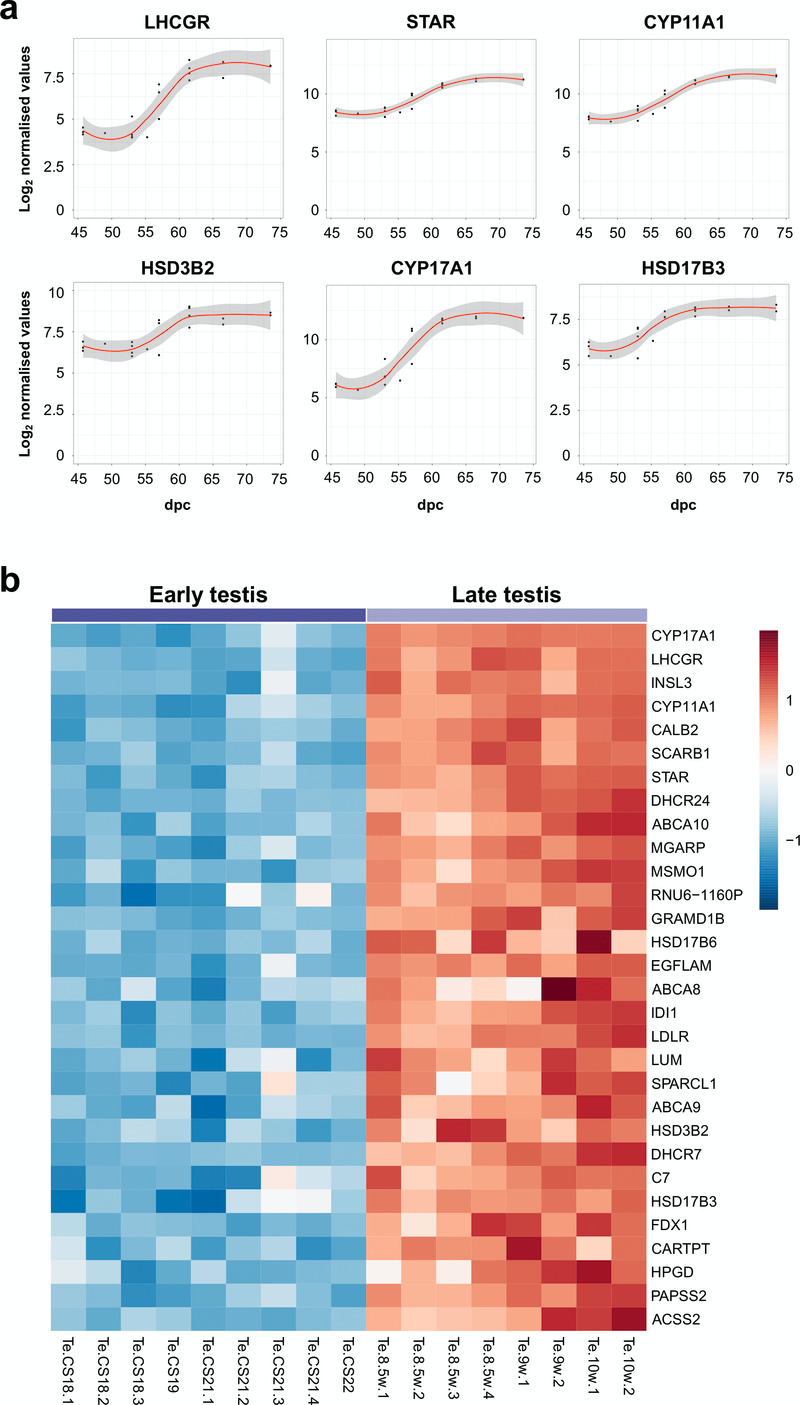
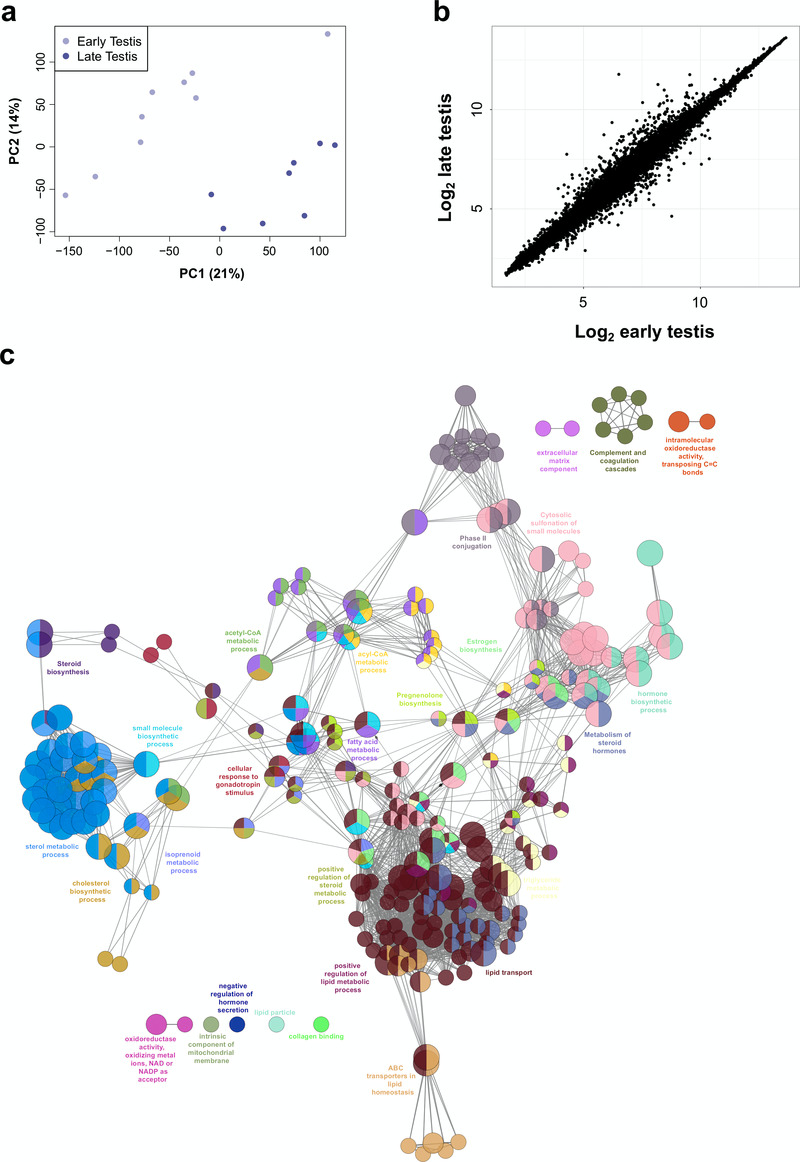
Using the “BALT” model across the time-series dataset, the expression of key known components of testis steroidogenesis showed marked upregulation around a fixed time point (“L”) between 54–57 dpc (LHCGR, STAR, CYP11A1, HSD3B2, CYP17A1, HSD17B3) (Figure 9a). Expression levels of all these enzymes showed a sigmoid-type pattern, suggesting that discrete biological events occur in this fixed window (Supplementary Table 3). The heatmap of normalised gene expression plots for these enzymes showed similar discrete changes between early testis (CS18 to CS22) and late testis (F1 to F3) for many known components involved in testosterone synthesis (Figure 9b). Principal components analysis also demonstrated segregation of samples into two distinct groups (Figure 10a). A subset of genes was seen to be up-regulated with age in a correlation plot (Figure 10b), and pathway-enrichment analysis strongly reflected processes involving “cholesterol”, “sterol” and “steroid” metabolism or biosynthesis (Figure 10c). Therefore, CS23 (8 weeks) was a discrete point around which the onset of testicular steroidogenesis could be modelled, and samples either side of this time point were used for “pre-steroidogenesis” (“early”) versus “post-steroidogenesis” (“late”) comparisons. An overview of key genes in this dataset, many of which are associated with monogenic disorders in humans, is shown in Table 3.
Figure 9. Determination of genes up-regulated with the onset of fetal testicular steroidogenesis.
(a) Scatter plots showing changes in gene expression patterns for known testicular steroidogenic genes, LHCGR, STAR, CYP11A1, HSD3B2, CYP17A1 and HSD17B3. The plot shows normalised gene expression values for testis samples between approximately 46 and 74 dpc. Loess method was used for fitting a smooth curve between variables. (b) Heatmap representing normalised gene expression values for the top 30 differentially up-regulated genes when comparing late (F1 to F3) (N=8) and early (CS18 to CS22) (N=9) testis samples. The intensity of gene expression is indicated by a colour scale: blue for lowest and red for highest expression levels. For all samples shown, P-value≤1e-4. Genes are ordered according to descending log2FC values.
Figure 10. Differentially expressed genes in early compared to late testis samples.
(a) Principal component analysis of early (N=9) compared to late (N=8) testis samples. The scatter plot shows samples plotted on the two first principal components (PC1, PC2). (b) Correlation plot for log2 mean gene expression levels in the early testis (CS18 to CS22) versus late testis (F1 to F3) samples (Pearson’s product-moment correlation test correlation coefficient=0.992, P-value< 2.2e-16). (c) Pathway-enrichment analysis using ClueGO for differentially up-regulated genes in early testis compared to late testis samples (log2FC≥1, P-value≤0.01).
Table 3. The top 20 differentially expressed genes after the onset of testicular steroidogenesis (“ late testis” vs “early testis”), with any associated clinical conditions in humans.
Several other high-ranking genes associated with monogenic disorders are also shown. Genes are ranked based on log2FC in the late testis (n=8) compared to early testis (n=9). Further clinical information is available at Online Mendelian Inheritance in Man (OMIM).
| Rank | Gene | log 2FC | Fold change |
OMIM gene |
Clinical condition (monogenic) |
|---|---|---|---|---|---|
| 1 | CYP17A1 | 5.27 | 38.5 | 609300 | Congenital adrenal hyperplasia (due to 17 α-hydroxylase deficiency) |
| 2 | LHCGR | 3.47 | 11.1 | 152790 | Leydig cell hypoplasia |
| 3 | INSL3 | 3.13 | 8.8 | 146738 | Cryptorchidism |
| 4 | CYP11A1 | 3.08 | 8.5 | 118485 | Congenital adrenal hyperplasia (due to CYP11A1/ P450scc deficiency) |
| 5 | CALB2 | 2.86 | 7.3 | ||
| 6 | SCARB1 | 2.83 | 7.1 | 601040 | High-density lipoprotein elevation |
| 7 | STAR | 2.54 | 5.8 | 600617 | Congenital lipoid adrenal hyperplasia; Familial glucocorticoid deficiency type 3 |
| 8 | DHCR24 | 2.22 | 4.6 | 606418 | Desmosterolosis |
| 9 | ABCA10 | 2.21 | 4.6 | ||
| 10 | MGARP | 2.16 | 4.5 | ||
| 11 | MSMO1 | 2.12 | 4.3 | 607545 | Microcephaly, congenital cataract and psoriasiform dermatitis |
| 12 | RNU6-1160P | 2.11 | 4.3 | ||
| 13 | GRAMD1B | 2.04 | 4.1 | ||
| 14 | HSD17B6 | 2.03 | 4.1 | ||
| 15 | EGFLAM | 2.02 | 4.1 | ||
| 16 | ABCA8 | 2.02 | 4.0 | ||
| 17 | IDI1 | 2.01 | 4.0 | ||
| 18 | LDLR | 1.95 | 3.9 | 600694 | Familial hypercholesterolaemia |
| 19 | LUM | 1.95 | 3.9 | ||
| 20 | SPARCL1 | 1.94 | 3.8 | ||
| 22 | HSD3B2 | 1.92 | 3.8 | 613890 | Congenital adrenal hyperplasia (due to 3 β-hydroxsteroid dehydrogenase deficiency type 2) |
| 23 | DHCR7 | 1.92 | 3.8 | 602858 | Smith-Lemli-Opitz syndrome |
| 24 | C7 | 1.87 | 3.7 | 217070 | C7 (complement) deficiency |
| 25 | HSD17B3 | 1.87 | 3.7 | 605573 | 17 β-hydroxysteroid dehydrogenase deficiency type 3 |
| 28 | HPGD | 1.84 | 3.6 | 601688 | Cranioosteoarthropathy; Primary hypertrophic osteoarthropathy type 1 |
| 29 | PAPSS2 | 1.83 | 3.5 | 603005 | Brachyolmia type 4 with mild epiphyseal and metaphyseal changes, adrenal hyperandrogenism |
| 41 | FDPS | 1.61 | 3.0 | 134629 | Porokeratosis type 9 |
| 42 | MVD | 1.59 | 3.0 | 603236 | Porokeratosis type 7 |
| 49 | NPC1 | 1.55 | 2.9 | 607623 | Niemann-Pick disease type C1 |
| 68 | INHA | 1.40 | 2.6 | 147380 | Adrenocortical carcinoma (paediatric) |
| 100 | AMH | 1.18 | 2.3 | 600956 | Persistent Müllerian duct syndrome, type 1 |
| 119 | POR | 1.07 | 2.1 | 124015 | P450 oxidoreductase deficiency, Antley-Bixler syndrome |
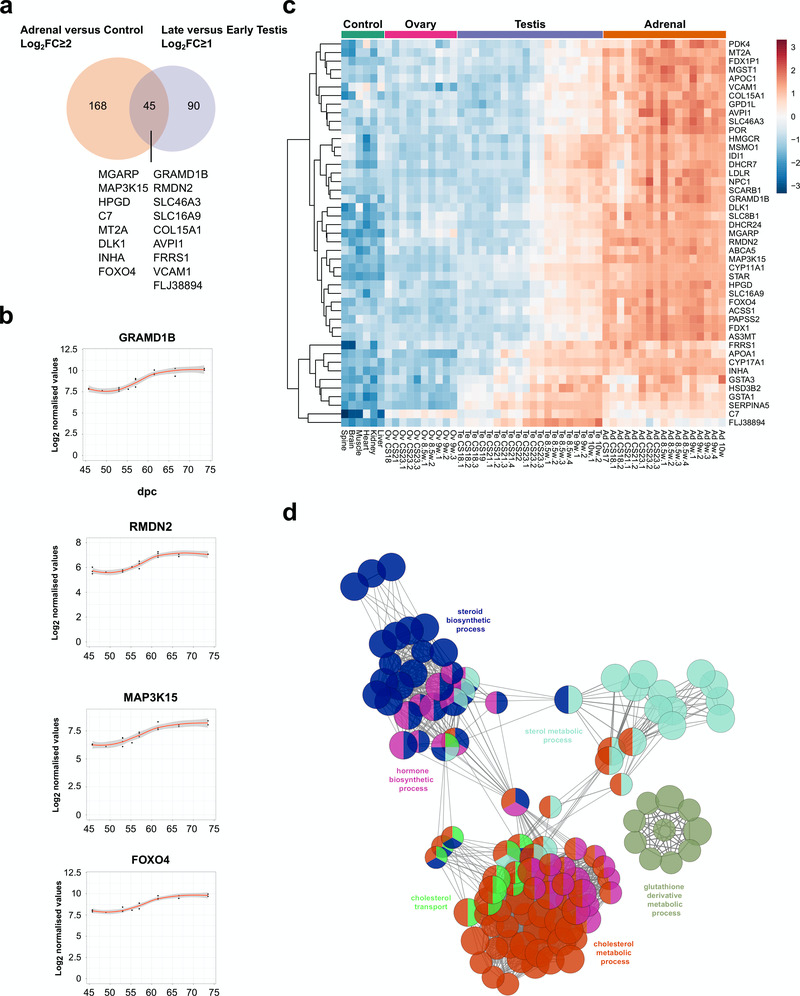
In order to identify potential novel core components of steroidogenesis in the adrenal gland and testis, genes were identified that were both up-regulated in late testis samples compared to early ones (post-steroidogenesis versus pre-steroidogenesis, log2FC≥1), and up-regulated in adrenal samples versus controls (adrenal versus controls, log2FC≥2) (Figure 11a). A total of 45 overlapping genes were found, including all relevant known steroidogenic enzymes and 17 novel genes (Figure 11a–c, Table 4). Enrichment-pathway analysis showed upregulation of genes involved in “cholesterol transport and metabolism” as well as “steroid biosynthesis”, further validating the analysis (Figure 11d). The heatmap for these 45 genes confirmed highly selective expression in the fetal adrenal gland and in the fetal testis, but largely after CS23 (Figure 11c).
Figure 11. Identification of novel steroidogenesis genes.
(a) Venn diagram displaying the overlap for up-regulated genes between adrenal and control samples (log2FC≥2) with late versus early testis samples (log2FC≥1). A subset of genes found in the intersection are displayed, which are not yet established components of steroidogenesis. In all cases, P-value≤0.05. (b) Scatter plots showing changes in gene expression patterns for four novel factors, GRAMD1B, RMDN2, MAP3K15, and FOXO4. The plot shows normalised gene expression values for testis samples between approximately 46 and 74 dpc. Loess method was used for fitting a smooth curve between variables. (c) Heatmap representing normalised gene expression values for the 45 genes identified in the intersection between adrenal versus control and late testis versus early testis. The intensity of gene expression is indicated by a colour scale: blue for lowest and red for highest expression levels. Row-based unsupervised hierarchical clustering was performed. (d) Pathway-enrichment analysis using ClueGO for the 45 genes identified in the intersection shown in (a).
Table 4. Known and potentially novel genes identified as components of steroidogenesis in humans.
These 45 genes were determined from the overlap between genes differentially expressed in the adrenal gland vs. control (log2FC≥2) and in the testis vs. control (log2FC≥1).
| Steroidogenesis |
| CYP17A1, CYP11A1, STAR, FDX1P1, FDX1, PAPSS2, HSD3B2, POR |
| Cholesterol metabolism & oxidative stress |
|
SERPINA5, SCARB1, DHCR24, APOA1, APOC1, MSMO1, AS3MT, LDLR, DHCR7,
ACSS1, NPC1, PDK4, ABCA5, IDI1, GPD1L, HMGCR |
| Oxidative stress |
| GSTA1, MGST1, SLC8B1, GSTA3 |
| Novel |
|
MGARP (OSAP), MAP3K15, HPGD, C7, MT2A, DLK1 (PREF1), INHA, FOXO4,
GRAMD1B, RMDN2, SLC46A3, SLC16A9, COL15A1, AVPI1, FRRS1, VCAM1, FLJ38894 |
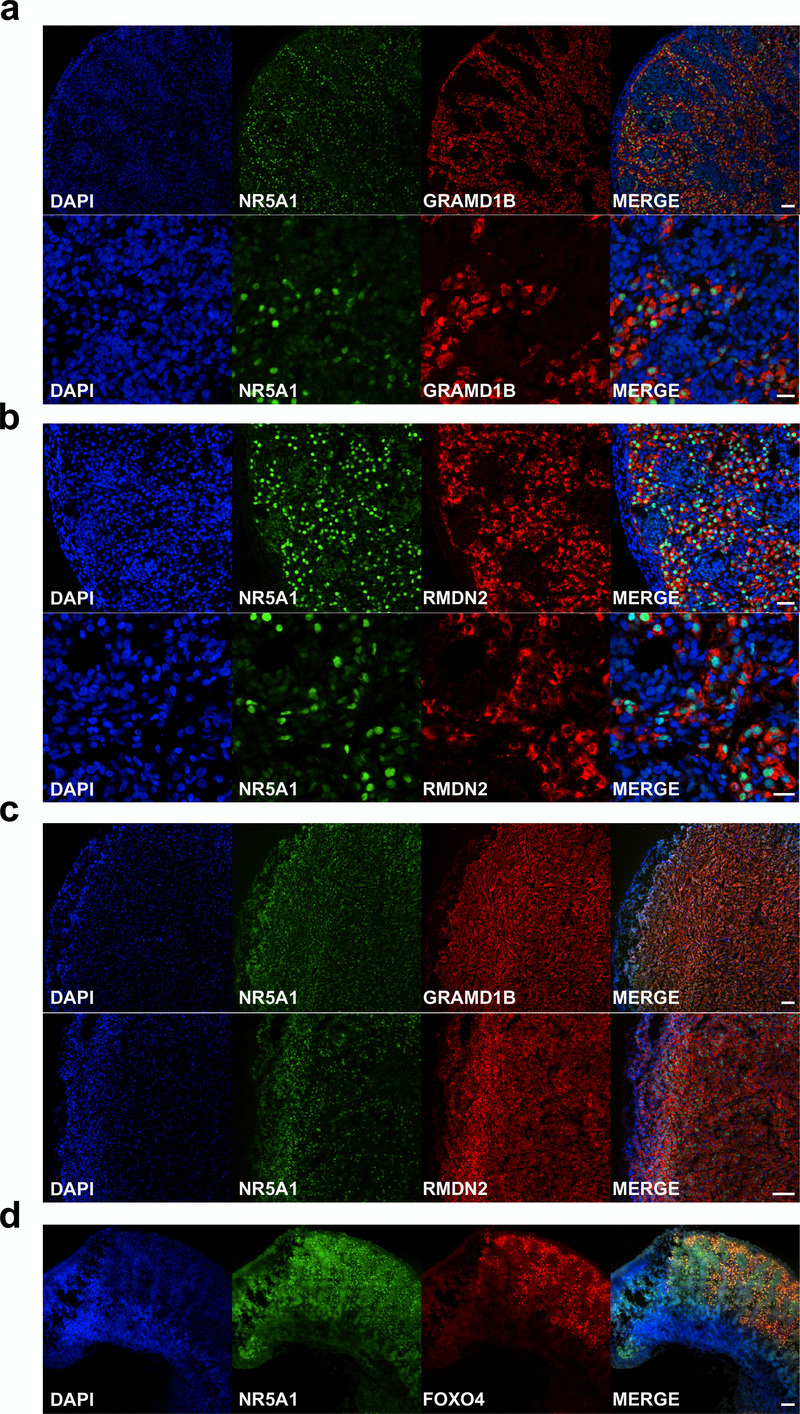
An overview of the proposed function of the 17 potentially novel factors is shown in Table 5. These genes include MGARP (also known as OSAP), which may be involved in mitochondrial trafficking, MAP3K15 (ASK3) involved in cell signalling of stress, and the imprinted gene DLK1 (PREF1) implicated in growth and differentiation (Guasti et al., 2013; Naguro et al., 2012; Zhou et al., 2011). Two genes that have not been studied previously are GRAMD1B and RMDN2 (FAM82A1). These genes are clearly expressed with the onset of steroidogenesis (Figure 11b,c) and show strong expression in the cytoplasm of NR5A1 (SF-1) positive fetal Leydig cells and adrenal cells by immunohistochemistry (Figure 12a–c). However, currently the true biological function of these genes remains unknown. The transcription factor FOXO4 showed expression in the nuclei of Leydig cells in the fetal testis (Figure 12d).
Table 5. Overview of potentially novel genes identified in human steroidogenesis.
Potential function has been summarized from data in the GeneCards database, www.genecards.org
| Rank | Gene | Protein | OMIM gene |
Potential function |
|---|---|---|---|---|
| 1 | MGARP (OSAP) |
Mitochondria localized glutamic acid rich protein |
- | Possible mitochondrial integrity and trafficking of mitochondria along microtubules |
| 2 | MAP3K15 (ASK3) |
Mitogen-activated protein kinase kinase kinase 15 |
300820 | Cell signalling of stress and apoptosis |
| 3 | HPGD | 15-hydroxyprostaglandin dehydrogenase |
601688 | Metabolism and degradation of prostaglandins and NAD-dependent dehydrogenation |
| 4 | C7 | Complement component 7 | 217070 | Cytolytic phase of complement activation forming part of the membrane attack complex |
| 5 | MT2A | Metallothionein 2A | 156360 | Possible regulation of oxidative stress and binding to metal ions |
| 6 | DLK1 (PREF1, FA1) |
Delta-like non-canonical notch ligand 1 |
176290 | Imprinted (paternally expressed) regulator of cell growth and differentiation |
| 7 | INHA | Inhibin alpha | 147380 | Alpha subunit of TGF-beta glycoprotein hormone involved in regulation of hormone secretion, cell growth and apoptosis. Variants implicated in paediatric adrenal cancer. |
| 8 | FOXO4 | Forkhead box O4 | 3000033 | Transcription factor involved in oxidative stress, growth and differentiation, and leukaemia |
| 9 | GRAMD1B | GRAM domain containing 1B | (612559) | Locus has susceptibility to chronic lymphocytic leukaemia |
| 10 | RMDN2 (FAM82A1) |
Regulator of microtubule dynamics 2 |
611872 | Microtubule association during cell division |
| 11 | SLC46A3 | Solute carrier family 46, member 3 |
616764 | Membrane transport of small molecules |
| 12 | SLC16A9 | Solute carrier family 16, member 9 |
614242 | Monocarboxylic acid transporter across plasma membranes |
| 13 | COL15A1 | Collagen type XV, alpha-1 | 120325 | Structural component of muscle and vessels, possible precursor of restin (antiangiogenic) |
| 14 | AVPI1 | Arginine vasopressin induced 1 | - | May be involved in MAP kinase activation and cell cycling |
| 15 | FRRS1 | Ferric chelate reductase 1 | 611578 | Reduces ferric to ferrous iron before its transport from the endosome to cytoplasm |
| 16 | VCAM1 | Vascular cell adhesion molecule 1 |
192225 | Glycoprotein expressed in endothelial cells, interacts with integrins on leukocytes to mediate adhesion and signal transduction |
| 17 | FLJ38894 | - | - |
Figure 12. Validation of novel steroidogenic genes.
(a) Immunohistochemistry for GRAMD1B in human fetal testis at 9 wpc. NR5A1 (SF-1) was used to highlight Leydig cells (green). DAPI was used to counterstain nuclei (blue) and to highlight the outer capsule. Scale bars, 50 µm (top panels) and 20 µm (bottom panels). (b) Immunohistochemistry of RMDN2 performed as above. Scale bars, 50 µm (top panels) and 20 µm (bottom panels). (c) Immunohistochemistry of GRAMD1B and RMDN2 in the fetal adrenal gland at 9 wpc. NR5A1 (SF-1) was used to highlight the definitive zone and fetal zone cells (green). DAPI was used to counterstain nuclei (blue) and to highlight the outer capsule. Scale bars, 100 µm. (d) Immunohistochemistry for FOXO4 in human fetal testis at 11 wpc. NR5A1 (SF-1) was used to highlight Leydig cells (green). DAP-I was used to counterstain nuclei (blue). Scale bar, 100 µm.
Identification of potential secreted proteins in the testis
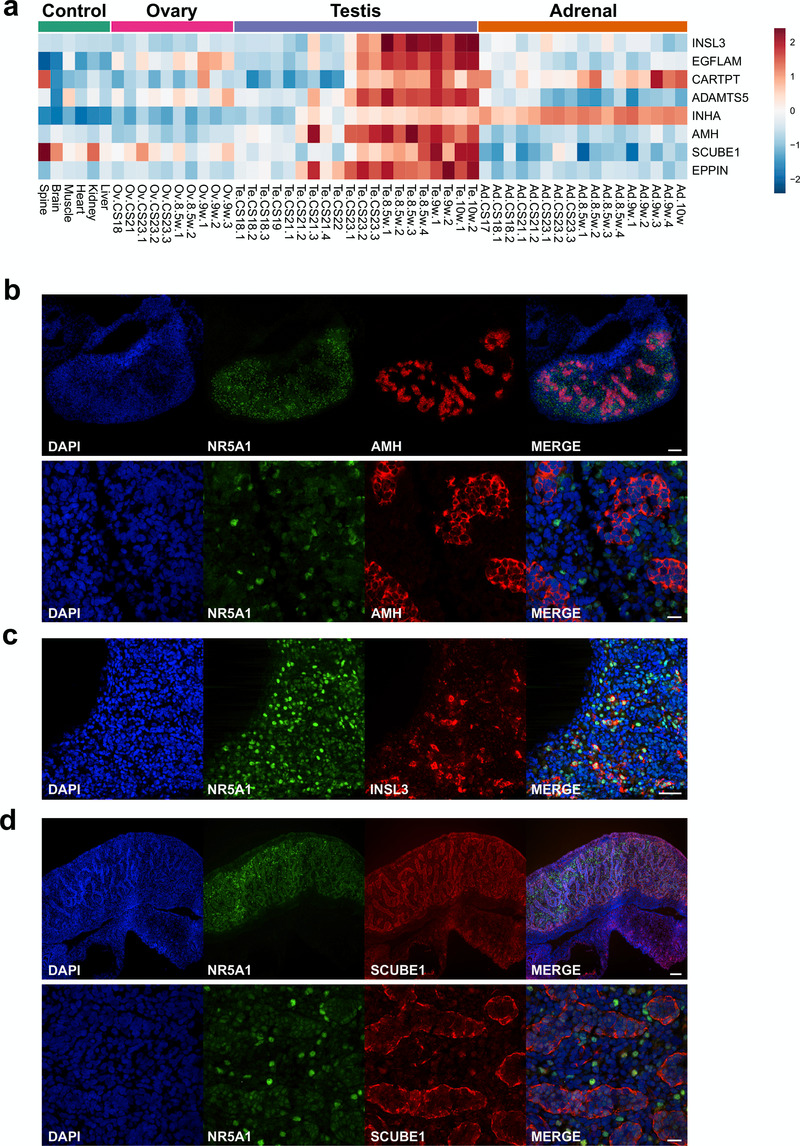
The analysis of genes that showed progressive upregulation in the developing testis was extended to try to identify novel biomarkers. The protein structures encoded by genes that were up-regulated in late testis samples (F1 to F3; FC≥1, Dataset 6) were reviewed for characteristics of secreted proteins, such as the presence of a cleaved signal peptide. Using this approach, the three major testis biomarkers Anti-Müllerian Hormone (AMH/MIS), inhibin α-subunit (INHA) and insulin-like 3 (INSL3) were identified (Figure 13a–c). Novel factors identified included EGFLAM, CARTPT, ADAMTS5, SCUBE1 and EPPIN (Figure 13a). Expression of SCUBE1 was shown in seminiferous cords in the developing testis (Figure 13d).
Figure 13. Identification of potential testis-secreted proteins.
(a) Heatmap representing normalised gene expression values for potential secreted proteins. The intensity of gene expression is indicated by a colour scale: blue for lowest and red for highest expression levels. (b) Immunohistochemistry for AMH (MIS) in human fetal testis at 9 wpc. NR5A1 (SF-1) was used to highlight Leydig cells (green). DAPI was used to counterstain nuclei (blue) and to highlight the outer capsule. Scale bars, 100 µm (top panels) and 20 µm (bottom panels) (c) Immunohistochemistry for INSL3 in human fetal testis at 9 wpc. NR5A1 (SF-1) was used to highlight Leydig cells (green). DAPI was used to counterstain nuclei (blue). Scale bar, 50 µm (d) Immunohistochemistry for SCUBE1 in human fetal testis at 9 wpc. NR5A1 (SF-1) was used to highlight Leydig cells (green). DAPI was used to counterstain nuclei (blue). Scale bars, 100 µm (top panels) and 20 µm (bottom panels).
Ovarian development is not a passive process
Although ovary development was once thought to be a less biologically active process, several studies in the mouse have shown changes in discrete sets of differentially expressed genes in the early ovary (Beverdam & Koopman, 2006; Jameson et al., 2012; Nef et al., 2005). However, it is unclear whether similar effects are also present during early human gonad development.
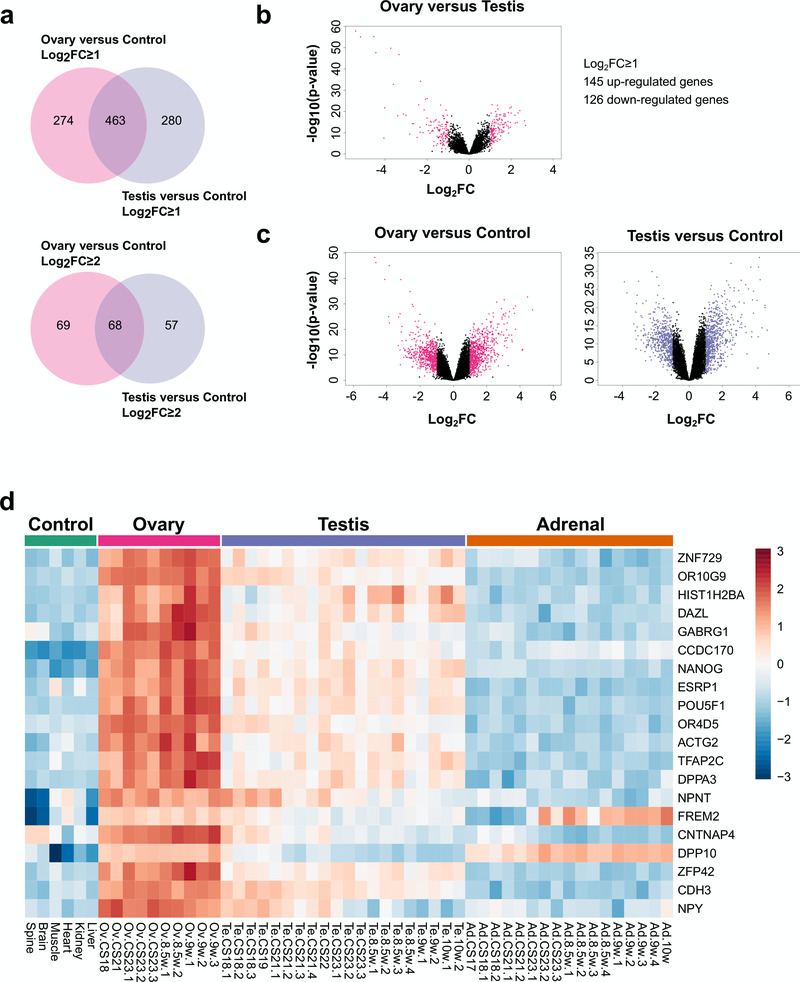
By studying up-regulated genes in the ovary and comparing them to control samples, (Dataset 4) and by studying up-regulated genes in the testis and comparing them to controls (Dataset 3), very similar numbers of gonad-specific differentially expressed genes were found (log2FC≥ 1, ovary 274 versus testis 280; log2FC≥2, ovary 69 versus testis 57) (Figure 14a). As expected, there was substantial overlap in genes that were co-expressed in both the ovary and the testis (log2FC≥1, 463; log2FC≥2, 68). Although the number of strongly up-regulated genes was somewhat higher in the testis compared to the ovary when observed in a volcano plot (Figure 14b), in part due to Y chromosomal genes, a similar scatter of up- and down-regulated genes was seen for the ovary versus control as for the testis versus control, again reinforcing the concept of the developing ovary having discrete genetic activity (Figure 14c).
Figure 14. Ovary development dynamics.
(a) Venn diagram displaying the overlap for up-regulated genes between ovary and control versus testis and control samples using log2FC≥1 (upper panel) and log2FC≥2 (lower panel) cut-offs. P-value≤0.05. (b) Volcano plot analysis of differentially expressed genes in ovary versus testis samples. Genes with an absolute log2FC≥1 and P-value≤0.05 are shown in pink. (c) Volcano plot analysis of differentially expressed genes in the ovary versus control samples (left panel) and testis versus control samples (right panel). Genes with an absolute log2FC≥1 and P-value≤0.05 are shown in pink and purple respectively. (d) Heatmap representing normalised gene expression values for the top 20 differentially expressed genes found only in the ovary versus control samples, using a log2FC≥2 cut-off. The intensity of gene expression is indicated by a colour scale: blue for lowest and red for highest expression levels. P-value≤1e-5. Genes are ordered according to decreasing log2FC values.
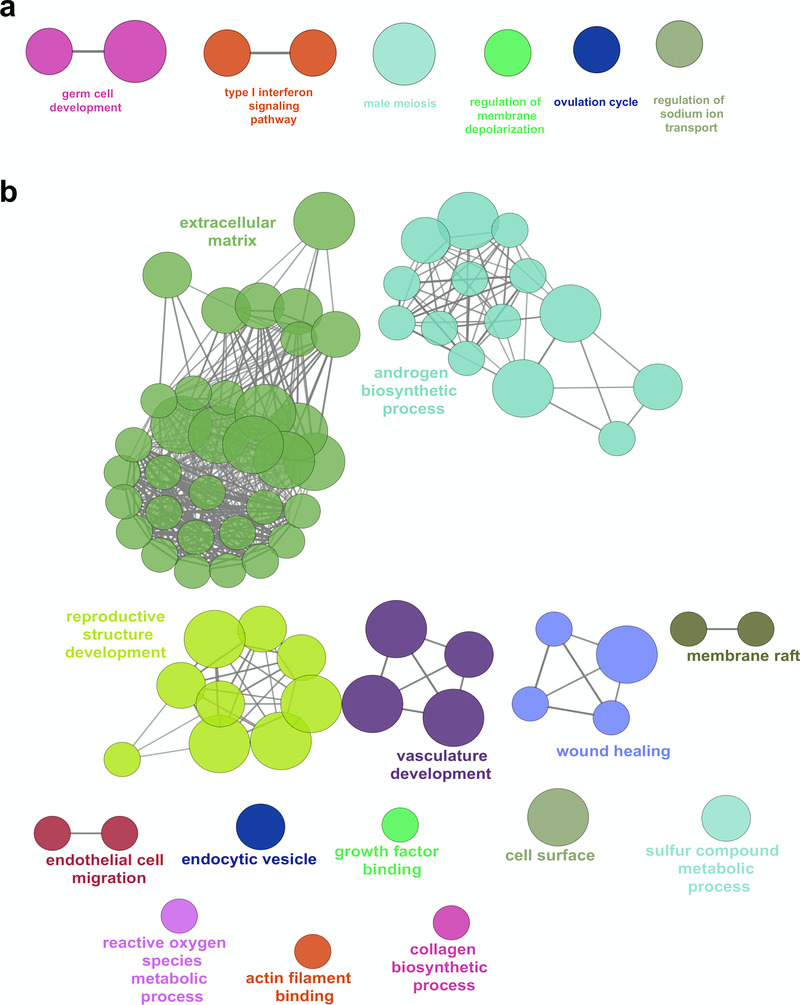
Analysis of the top 20 up-regulated genes in the ovary compared to control data is shown in the heatmap in Figure 14d. Many of these genes were also expressed to some extent in the testis, and may represent factors involved in pluripotency and germ cell development such as HIST1H2BA, NANOG and POU5F1 (also known as OCT4). Expression of several genes appeared to increase in the ovary across the time course (CS18 to F2) and to decrease in the testis, such as OR10G9, GABRG1, OR4D5, NPNT, CNTNAP4 and NPY (Figure 14d). These genes could potentially encode novel components of an ovary-specification program. However, pathway-enrichment analysis of the 274 genes differentially up-regulated in the ovary compared to controls (log2FC≥1, P<0.05) resulted in very few biological processes other than “germ cell development” and “type 1 interferon signalling pathway” (Figure 15a). In contrast, pathway-enrichment analysis for the 280 genes up-regulated in the testis samples versus controls (log2FC≥1, P<0.05) revealed many more detailed networks, with enrichment in terms such as “androgen” and “reproductive” processes (Figure 15b). Taken together, these data suggest that current knowledge of the genetic events in the early stages of human ovary development is still very limited.
Figure 15. Pathway enrichment analysis of ovary-specific genes.
(a) Pathway-enrichment analysis using ClueGO for differentially up-regulated genes in the ovary compared to control, with testis up-regulated genes excluded (log2FC≥1, P-value≤0.05). (b) Pathway-enrichment analysis using ClueGO for differentially up-regulated genes in the testis compared to control, with ovary up-regulated genes excluded (log2FC≥1, P-value≤0.05).
Discussion
Adrenal development and gonad development are two of the most fundamental biological processes. However, current knowledge about the genetic mechanisms underlying these events is derived largely from studies in mice (Beverdam & Koopman, 2006; Inoue et al., 2016; Jameson et al., 2012; McClelland et al., 2015; McClelland & Yao, 2017; McDowell et al., 2012; Nef et al., 2005; Xing et al., 2015) and few data are currently available from humans (Fowler et al., 2009; Gerrard et al., 2016; Houmard et al., 2009; O’Shaughnessy et al., 2007), especially during the first trimester or across all three tissues. Of the published data, the recent study from Gerrard et al. provides the most detailed insight into early human adrenal and testis expressed genes currently available, but this work included just two samples from pooled RNA between CS18 and CS22 (Gerrard et al., 2016). Given the potential biological differences between species, as well as a lack of detailed time course data for all three tissues, our aim was to generate a detailed “Atlas” of genomic events across a critical period in human embryonic and fetal development (6 to 10 wpc).
Initial analysis focused on global gene expression patterns in the adrenal, testis and ovary compared to control tissues. Control samples were chosen to represent a range of developmental tissues (neuroectoderm, mesoderm, endoderm) across the study period. Approximately 0.5–1% of all genes were differentially expressed in each tissue at log2FC≥2 (absolute fold change 4) and 3–5% of all genes at log2FC≥1 (absolute fold change 2). The strong overlap between the adrenal and testis partly reflected shared components of steroidogenesis, whereas the overlap between testis and ovary reflected the shared origins of these tissues as well as the presence of germ cells.
Initial validation of our dataset came from known genes involved in distinct biological processes or monogenic disorders in humans. For example, two of the most strongly expressed transcription factors were the nuclear receptors NR0B1 (DAX-1), which was found in the adrenal and testis, and NR5A1 (SF-1), which was found in all three tissues. Pathogenic variants in NR0B1 cause X-linked adrenal hypoplasia and impaired spermatogenesis in males (Suntharalingham et al., 2015), whereas pathogenic variants in NR5A1 are associated with adrenal insufficiency, testicular dysfunction and primary ovarian insufficiency (Achermann et al., 1999; Lourenço et al., 2009; McElreavey & Achermann, 2017; Suntharalingham et al., 2015). These findings, together with the identification and distribution of steroidogenic components and the detection of known gonadal regulators (e.g. EMX2, LHX9, TCF21, WT1, GATA4) and germ cell pluripotency factors (e.g POU5F1, NANOG) provided strong validation for our dataset (Svingen & Koopman, 2013).
Analysis of genes that were differentially expressed in the adrenal gland provided further support for our experimental approach. The six genes most strongly expressed all represent major core components of adrenal steroidogenesis (CYP17A1, CYP11A1, SULT2A1, STAR, MC2R, CYP11B1) (Miller & Auchus, 2011). All have associations with human adrenal disorders except for sulfotransferase 2A1, which is involved in sulphation of dehydroepiandrosterone (DHEA) to dehydroepiandrosterone sulphate (DHEAS), the main steroid synthesised by the fetal adrenal zone. Novel factors identified in the adrenal gland include adrenal-specific factors such as ASB4 and NPR3, and two kinases (MAP3K15, NRK) that are also expressed in the testis. FOXO4 and TBX3 emerged as novel transcription factors that have not previously been implicated in adrenal development. Of note, several genes associated with adrenal insufficiency in humans were not differentially expressed during early development; namely NNT, TXNRD2, AAAS, MCM4 and SGPL1. Most of these factors have ubiquitous expression and may have a pathogenic effect through oxidative stress pathways or through the accumulation of toxic metabolites. These conditions may be precipitated by postnatal stress and affected children very rarely present with adrenal insufficiency in early infancy, unlike other conditions associated with differentially expressed genes where children often present in the neonatal period (e.g. NR0B1, NR5A1, SAMD9, CDKN1C, MRAP, MC2R, STAR, CYP11A1, HSD3B2, CYP17A1, POR, CYP21A2, CYP11B1) (Guran et al., 2016).
The role of SRY as the primary testis-determining gene has been known for 25 years, following transgenic mouse studies as well as the discovery of duplication of SRY in individuals with 46,XX testicular disorders of sex development (DSD) or disruption of SRY in 46,XY testicular dysgenesis (Bashamboo et al., 2017; Koopman et al., 2016; Svingen & Koopman, 2013). SRY is believed to undergo a transient wave of expression in the developing testis that regulates transcription of downstream factors such as SOX9 and initiates testis development pathways (Hiramatsu et al., 2009). Although in situ hybridization studies of SRY in early human testis have been reported, suggesting onset of SRY expression at approximately 42 dpc, data regarding SRY expression in humans are still very limited (Hanley et al., 2000). SRY is already up-regulated at the start of our study (45 dpc) and falls with the onset of steroidogenesis around 56dpc. By comparing early testis samples (CS18–CS22) with 46,XY controls, SRY was the only protein coding Y-chromosome gene detected. Although it is widely assumed that SRY is the only Y-chromosomal testis-determining factor, this provides the first direct evidence in humans that this is the case.
Other genes up-regulated in the early testis show an overlap with mesonephric development and factors involved in nephrotic syndrome (e.g., NPHS2, WT1). Of note, the highest differentially expressed gene encodes renin (REN), which supports data from previous studies of mouse testis development (Beverdam & Koopman, 2006; Bouma et al., 2007; Inoue et al., 2016; Nef et al., 2005). Renin is a hormone typically secreted from the juxtaglomerular apparatus in the kidney that regulates angiotensin and aldosterone, thereby modulating renal sodium reabsorption and arterial blood pressure. Its role in the testis is unclear, as is its expression in extra-adrenal tissue. Furthermore, it has been proposed that SRY-dependent expression of renin-angiotensin system genes, including REN itself, is a major factor responsible for differences in blood pressure between men and women (Araujo et al., 2015; Prokop et al., 2012).
It is well-established that SOX9 is a target of SRY in testis determination, and SOX9 expression rises in the early human testis following expression of SRY (Hanley et al., 2000; Ostrer et al., 2007; Sekido & Lovell-Badge, 2008). Although data from mice and humans suggest that SOX9 is in itself sufficient to trigger downstream testis pathways (Bishop et al., 2000; Kim et al., 2015) it is unclear if other SRY targets exist, or what direct targets of SOX9 might be. Attempts have been made to investigate this using ChIP-Chip in mice, but this approach is challenging given the amount of fetal tissue needed at the correct stage of development (Bhandari et al., 2012; Li et al., 2014).
An alternative approach is to study the pattern of SOX9 expression across a time-series, and to identify other genes with similar expression profiles. Rather than using a correlative approach, we developed a mathematical model that could be used to capture subtle changes in our dataset more quantitatively. Using this approach, coupled with subsequent review of gene expression in different fetal and adult tissues, we have identified a small group of genes that are up-regulated with SOX9 in the testis (e.g., CITED1, ZNF280B, PRPS2).
Of these, CITED1 (encoding Cbp/p300 interacting transactivator with Glu/Asp rich carboxy-terminal domain 1) is of greatest interest, as it is a transcriptional co-regulator, and strongly expressed in the adult testis, epididymis and pituitary gland. Cited1 knockout mice have growth restriction, late placental insufficiency and abnormalities in nephron patterning and pubertal mammary ductal morphogenesis (Howlin et al., 2006; Novitskaya et al., 2011; Plisov, 2005; Rodriguez et al., 2004). Although Cited1 was identified as a target of Sry in one mouse ChIP-CHIP study (Li et al., 2014), little is known about Cited1 in mouse testis. In contrast, the related protein Cited2 influences adrenal and gonad development in the mouse, potentially through the regulation of Sf1 as well as of Sry itself (Buaas et al., 2009; Combes et al., 2010). CITED2 is ubiquitously expressed in humans and does not show differential expression in our datasets, and pathogenic variants in CITED2 have not been found in patients with adrenal and adrenogonadal disorders, suggesting that CITED1 might be a more important co-regulator in humans (Ferraz-de-Souza et al., 2009). Amongst the other key genes identified, ZNF280B has been proposed to encode a negative regulator of p53 in prostate cancer cells (Gao et al., 2013), whereas PRPS2 encodes a testis specific phosphoribosylpyrophosphate synthetase that may function as an anti-apoptotic factor (Lei et al., 2015; Taira et al., 1990).
The advantage of having multiple serial samples for the testis is that the BALT model could be used to accurately pinpoint the onset of steroidogenesis. Using this approach a distinct sigmoid-shaped upregulation of all the known genes involved in testicular steroidogenesis was seen between 54 and 57 dpc, with marked increases in fold-change. This discrete change in activity allowed us to divide the datasets into “pre-steroidogenic” and “post-steroidogenic” stages.
In order to identify novel components involved in steroidogenesis, genes were identified that were up-regulated in the testis post-steroidogenesis compared to pre-steroidogenesis, and also up-regulated in the adrenal gland compared to control samples. A total of 45 genes were identified, including all known core components of steroidogenesis and many factors involved in cholesterol biosynthesis and oxidative stress.
The 17 “novel” genes identified included MGARP (also known as OSAP), DLK1 (PREF1), and MAP3K15 (ASK3). MGARP has been implicated in mitochondrial trafficking and steroidogenesis (Jia et al., 2014; Jin et al., 2012; Zhou et al., 2011), but may also be a key target of OCT4 during reprogramming to pluripotency (Tiemann et al., 2014). DLK1 is an imprinted gene that is involved in inhibiting adipocyte differentiation, which has previously been shown to be expressed in the outer undifferentiated zone of the male rat adrenal gland and signals to the adrenal capsule to regulate zonation (Guasti et al., 2013). MAP3K15 seems to be a novel kinase linked to steroidogenesis, which has very recently been shown to be differentially expressed in the adult adrenal gland (Bergman et al., 2017). Of note, the Map3k15/Ask3 knockout mouse is hypertensive and studies have linked this kinase to the response to osmotic stress and blood pressure regulation in the mouse kidney, through interactions with WNK1 or WNK4 (Maruyama et al., 2016; Naguro et al., 2012). In our dataset, MAP3K15 was predominantly expressed in steroidogenic tissue, and not in the kidney. Similar findings are seen in RNA expression data for MAP3K15 in the Human Protein Atlas. Taken together, these findings suggest that adrenal effects of MAP3K15 may be an important area to focus future research on.
Other potential novel components of steroidogenesis with unknown function include FOXO4, GRAMD1B and RMDN2 (FAM82A1). FOXO transcription factors play important roles in development, cancer and metabolic homeostasis (Coomans de Brachène & Demoulin, 2016). FOXO4 has been implicated as a negative regulator of cell proliferation in several tumours, but a link to steroidogenesis has not previously been established (Li et al., 2016). GRAMD1B has been shown to be enriched in mouse fetal Leydig cells following CRHR1 agonist stimulation (McDowell et al., 2012), and has been identified in other expression studies of mouse fetal Leydig cells (Inoue et al., 2016; McClelland & Yao, 2017). We have shown by immunohistochemistry that there is clear upregulation of GRAMD1B in the cytoplasm of NR5A1-positive steroidogenic cells with the onset of steroidogenesis in humans. Similar upregulation of expression of RMDN2, a putative microtubule regulator, was also seen in these cells. However, the exact functional role of both GRAMD1B and RMDN2 in steroidogenesis is currently unknown.
In addition to steroidogenesis, the fetal testis has important biological roles through the secretion of proteins or hormones that regulate Müllerian regression (e.g., AMH), endocrine feedback (e.g., inhibin B) and testis descent (e.g. INSL3) (Valeri et al., 2013). These circulating proteins are also proving to be important biomarkers of testis integrity and function postnatally. Using a strategy to identify genes encoding secreted proteins, all three major factors were identified, namely AMH, inhibin (α-subunit) and INSL3. Potential novel secreted proteins include EPPIN, which has been extensively studied as a novel approach to male contraception (O’Rand et al., 2016), and SCUBE1, a secreted cell surface glycoprotein belonging to the EGF superfamily. SCUBE1 was first identified from vascular endothelial cells and is released by activated platelets. Plasma levels of SCUBE1 have been measured as a potential biomarker in several conditions, such as gastric cancer, hypertension, ischaemic heart disease, and stroke (Özkan et al., 2013). Higher levels of SCUBE1 have been reported in adult males compared to females in some, but not all studies, although few control data exist (Ulusoy et al., 2012). An acute elevation in SCUBE1 has been demonstrated in experimental models of rat testis torsion, but it is unclear whether testicular SCUBE1 contributes significantly to circulating levels of SCUBE1 in humans (Turedi et al., 2015).
Although ovary development was originally viewed as a relatively passive process compared to testis development, studies in mice have shown that a similar number of differentially expressed genes are up-regulated in both organs during early development (Beverdam & Koopman, 2006; Bouma et al., 2007; Nef et al., 2005). Our data show that this is true in human gonad development too, with 274 and 280 genes differentially expressed in the ovary and testis, respectively, at log2FC>1, and 69 and 57 genes at log2FC>2. However, pathway-enrichment analysis of the tissue-specific genes revealed virtually no annotated pathways in the ovary, whereas tissue-specific pathways were more abundant in the testis. As expected, amongst the differentially-expressed ovary factors are several key genes involved in germ cell development, e.g. NANOG, POU5F1, TFAP2C, ZFP42 (REX1). In addition, several genes involved in neurotransmission were higher in the developing ovary but were attenuated in the developing testis (OR10G9, GABRG1, OR4D5, NPNT, CNTNAP4 and NPY). These include two olfactory receptors of unknown function, a GABA receptor isoform subunit, neuropeptide Y and contactin associated protein like 4 (CNTNAP4), which has recently been implicated in GABAergic synaptic transmission (Karayannis et al., 2014). Clearly, our understanding of very early human ovary development is still limited.
Conclusion
We have developed an important dataset describing the genomic landscape across three different tissues and spanning critical stages in human embryonic and fetal development. We have identified several important elements previously determined from studies in mice (e.g. Renin in testis), but also several novel aspects that may be specific to humans (e.g. CITED1 rather than CITED2 in early testis). By studying time-series changes and differential expression patterns, we have discovered novel components of these important biological processes and interesting new pathways for further investigation. The dataset is highly validated based on known human disorders of adrenal and gonad function and will provide important insight to assign likely biological significance to new genes identified in whole exome and whole genome studies of patients with undiagnosed conditions. Finally, from the limited number of examples discussed above, novel insights from our genomic atlas could fuel many aspects of translational research, including biological sex-differences in humans, vulnerability to early life insults and programming, blood pressure regulation and stem cell/germ cell development.
Data availability
The data referenced by this article are under copyright with the following copyright statement: Copyright: © 2017 del Valle I et al.
Array data are available from the ArrayExpress database under the accession number E-MTAB-5525.
Datasets are available from Open Science Framework (OSF), with the DOI 10.17605/OSF.IO/WV5DA. (Achermann, 2017).
Dataset 1. Complete dataset of normalised log 2 gene expression levels of all 53 samples included in the study.Dataset 2. Differentially expressed genes in the adrenal gland compared to controls.Dataset 3. Differentially expressed genes in the testis compared to controls.Dataset 4. Differentially expressed genes in the ovary compared to controls.Dataset 5. Differentially expressed genes in the early testis compared to controls.Dataset 6. Differentially expressed genes in the late testis compared to early testis.Consent
Human embryonic and fetal tissue samples used in this study were obtained in collaboration with the MRC/Wellcome Trust-funded Human Developmental Biology Resource (HDBR). The HDBR is a tissue bank regulated by the Human Tissue Authority. Samples were collected with appropriate maternal written consent and with approval from the NRES Committee London-Fulham (REC reference 08/H0712/34+5).
Acknowledgments
We are grateful to Nipurna Jina and Kerra Pearce (UCL Genomics, UCL Great Ormond Street Institute of Child Health), Jacky Pallas (Bloomsbury Centre for Bioinformatics, UCL), and past and present members of the Human Developmental Biology Resource for helpful discussions and technical support. Imaging and analysis was performed at the UCL Great Ormond Street Institute of Child Health Cell Imaging Facility.
Grant Information
JCA is a Wellcome Trust Senior Research Fellow in Clinical Science [grant no. 098513/Z/12/Z], with support from the National Institute for Health Research Biomedical Research Centre at Great Ormond Street Hospital for Children NHS Foundation Trust, and University College London. The human embryonic and fetal material was provided by the Joint MRC/Wellcome Trust [grant no. 099175/Z/12/Z] Human Development Biology Resource.
The funders had no role in study design, data collection and analysis, decision to publish, or preparation of the manuscript.
[version 1; referees: 2 approved]
Supplementary material
Supplementary Table 1. Overview of all 53 tissue samples included in the study.
Supplementary Table 2. Genes that are up-regulated during early testis development with a similar pattern to SOX9, ranked by amplitude of change from basal expression.
Supplementary Table 3. Genes that are up-regulated around the onset of testicular steroidogenesis.
References
- Achermann JC: A genomic atlas of human adrenal and gonad development. OSF. 2017. Data Source [DOI] [PMC free article] [PubMed] [Google Scholar]
- Achermann JC, Ito M, Ito M, et al. : A mutation in the gene encoding steroidogenic factor-1 causes XY sex reversal and adrenal failure in humans. Nat Genet. 1999;22(2):125–126. 10.1038/9629 [DOI] [PubMed] [Google Scholar]
- Araujo FC, Milsted A, Watanabe IK, et al. : Similarities and differences of X and Y chromosome homologous genes, SRY and SOX3, in regulating the renin-angiotensin system promoters. Physiol Genomics. 2015;47(5):177–186. 10.1152/physiolgenomics.00138.2014 [DOI] [PMC free article] [PubMed] [Google Scholar]
- Bashamboo A, Eozenou C, Rojo S, et al. : Anomalies in human sex determination provide unique insights into the complex genetic interactions of early gonad development. Clin Genet. 2017;91(2):143–156. 10.1111/cge.12932 [DOI] [PubMed] [Google Scholar]
- Benjamini Y, Hochberg Y: Controlling the false discovery rate: a practical and powerful approach to multiple testing. J R Stat Soc B. 1995;57(1):289–300. Reference Source [Google Scholar]
- Bergman J, Botling J, Fagerberg L, et al. : The Human Adrenal Gland Proteome Defined by Transcriptomics and Antibody-Based profiling. Endocrinology. 2017;158(2):239–251. 10.1210/en.2016-1758 [DOI] [PubMed] [Google Scholar]
- Beverdam A, Koopman P: Expression profiling of purified mouse gonadal somatic cells during the critical time window of sex determination reveals novel candidate genes for human sexual dysgenesis syndromes. Hum Mol Genet. 2006;15(3):417–431. 10.1093/hmg/ddi463 [DOI] [PubMed] [Google Scholar]
- Bhandari RK, Haque MM, Skinner MK: Global genome analysis of the downstream binding targets of testis determining factor SRY and SOX9. PLoS One. 2012;7(9):e43380. 10.1371/journal.pone.0043380 [DOI] [PMC free article] [PubMed] [Google Scholar]
- Bindea G, Mlecnik B, Hackl H, et al. : ClueGO: a Cytoscape plug-in to decipher functionally grouped gene ontology and pathway annotation networks. Bioinformatics. 2009;25(8):1091–1093. 10.1093/bioinformatics/btp101 [DOI] [PMC free article] [PubMed] [Google Scholar]
- Bishop CE, Whitworth DJ, Qin Y, et al. : A transgenic insertion upstream of sox9 is associated with dominant XX sex reversal in the mouse. Nat Genet. 2000;26(4):490–494. 10.1038/82652 [DOI] [PubMed] [Google Scholar]
- Bouma GJ, Affourtit JP, Bult CJ, et al. : Transcriptional profile of mouse pre-granulosa and Sertoli cells isolated from early-differentiated fetal gonads. Gene Expr Patterns. 2007;7(1–2):113–123. 10.1016/j.modgep.2006.05.011 [DOI] [PubMed] [Google Scholar]
- Buaas FW, Val P, Swain A: The transcription co-factor CITED2 functions during sex determination and early gonad development. Hum Mol Genet. 2009;18(16):2989–3001. 10.1093/hmg/ddp237 [DOI] [PubMed] [Google Scholar]
- Carvalho BS, Irizarry RA: A framework for oligonucleotide microarray preprocessing. Bioinformatics. 2010;26(19):2363–2367. 10.1093/bioinformatics/btq431 [DOI] [PMC free article] [PubMed] [Google Scholar]
- Combes AN, Spiller CM, Harley VR, et al. : Gonadal defects in Cited2-mutant mice indicate a role for SF1 in both testis and ovary differentiation. Int J Dev Biol. 2010;54(4):683–689. 10.1387/ijdb.092920ac [DOI] [PubMed] [Google Scholar]
- Coomans de Brachène A, Demoulin JB: FOXO transcription factors in cancer development and therapy. Cell Mol Life Sci. 2016;73(6):1159–1172. 10.1007/s00018-015-2112-y [DOI] [PMC free article] [PubMed] [Google Scholar]
- Ferraz-de-Souza B, Martin F, Mallet D, et al. : CBP/p300-interacting transactivator, with Glu/Asp-rich C-terminal domain, 2, and pre-B-cell leukemia transcription factor 1 in human adrenal development and disease. J Clin Endocrinol Metab. 2009;94(2):678–683. 10.1210/jc.2008-1064 [DOI] [PMC free article] [PubMed] [Google Scholar]
- Fowler PA, Flannigan S, Mathers A, et al. : Gene expression analysis of human fetal ovarian primordial follicle formation. J Clin Endocrinol Metab. 2009;94(4):1427–1435. 10.1210/jc.2008-2619 [DOI] [PubMed] [Google Scholar]
- Gao S, Hsieh CL, Zhou J, et al. : Zinc Finger 280B regulates sGCα1 and p53 in prostate cancer cells. PLoS One. 2013;8(11):e78766. 10.1371/journal.pone.0078766 [DOI] [PMC free article] [PubMed] [Google Scholar]
- Gerrard DT, Berry AA, Jennings RE, et al. : An integrative transcriptomic atlas of organogenesis in human embryos. eLife. 2016;5: pii-e15657. 10.7554/eLife.15657 [DOI] [PMC free article] [PubMed] [Google Scholar]
- Goto M, Piper Hanley K, Marcos J, et al. : In humans, early cortisol biosynthesis provides a mechanism to safeguard female sexual development. J Clin Invest. 2006;116(4):953–960. 10.1172/JCI25091 [DOI] [PMC free article] [PubMed] [Google Scholar]
- Guasti L, Cavlan D, Cogger K, et al. : Dlk1 up-regulates Gli1 expression in male rat adrenal capsule cells through the activation of β1 integrin and ERK1/2. Endocrinology. 2013;154(12):4675–4684. 10.1210/en.2013-1211 [DOI] [PubMed] [Google Scholar]
- Guran T, Buonocore F, Saka N, et al. : Rare Causes of Primary Adrenal Insufficiency: Genetic and Clinical Characterization of a Large Nationwide Cohort. J Clin Endocrinol Metab. 2016;101(1):284–292. 10.1210/jc.2015-3250 [DOI] [PMC free article] [PubMed] [Google Scholar]
- Hanley NA, Hagan DM, Clement-Jones M, et al. : SRY, SOX9, and DAX1 expression patterns during human sex determination and gonadal development. Mech Dev. 2000;91(1–2):403–407. 10.1016/S0925-4773(99)00307-X [DOI] [PubMed] [Google Scholar]
- Hern WM: Correlation of fetal age and measurements between 10 and 26 weeks of gestation. Obstet Gynecol. 1984;63(1):26–32. [PubMed] [Google Scholar]
- Hiramatsu R, Matoba S, Kanai-Azuma M, et al. : A critical time window of Sry action in gonadal sex determination in mice. Development. 2009;136(6):129–138. 10.1242/dev.029587 [DOI] [PubMed] [Google Scholar]
- Houmard B, Small C, Yang L, et al. : Global gene expression in the human fetal testis and ovary. Biol Reprod. 2009;81(2):438–443. 10.1095/biolreprod.108.075747 [DOI] [PMC free article] [PubMed] [Google Scholar]
- Howlin J, McBryan J, Napoletano S, et al. : CITED1 homozygous null mice display aberrant pubertal mammary ductal morphogenesis. Oncogene. 2006;25(10):1532–1542. 10.1038/sj.onc.1209183 [DOI] [PubMed] [Google Scholar]
- Inoue M, Shima Y, Miyabayashi K, et al. : Isolation and Characterization of Fetal Leydig Progenitor Cells of Male Mice. Endocrinology. 2016;157(3):1222–1233. 10.1210/en.2015-1773 [DOI] [PubMed] [Google Scholar]
- Ishimoto H, Jaffe RB: Development and function of the human fetal adrenal cortex: a key component in the feto-placental unit. Endocr Rev. 2011;32(3):317–355. 10.1210/er.2010-0001 [DOI] [PMC free article] [PubMed] [Google Scholar]
- Jameson SA, Natarajan A, Cool J, et al. : Temporal transcriptional profiling of somatic and germ cells reveals biased lineage priming of sexual fate in the fetal mouse gonad. PLoS Genet. 2012;8(3):e1002575. 10.1371/journal.pgen.1002575 [DOI] [PMC free article] [PubMed] [Google Scholar]
- Jia L, Liang T, Yu X, et al. : MGARP regulates mouse neocortical development via mitochondrial positioning. Mol Neurobiol. 2014;49(3):1293–1308. 10.1007/s12035-013-8602-8 [DOI] [PubMed] [Google Scholar]
- Jin D, Li R, Mao D, et al. : Mitochondria-localized glutamic acid-rich protein (MGARP) gene transcription is regulated by Sp1. PLoS One. 2012;7(11):e50053. 10.1371/journal.pone.0050053 [DOI] [PMC free article] [PubMed] [Google Scholar]
- Karayannis T, Au E, Patel JC, et al. : Cntnap4 differentially contributes to GABAergic and dopaminergic synaptic transmission. Nature. 2014;511(7508):236–240. 10.1038/nature13248 [DOI] [PMC free article] [PubMed] [Google Scholar]
- Kim GJ, Sock E, Buchberger A, et al. : Copy number variation of two separate regulatory regions upstream of SOX9 causes isolated 46,XY or 46,XX disorder of sex development. J Med Genet. 2015;52(4):240–247. 10.1136/jmedgenet-2014-102864 [DOI] [PubMed] [Google Scholar]
- Koopman P, Sinclair A, Lovell-Badge R: Of sex and determination: marking 25 years of Randy, the sex-reversed mouse. Development. 2016;143(10):1633–1637. 10.1242/dev.137372 [DOI] [PubMed] [Google Scholar]
- Leek JT, Johnson WE, Parker HS, et al. : The SVA package for removing batch effects and other unwanted variation in high-throughput experiments. Bioinformatics. 2012;28(6):882–883. 10.1093/bioinformatics/bts034 [DOI] [PMC free article] [PubMed] [Google Scholar]
- Lei B, Wan B, Peng J, et al. : PRPS2 Expression Correlates with Sertoli-Cell only Syndrome and Inhibits the Apoptosis of TM4 Sertoli Cells. J Urol. 2015;194(5):1491–1497. 10.1016/j.juro.2015.04.116 [DOI] [PubMed] [Google Scholar]
- Li J, Jiang Z, Han F, et al. : FOXO4 and FOXD3 are predictive of prognosis in gastric carcinoma patients. Oncotarget. 2016;7(18):25585–25592. 10.18632/oncotarget.8339 [DOI] [PMC free article] [PubMed] [Google Scholar]
- Li Y, Zheng M, Lau YF: The sex-determining factors SRY and SOX9 regulate similar target genes and promote testis cord formation during testicular differentiation. Cell Rep. 2014;8(3):723–733. 10.1016/j.celrep.2014.06.055 [DOI] [PubMed] [Google Scholar]
- Lourenço, D, Brauner R, Lin L, et al. : Mutations in NR5A1 associated with ovarian insufficiency. N Engl J Med. 2009;360(12):1200–1210. 10.1056/NEJMoa0806228 [DOI] [PMC free article] [PubMed] [Google Scholar]
- Maruyama J, Kobayashi Y, Umeda T, et al. : Osmotic stress induces the phosphorylation of WNK4 Ser575 via the p38MAPK-MK pathway. Sci Rep. 2016;6:18710. 10.1038/srep18710 [DOI] [PMC free article] [PubMed] [Google Scholar]
- McClelland KS, Bell K, Larney C, et al. : Purification and Transcriptomic Analysis of Mouse Fetal Leydig Cells Reveals Candidate Genes for Specification of Gonadal Steroidogenic Cells. Biol Reprod. 2015;92(6): 145,1–17. 10.1095/biolreprod.115.128918 [DOI] [PubMed] [Google Scholar]
- McClelland KS, Yao HH: Leveraging Online Resources to Prioritize Candidate Genes for Functional Analyses: Using the Fetal Testis as a Test Case. Sex Dev. 2017;11(1):1–20. 10.1159/000455113 [DOI] [PMC free article] [PubMed] [Google Scholar]
- McDowell EN, Kisielewski AE, Pike JW, et al. : A transcriptome-wide screen for mRNAs enriched in fetal Leydig cells: CRHR1 agonism stimulates rat and mouse fetal testis steroidogenesis. PLoS One. 2012;7(10):e47359. 10.1371/journal.pone.0047359 [DOI] [PMC free article] [PubMed] [Google Scholar]
- McElreavey K, Achermann JC: Steroidogenic Factor-1 (SF-1, NR5A1) and46,XX Ovotesticular Disorders of Sex Development:One Factor, Many Phenotypes. Horm Res Paediatr. 2017;8(3):189–190. 10.1159/000454806 [DOI] [PMC free article] [PubMed] [Google Scholar]
- Miller WL, Auchus RJ: The molecular biology, biochemistry, and physiology of human steroidogenesis and its disorders. Endocr Rev. 2011;32(1):81–151. 10.1210/er.2010-0013 [DOI] [PMC free article] [PubMed] [Google Scholar]
- Naguro I, Umeda T, Kobayashi Y, et al. : ASK3 responds to osmotic stress and regulates blood pressure by suppressing WNK1-SPAK/OSR1 signaling in the kidney. Nat Commun. 2012;3:1285. 10.1038/ncomms2283 [DOI] [PubMed] [Google Scholar]
- Nef S, Schaad O, Stallings NR, et al. : Gene expression during sex determination reveals a robust female genetic program at the onset of ovarian development. Dev Biol. 2005;287(2):361–377. 10.1016/j.ydbio.2005.09.008 [DOI] [PubMed] [Google Scholar]
- Novitskaya T, Baserga M, de Caestecker MP: Organ-specific defects in insulin-like growth factor and insulin receptor signaling in late gestational asymmetric intrauterine growth restriction in Cited1 mutant mice. Endocrinology. 2011;152(6):2503–2516. 10.1210/en.2010-1385 [DOI] [PMC free article] [PubMed] [Google Scholar]
- O'Rahilly R, Müller F: Developmental stages in human embryos.Washington. ISBN 0-87279-666-3.1987;637:306 Reference Source [Google Scholar]
- O’Rand MG, Silva EJ, Hamil KG: Non-hormonal male contraception: A review and development of an Eppin based contraceptive. Pharmacol Ther. 2016;157:105–111. 10.1016/j.pharmthera.2015.11.004 [DOI] [PMC free article] [PubMed] [Google Scholar]
- O’Shaughnessy PJ, Baker PJ, Monteiro A, et al. : Developmental changes in human fetal testicular cell numbers and messenger ribonucleic acid levels during the second trimester. J Clin Endocrinol Metab. 2007;92(12):4792–4801. 10.1210/jc.2007-1690 [DOI] [PubMed] [Google Scholar]
- Ostrer H, Huang HY, Masch RJ, et al. : A cellular study of human testis development. Sex Dev. 2007;1(5):286–292. 10.1159/000108930 [DOI] [PubMed] [Google Scholar]
- Özkan G, Ulusoy S, Menteşe A, et al. : New marker of platelet activation, SCUBE1, is elevated in hypertensive patients. Am J Hypertens. 2013;26(6):748–753. 10.1093/ajh/hpt007 [DOI] [PubMed] [Google Scholar]
- Plisov S, Tsang M, Shi G, et al. : Cited1 is a bifunctional transcriptional cofactor that regulates early nephronic patterning. J Am Soc Nephrol. 2005;16(6):1632–1644. 10.1681/ASN.2004060476 [DOI] [PubMed] [Google Scholar]
- Prokop JW, Watanabe IK, Turner ME, et al. : From rat to human: regulation of Renin-Angiotensin system genes by sry. Int J Hypertens. 2012;2012:724240. 10.1155/2012/724240 [DOI] [PMC free article] [PubMed] [Google Scholar]
- Rodriguez TA, Sparrow DB, Scott AN, et al. : Cited1 is required in trophoblasts for placental development and for embryo growth and survival. Mol Cell Biol. 2004;24(1):228–244. 10.1128/MCB.24.1.228-244.2004 [DOI] [PMC free article] [PubMed] [Google Scholar]
- Sekido R, Lovell-Badge R: Sex determination involves synergistic action of SRY and SF1 on a specific Sox9 enhancer. Nature. 2008;453(7197):930–934. 10.1038/nature06944 [DOI] [PubMed] [Google Scholar]
- Smyth GK: Linear models and empirical bayes methods for assessing differential expression in microarray experiments. Stat Appl Genet Mol Biol. 2004;3:1–26, Article3. 10.2202/1544-6115.1027 [DOI] [PubMed] [Google Scholar]
- Suntharalingham JP, Buonocore F, Duncan AJ, et al. : DAX-1 (NR0B1) and steroidogenic factor-1 (SF-1, NR5A1) in human disease. Best Pract Res Clin Endocrinol Metab. 2015;29(4):607–619. 10.1016/j.beem.2015.07.004 [DOI] [PMC free article] [PubMed] [Google Scholar]
- Svingen T, Koopman P: Building the mammalian testis: Origins, differentiation, and assembly of the component cell populations. Genes Dev. 2013;27(22):2409–2426. 10.1101/gad.228080.113 [DOI] [PMC free article] [PubMed] [Google Scholar]
- Taira M, Iizasa T, Shimada H, et al. : A human testis-specific mRNA for phosphoribosylpyrophosphate synthetase that initiates from a non-AUG codon. J Biol Chem. 1990;265(27):16491–16497. [PubMed] [Google Scholar]
- Tiemann U, Marthaler AG, Adachi K, et al. : Counteracting activities of OCT4 and KLF4 during reprogramming to pluripotency. Stem Cell Reports. 2014;2(3):351–365. 10.1016/j.stemcr.2014.01.005 [DOI] [PMC free article] [PubMed] [Google Scholar]
- Turedi S, Tatli O, Alver A, et al. : The Diagnostic Value of Plasma SCUBE1, a Novel Biomarker of Platelet Activation, in Testicular Torsion: A Randomized, Controlled, Experimental Study. Urology. 2015;86(3):516–520. 10.1016/j.urology.2015.05.014 [DOI] [PubMed] [Google Scholar]
- Ulusoy S, Ozkan G, Menteşe A, et al. : Signal peptide-CUB-EGF domain-containing protein 1 (SCUBE1) level in hemodialysis patients and parameters affecting that level. Clin Biochem. 2012;45(16–17):1444–1449. 10.1016/j.clinbiochem.2012.07.103 [DOI] [PubMed] [Google Scholar]
- Valeri C, Schteingart HF, Rey RA: The prepubertal testis: biomarkers and functions. Curr Opin Endocrinol Diabetes Obes. 2013;20(3):224–233. 10.1097/MED.0b013e328360be2c [DOI] [PubMed] [Google Scholar]
- Xing Y, Lerario AM, Rainey W, et al. : Development of Adrenal Cortex Zonation. Endocrinol Metab Clin North Am. 2015;44(2):243–274. 10.1016/j.ecl.2015.02.001 [DOI] [PMC free article] [PubMed] [Google Scholar]
- Zhou M, Wang Y, Qi S, et al. : The expression of a mitochondria-localized glutamic acid-rich protein (MGARP/OSAP) is under the regulation of the HPG axis. Endocrinology. 2011;152(6):2311–2320. 10.1210/en.2011-0050 [DOI] [PubMed] [Google Scholar]


