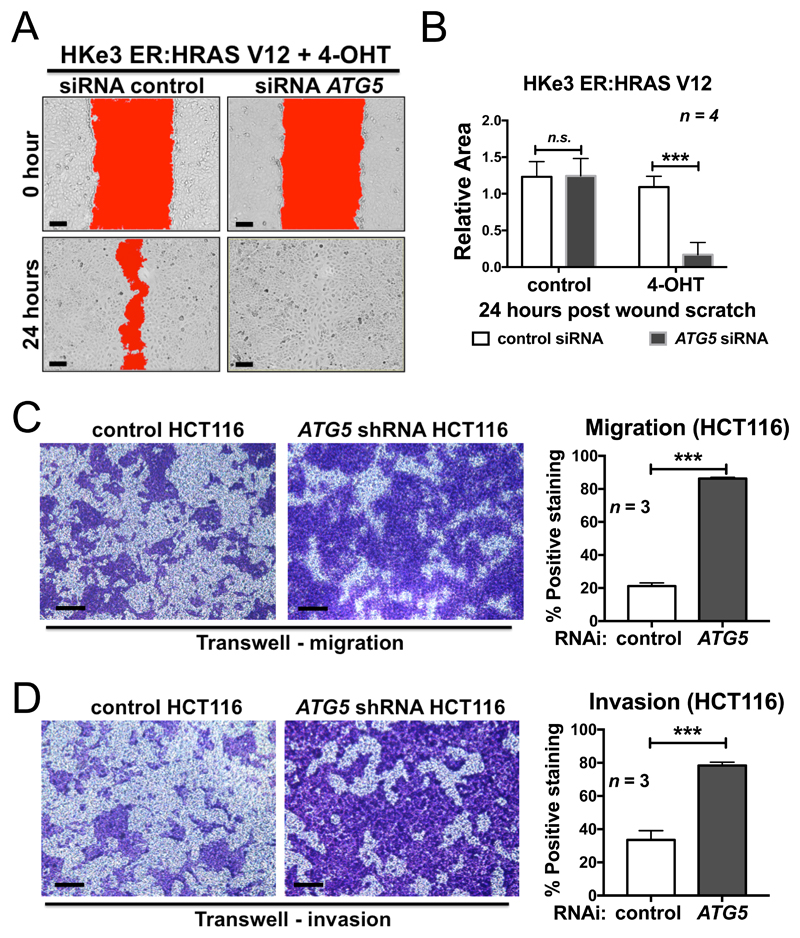
Figure 3. Autophagy inhibition promotes oncogenic RAS-induced cell migration and invasion.
(A) Scratch wound assay of 4-OHT-treated HKe3 ER:HRAS V12 cells transfected with control or ATG5 siRNA. Representative images of 4-OHT-treated HKe3 ER:HRAS V12 cells with the indicated treatments at time 0 h or 24 h after the scratch wound. Wounds have been artificially colored red to aid visualization. Scale bar: 50 μm. (B) Scratch wound assay of control or 4-OHT-treated HKe3 ER:HRAS V12 cells transfected with control or ATG5 siRNA 24 h after the scratch wound. The graph shows the area of a wound evaluated with ImageJ, and data are mean ± s.d. n = 4. n.s. P > 0.05, *** P < 0.001. (C) Transwell migration assays in HCT116 cells infected with control or ATG5 shRNA. Cells were stained with crystal violet. Scale bar: 100 μm. Data are mean ± s.d. n = 3. *** P < 0.001. (D) Transwell Matrigel invasion assays in HCT116 cells infected with control or ATG5 shRNA. Cells were stained with crystal violet. Scale bar: 100 μm. Data are mean ± s.d. n = 3. *** P < 0.001.

