Fig 2.
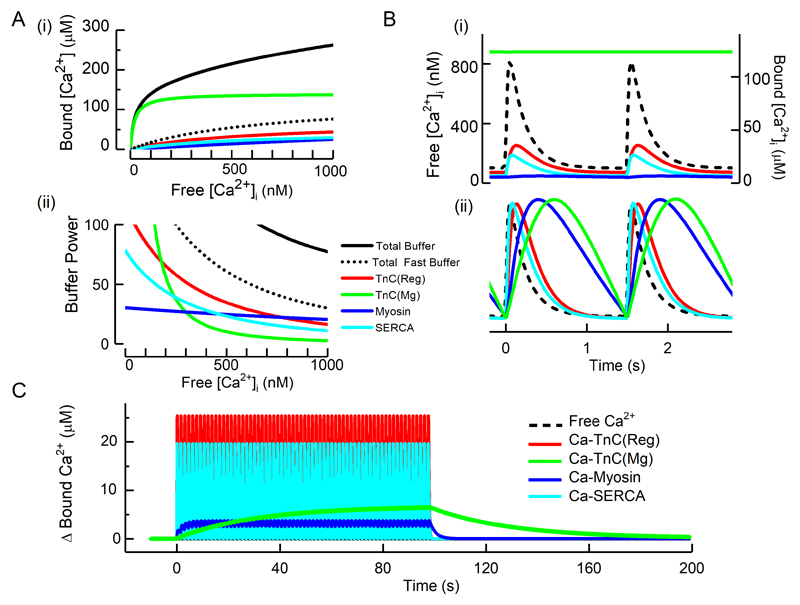
Properties of cellular cardiac Ca2+ buffers. A (i) Steady state Ca2+ buffering showing the dependence of bound on free Ca2+. The coloured curves show the contributions of the two Ca2+ binding sites (regulatory and Mg) of TnC, myosin and SERCA. The solid black line shows the total, calculated as the sum of these components and the others listed in Table 1. The dotted black line represents the sum of the fast buffers (top part of Table 1). (ii) Buffer power (calculated as in equation 2) as a function of [Ca2+]i. B. Time course of change of bound [Ca2+] in response to systolic Ca2+ transients applied at 1.5 Hz. (i) Absolute levels of [Ca2+]. The dashed line shows free [Ca2+] and the coloured traces the concentration of the Ca2+-bound form of the various ligands. (ii) normalized concentrations to emphasise kinetics. C. The change of bound Ca2+ in response to a series of Ca2+ transients (not shown) applied at 1.5 Hz.

