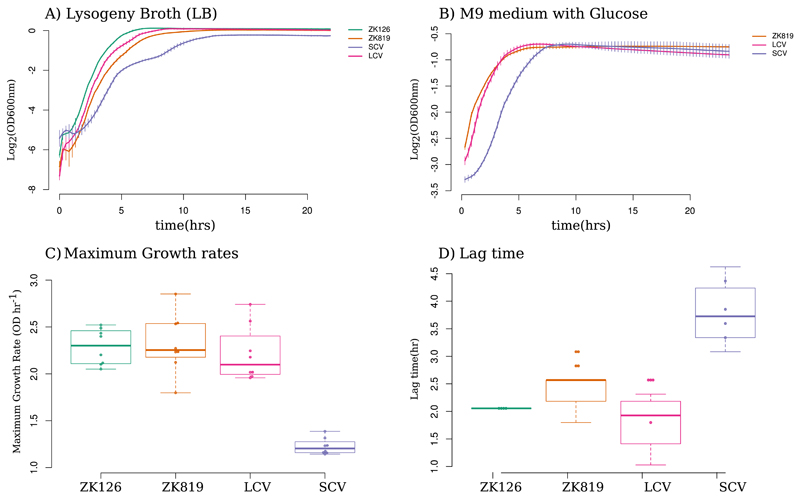
Fig 2.
Growth characteristics of SC. (A and B) Growth curves of SC compared to coexisting strain (LCV), evolutionary ancestor (ZK819), and parent of ancestor (ZK126) in rich (LB) (A) and minimal (M9 plus glucose) (B) media. (C) Distribution of maximum growth rates of SCV, LCV, and ancestor strains. Error bars indicate standard deviations (n = 8). (D) Distribution of lag time for SCV, LCV, and ancestor strains. Error bars indicate standard deviations (n = 8).

