

Abstract
Major depression disorder (MDD) is the single greatest cause of disability and morbidity, and affects about 10% of the population worldwide. Currently, there are no clinically useful diagnostic biomarkers that are able to confirm a diagnosis of MDD from bipolar disorder (BD) in the early depressive episode. Exploring translational biomarkers of mood disorders based on machine learning is a very challenging approach, with great potential to improve our understanding of these disorders. In this paper, we review machine learning methods used for brain imaging classification and predictions, specifically, for major depression disorder, and provide an overview of studies that have used magnetic resonance imaging data to 1) classify MDDs from controls or other mood disorders; 2) investigate treatment outcome predictors for individual patients with mood disorders. Challenges, future directions and potential limitations related to MDD biomarker identification are also discussed, with a goal of offering a comprehensive overview that may help readers to better understand the applications of neuroimaging data mining in depression. We hope such efforts may highlight the need for an urgently-needed paradigm shift in treatment, to guide personalized optimal clinical care.
Keywords: Major Depressive Disorder (MDD), Machine Learning, Classification, Magnetic Resonance Imaging(MRI), Review
Introduction
Major depressive disorder (MDD) is a highly prevalent psychiatric disorder with a significant effect on quality of life and socioeconomic burden [1]. The diagnosis of MDD often depends on criteria from the Diagnostic and Statistical Manual of Mental Disorders (DSM) and treatment response [2]. Due to the overlapping phenotypes across mental disorders as well as the heterogeneity within disorders such as MDD, clinical diagnoses are often not as well-defined as in research protocols. Consequently, patients with mood disorder sometimes have to endure the wrong drug trial or multiple trials before receiving a final diagnosis [3]. for situations in which the DSM classification is unclear and the subjective clinical impression is confusing, an effective diagnostic tool using, e.g., objective brain imaging measurements, is greatly needed.
Neuroimaging provides non-invasive brain function and structure, and is a powerful tool for investigating discriminative biomarkers. Brain neuroanatomy is intrinsically complex and heterogeneous, which further complicate functional connectivity in patients with mental illnesses. Considering the high- dimensional imaging data quite often includes a limited number of samples, determining an effective and optimal approach to diagnose mood disorder is particularly challenging [4]. Studies discriminating major depressive disorders from healthy control (HC) or other mood disorders have been performed using several neuroimaging techniques, including magnetic resonance imaging (MRI), positron emission tomography(PET), magneto-encephalography(MEG) and electro-encephalography (EEG) [5, 6]. Among which, MRI-related techniques such as functional MRI (fMRI), structural MRI (sMRI) and diffusion MRI (diffusion tensor images, DTI) show benefits of providing multiple perspective on brain function, structure and their connectivity maps. These diverse brain imaging characteristics offer a great opportunity for researchers to unravel the secrets of the complex neuromechanism underlying depression [7–9]. Beyond the group-level analyses which are often performed [10–13], there has been growing interest in using machine learning(ML) techniques to identify phenotypes in a way that is clinically meaningful and feasible for translation into clinical diagnosis or prognosis [14, 15], e.g., (a)to predict response to currently available treatments or (b) to identify more specific targets for novel interventions [16, 17].
In this selective review, we focus on machine-learning-based classification and prediction studies of MDD which utilize features derived from MRI data. First, based on a specific screening method, we selected 63 MRI-based machine learning articles with MDD samples, which are compared on multiple key aspects such as sample size, extracted features, method and reported accuracy. Next, we highlight some representative studies on mood disorder discrimination, e.g., MDD vs. bipolar disorder (BD), and individualized prediction of treatment outcomes for MDD. Next, we surveyed the popular machine learning methods implemented in these studies and presented our opinion on major challenges of those studies from a machine learning point of view. Common biases are discussed and suggestions are provided. Finally, we discussed future directions for potential biomarker identification of MDD disorders. Approaches based on mining big data which focus on classification and treatment strategies are are based on biological information rather than the clinical manifestation have the greatest potential to move the field forward.
Research overview
Screening method
Studies were included if they focused on classification (including treatment prediction) between individuals with MDD and healthy controls (or other brain disorders) by using machine learning methods and employed magnetic resonance imaging as the data acquisition access. Fig. 1(i) shows the screening method diagram called PRISMA (Preferred Reporting Items for Systematic Reviews and Meta-Analyses) [18]. Relevant articles were identified from searches in Pubmed covering publications between January 2000 and December 2017, using the search terms, “depress*”, “MDD”, “MRI”, “fMRI”, “sMRI”, “DTP’, “magnetic resonance imaging”, “neuroimaging”, “classif*”, “diagno*”, “predict*”, “distinguish*”, “discriminat*”, “machine learning”, both in isolation and in combination. 2045 articles were identified by the above search. Then additional articles were identified through the reference lists of these papers to ensure that no studies of significance were omitted from this review, resulting in another 82 articles. After removing duplicates, 1980 articles remained. Furthermore, 1877 were excluded during screening of the title and abstract and a further 40 were excluded during full-text screening. Finally, 63 MDD studies were selected we summarize their main findings below.
Figure 1.

Visual summary of the selected MDD studies. a: Total number of papers before screening. b: Number of publications per group classification. c: Proportion of machine learning methods used. d: Boxplot of accuracy based on 5 methods. e: Proportion of MRI modalities used. f: Accuracy based on modalities. g: Boxplot of sample size based on different cross validation method. h: Scatter plot of overall reported accuracy versus the total sample size. i: Literature search results for each screening steps [18]. j: Summary of steps in MRI machine learning.
Summary of metrics
Fig. 1 indicates several key aspects of our survey. The number of papers published on this topic in each year from 2000-2017 is displayed on Fig 1a. Obviously, the publication number keeps growing and increases sharply in 2017. Fig1b indicates the number of studies fallen within different classification groups, e.g., MDD vs. HC or MDD subtypes. It is clear that MDD vs. HC classification is the largest category, followed by MDD vs. BD. Oredictive studies on MDD treatment outcome occur less frequently than classification studies. Fig. 1c shows the proportion of popular machine learning methods used in these studies. Support vector machines (SVM) remain the most prevalent method choice, but other ML methods have also been applied to MDD, [missing part of this sentence]such as LDA, GPC and DT[all acrynyms should be defined], as well as more recent deep learning models. Fig. 1(d) demonstrates the distribution of reported accuracy for 5 ML methods; SVM performance show a large variability, which may be due to different sample sizes, whereas some uncommon methods show promising performance for specific cases. Furthermore, the proportion of different MRI modalities as well as the reported accuracy of each modality are shown in Fig1(e) and Fig1(f). Most studies still focused on using features of fMRI and sMRI (22 resting-state fMRI; 18 task-related fMRI; 21 sMRI), while some studies have begun to explore the discriminating ability of dMRI (8 dMRI) in spite of applying multimodal MRI features in one study. On the whole, rs-fMRI data exhibit higher accuracy than other modalities. Fig. 1(g) illustrates the distribution of reported sample sizes for each cross- validation(CV) methods including leave-one-out CV, 10-fold cross validation or others, and almost all studies with LOOCV had sample size smaller than 100 while the studies with 10-fold CV had a bigger mean sample size compared with LOOCV. Note that there is one special case which uses LOOCV with the largest sample size in our survey [19], Fig. 1(h) shows the overall accuracy against the total sample size used in studies. Most studies had a smaller sample size and only one had more than 700 [19], which raises a urgent need for including larger sample sizes for the study of MDD in machine learning studies.
Machine learning pipeline
Fig. 1(j) summarizes the most common machine learning pipeline used for MDD diagnosis and prediction using MRI data. After data preprocessing, the pipelines vary greatly but tyipcally include the following steps: feature reduction, model training, classification and performance evaluation.
Feature reduction:
Feature reduction methods are essential to high-dimensional data which is a common problem in neuroimaging [20]. A limited number of the most relevant features warrants a more accurate classification model. These methods can be primarily categorized into feature selection and feature extraction. Feature selection is often performed when supervised methods select the most discriminant features with the help of the labels to reduce the noise in data. Feature extraction occurs when methods project the original high-dimensional data into a lower dimension while maintaining its discriminative ability. One typical example is principle component analysis (PCA). Another strategy is to use prior knowledge to decrease dimensionality. Some proposed approaches [21, 22] provide an intermediate solution by adopting geometric distance in feature space between different groups in the training data [23].
Model training:
In the training phase, for a supervised approach, a model is optimized using labeled data to find a discriminant “decision function” or “hyperplane” distinguishing between different groups (e.g. depression patients and healthy controls) [3, 24]. In this process, the classifiers learn a rule to separate the classes. The parameters of the model are then optimized to maximally discriminate one group from another. Cross validation is usually used to generalize the training process. There are several types of cross validation including k-fold cross validation, leave-one-out cross validation and holdout. For k-fold cross validation, the training data are divided into k equal sized groups. Then each one of k groups is treated as testing data and reiterated for k-iterations, usually repeated k times. The holdout approach (explain what this is) is typically performed on data with a large sample size (k=1), while leave-one-out cross validation is more often used on data with a small sample size (k=sample size) [25, 26]. The latter two techniques can be considered as variants of k-fold cross validation.
Classification:
In the classification phase, the trained model is used to predict the label for new, previously unseen observations. For an unbiased generalization, it is important that the testing data do not overlap with training data [27]. The new data have to be preprocessed in the same way as the training data, and the same feature reduction method is applied with optimized parameters obtained from the training phase. In cases where independent testing data is not available due to limited samples, a second cross validation framework can be conducted to estimate the performance of the model [28–32]. The most commonly used classifier is SVM because of its promising results in neuroimaging [33].
Performance evaluation:
The performance of classification-based algorithms can be described by their accuracy, sensitivity, specificity and receiver operating characteristic (ROC) curve (sensitivity as a function of 1-specificity). The accuracy helps evaluate how accurately the model classifies the test data overall. Sensitivity refers to the proportion of true positives correctly identified (e.g. percentage of true depression patients identified as MDD). In contrast, specificity refers to the proportion of true negatives correctly identified (e.g. percentage of healthy people identified as HC). The ROC curve illustrates the overall performance of the learning method, which is usually summarized by the area under the curve (AUC, a number between 0 and 1). A confusion matrix (CM), which is an n × n matrix for n labels with one side representing actual labels and the other side representing predicted labels, can also be useful when the group of labeled data is more than two [34]. The CM provides information relevant for unbalanced data and for computing other performance measures [35].
Machine learning in MDD
Machine learning consists of representation, optimization and evaluation [91]. It is defined as a group of methods that learn from empirical data to develop training models and make accurate classification from new data. The advantage of machine learning is not confined to diagnosis, but also allows for the prediction of future disease progression. Table 1 summarizes various aspects of 62 selected studies. Most of these works aim at developing computational approaches to discriminate MDD from controls or mood disorder subtypes, or are trying to develop tools to integrate imaging measurements into clinical practice. The most salient advantage of machine learning is its applicability to individual level analysis. There are many different types of algorithms, data preprocessing steps and sample sizes. However, even with these more sophisticated methods and multiple measurement, it is clear that ‘not all depressions are created equal’ and one measurement or treatment approach may not be suitable for everyone; individual depressive patients may represent different proportions of biological, psychological, and situational factors. Therefore, early imaging and molecular studies have shown promise to optimize treatment strategy by offering additional factors beyond traditional clinical and physiological markers alone.
Table 1.
Review of classification studies related to major depressive disorders
| Classification: | |||||
|---|---|---|---|---|---|
| References | Subjects | Feature | Method | Cross validation | Accuracy |
| Rubin-Falcone et at. (2017)[36] | BD=26, MDD=26 | GM (sMRI) | SVM | leave-two-out CV | 75% |
| Deng et al. (2017)[37] | BD=31, MDD=36 | FA (DTI) | SVM | LOOCV | 68.33% |
| Gao et al. (2017)[3] | BD=37, MDD=36 | Spatial components (rsfMRI) | SVM | 10-fold CV | 93% |
| Jing et al. (2017)[38] | cMDD=19, rMDD=19, HC=19 | Hurst exponent (rsfMRI) | SVM | LOOCV | 87% (cMDD vs. HC), 84% (rMDD vs. HC), 89% (cMDD vs.rMDD) |
| Yoshida et al. (2017)[39] | MDD=58, HC=65 | FC (rsfMRI) | PLS | LOOCV | 80% |
| Li et al. (2017)[40] | BD=22, MDD=22 | Degree centrality (rsfMRI) | SVM | LOOCV | 86% |
| Zhong et al. (2017)[41] | MDD=29, HC=33 (1st sample); MDD=46, HC=57 (2nd sample) | FC (rsfMRI) | SVM | LOOCV | 91.9% (1st sample), 86.4% (2nd sample) |
| Wang et al. (2017)[42] | MDD=31, HC=29 | FC (rsfMRI) | SVM | LOOCV | 95% |
| Schnyer et al. (2017)[43] | MDD=25, HC=25 | FA (DTI) | SVM | LOOCV | 74% |
| Sundermann et al. (2017)[44] | MDD=180, HC=180 | FC (rsfMRI) | SVM | 10-fold CV | 45.0%~56.1% |
| Bhaumik et al. (2017)[45] | MDD=38, HC=29 | FC (rsfMRI) | SVM | LOOCV | 76.10% |
| He et al. (2017)[46] | BD=13, MDD=40, HC=33 | Functional network connectivity (rsfMRI)/GM(sMRI) | SVM | 10-fold CV | 91.3% (3 groups), 99.0% (BD vs. MDD) |
| Hilbert et al. (2016)[47] | GAD=19, MDD=14, HC=24 | GM (sMRI) | SVM | LOOCV | 58.71% (GAD&MDD vs. HC), 68.05% (GAD vs. MDD) |
| Drysdale et al. (2016)[19] | MDD=333(4 biotypes) HC=378 | FC (rsfMRI) | SVM | LOOCV | 89.20% |
| Sankar et al. (2016)[48] | MDD=23, HC=20 | GM, WM (sMRI) | SVM | 5-fold CV | 70% |
| Frangou et al. (2016)[49] | BD=30, MDD=30 | Contrast maps (task fMRI) | GPC | leave-two-out CV | 73.10% |
| Ramasubbu et al. (2016)[50] | MDD=15, HC=19 | Spatial independent components (rsfMRI) | SVM | 5-fold CV | 66% |
| Yang et al. (2016)[51] | MDD=16, HC=16 | Contrast maps (task fMRI) | SVM | LOOCV | 75% |
| Jie et al. (2015)[24] | BD=21, MDD=25 | GM (sMRI), fALFF (rsfMRI) | SVM | LOOCV | 92.10% |
| Foland-Ross et al. (2015)[52] | MDD=18, HC=15 | CTH (sMRI) | SVM | 10-fold CV | 69.70% |
| Sacchet et al. (2015)[53] | BD=40, MDD=57, HC=61 | GM (sMRI) | SVM | 10-fold CV | 59.5% (BD vs. MDD), 62.8% (MDD vs. HC) |
| Sacchet et al. (2015)[54] | MDD=14, HC=18 | Graph metric of WM connectivity (DTI) | SVM | LOOCV | 71.9% |
| Sato et al. (2015)[55] | MDD=25, HC=21 | Contrast maps (task fMRI) | LDA | LOOCV | 78.30% |
| Johnston et al. (2015)[56] | MDD=20, HC=21 | GM (sMRI) | SVM | LOOCV | 85% |
| Johnston et al. (2015)[57] | MDD=19, HC=21 | Contrast maps (task fMRI) | SVM | LOOCV | 97% (hippocampus), 84% (striatum) |
| Koutsouleris et al. (2015)[58] | MDD=104, SZ=158 | GM (sMRI) | SVM | 10-fold CV | 76% |
| Shimizu et al. (2015)[59] | MDD=31, HC=31 | Contrast maps (task fMRI) | gLASSO, SVM | 10-fold CV | 92% (gLASSO), 95% (SVM) |
| Fung et al. (2015)[60] | BD=16, MDD=19 | CTH and surface area (sMRI) | SVM | LOOCV | 74.30% |
| Rosa et al. (2015)[61] | MDD=19, HC=19 | FC (task fMRI) | SVM | LOOCV | 85% |
| Patel et al. (2015)[15] | MDD=33, HC=35 | rsfMRI, sMRI, DTI | DT | LOOCV | 87.30% |
| Redlich et al. (2014)[62] | BD=58, MDD=58 | GM (sMRI) | GPC | LOOCV | 79.30% |
| Cao et al. (2014)[63] | MDD=39, HC=37 | FC (rsfMRI) | SVM | LOOCV | 84% |
| MacMaster et al. (2014)[64] | BD=14, MDD=32 | GM (sMRI) | LDA | N/A | 81% |
| Zeng et al. (2014)[65] | MDD=24, HC=29 | FC (rsfMRI) | MMC | LOOCV | 92.5% (clustering), 92.5% (classification) |
| Rondina et al. (2014)[66] | MDD=30, HC=30 | Voxel intensity (task fMRI) | SVM | leave-two-out CV | 72% |
| Guo et al. (2014)[67] | MDD=36, HC=27 | FC (rsfMRI) | NN | hold out | 90.50% |
| Serpa et al. (2014)[68] | BD=23, MDD=19, HC=38 | GM, WM, and ventricular RAVENS maps (sMRI) | SVM | LOOCV | 54.8% (BD vs. MDD), 59.6% (MDD vs. HC) |
| Habes et al. (2013)[69] | MDD=9, HC=9 | Contrast maps (task fMRI) | LDA | LOOCV | 72.20% |
| Wei et al. (2013)[70] | MDD=20, HC=20 | Spatial independent components (rsfMRI) | SVM | LOOCV | 90% |
| Grotegerd er al. (2013)[71] | BD=22, MDD=22 | Contrast maps (task fMRI) | GPC | LOOCV | 79.60% |
| Yu et al. (2013)[72] | MDD=19, SZ=32 | FC (rsfMRI) | SVM | LOOCV | 80.90% |
| Modinos et al. (2013)[73] | MDD=17, HC=17 | Contrast maps (task fMRI) | SVM | LOOCV | 77% |
| Ma et al. (2013)[74] | MDD=19, HC=18 | ReHo (rsfMRI) | LDA | LOOCV | 91.90% |
| Fang et al. (2012)[75] | MDD=22, HC=26 | Anatomical connectivity (DTI) | SVM | LOOCV | 91.70% |
| Mwangi et al. (2012)[76] | MDD=30, HC=32 | GM (sMRI) | RVM | hold out | 90.30% |
| Lord et al. (2012)[77] | MDD=22, HC=22 | FC (rsfMRI) | SVM | hold out | 99% |
| Liu et al. (2012)[78] | TRD=18, TSD=17, HC=17 | GM, WM (sMRI) | SVM | LOOCV | 82.90% |
| Zeng et al. (2012)[75] | MDD=24, HC=29 | FC (rsfMRI) | SVM | LOOCV | 94.3% |
| Mourão-Miranda et al. (2011)[79] | MDD=19, HC=19 | Contrast maps (task fMRI) | SVM | LOOCV | 52% (tine positive) |
| Hahn et al (2011)[80] | MDD=30, HC=30 | Contrast maps (task fMRI) | GPC | LOOCV | 83% |
| Nouretdinov et al. (2011)[81] | MDD=19, HC=19 | Contrast maps (task fMRI) | SVM | LOOCV | 76.30% |
| Costafreda et al. (2009)[82] | MDD=37, HC=37 | GM (sMRI) | SVM | LOOCV | 67.60% |
| Fu et al. (2008)[83] | MDD=19, HC=19 | Contrast maps (task fMRI) | SVM | LOOCV | 86% |
| Prediction: | |||||
| References | Subjects | Feature | Method | Cross validation | Accuracy |
| Jiang et al. (2017)[16] | rMDD=27, non-rMDD=11 | GM (sMRI) | LR | LOOCV | 89% |
| Redlich et al. (2016)[17] | MDD responder=13, non-responder= 10 | GM (sMRI) | SVM | LOOCV | 78.30% |
| Lythe et al. (2015)[84] | rMDD=31, non-rMDD=25 | FC (task fMRI) | LDA | LOOCV | 75% |
| Korgaonkar et al. (2015)[85] | rMDD=54, non-rMDD=103 | Volume (sMRI), FA (DTI) | DT | hold out | 85% (sMRI), 84%(DTI) |
| Williams et al. (2015)[86] | MDD responder=48, non-responder=32 | Contrast maps (task fMRI) | LDA | LOOCV | 75% (happy), 81% (sad) |
| Schmaal et al.(2015)[87] | rMDD=23, non-rMDD=59 | Contrast maps (task fMRI) | GPC | LOOCV | 73% |
| van Waarde et al. (2014)[88] | rMDD=25, non-rMDD=20 | (rsfMRI) Spatial components | SVM | LOOCV | 84% (sensitivity), 85% (specificity) |
| Korgaonkar et al. (2014)[89] | rMDD=37, non-rMDD=43 | FA (DTI) | LDA | k-fold CV | 62% |
| Gong et al.(2011)[90] | rMDD=23, non-rMDD=23 | GM, WM (sMRI) | SVM | LOOCV | 69.6% (GM), 65.2%(WM) |
| Costafreda et al. (2009)[82] | rMDD=9, non-rMDD=7 | Contrast maps (task fMRI) | SVM | LOOCV | 71% (sensitivity), 86% (specificity) |
Abbreviation: BD, bipolar disorder; MDD, major depressive disorder; cMDD, current MDD; rMDD, remitted MDD; GAD, generalized anxiety disorder; SZ, schizophrenia; TRD, treatment-resistant depression; TSD, treatment-sensitive depression; GM, gray matter; MRI, magnetic resonance imaging; DTI, diffusion tensor images: FC, functional connectivity; WM, white matter; fALFF, fractional amplitude of low-frequency fluctuation; CTH, cortical thickness; ReHo, regional homogeneity; GPC, gaussian process classifier; LDA, linear discriminant analysis; gLASSO, group least absolute shrinkage and selection operator; CV, cross validation; LOOCV, leave-one-out cross validation; FA, fractional anisotropy; RAVENS, regional analysis of volumes examined in normalized space; LR, linear regression; PLS, partial least squares regression; DT, decision tree; MMC, maximum margin clustering; NN, neural network; RVM, relevance vector machine
Highlighted Research
Classification with brain networks in MDD
A number of studies use graph theory approaches [39, 41, 42, 75] to highlight the disrupted functional and structural brain networks in depression. These connectome-based biomarkers also provide new opportunities to redefine the diagnosis of depression and improve treatment measures by providing important knowledge about the biological mechanisms. Here, we summarize some of the key findings related to structural and functional brain networks in depression. In [92], a review enumerated various brain network features, including altered regional and connectivity patterns of various MRI modalities in depression: ROI-based and voxel-based analysis (fMRI), regional between ness and degree centralities (sMRI), and white matter structural connectivity (DTI). [75] investigated the whole-brain resting-state functional connectivity patterns of depressed patients to identify major depressive individuals from healthy controls and achieved [100% sensitivity...do you believe this? Sounds like overfitting to me]. The most discriminating functional connections were located within or across the default mode network, affective network, visual cortical areas and cerebellum, which may play important roles in the pathological mechanism of this disorder.
Prediction of treatment response in MOD
Altered network activity at rest has been explored as a potential biomarker for predicting treatment outcomes. As shown in [19] four distinct MDD neurophysiological biotypes, characterized by distinct patterns of limbic and frontostriatal functional connectivity, were defined using fMRI. These biotypes were associated with distinct profiles of clinical symptoms; for example, biotype 1, which responded best to repetitive transcranial magnetic stimulation (rTMS) therapy, was associated with high levels of fatigue and low anhedonia. Similarly, Electroconvulsive therapy (ECT) is a popular treatment for depression patients. Several studies have explore biomarkers that potentially predict the response to ECT. One of the studies investigated whether GMV changes are able to predict ECT response. Support vector regression was performed before treatment and supplemented with univariate analysis of the Hamilton Depression Rating Scale score (HDRS), yielding a successful prediction of ECT response and a significant prediction of relative reduction in the HDRS [17]. Another study predicted post-ECT (electroconvulsive therapy) depressive remission status using pre-ECT gray matter (GM) in MDD patients and validated in two independent data sets. Six GM networks were identified as predictors of ECT response, achieving accuracy of 89, 90 and 86% for remission prediction in three independent data sets [16].
Common Machine Learning Challenges in MDD Study
Machine learning methods are increasingly being applied to real world problems, not only in medical research but also in robot vision, bioinformatics, natural language processing, finance, scenario recognition and signal processing. Studies involving a combination of MRI and pattern recognition techniques to explore biomarkers of depression have grown substantially in recent years. Such methods can accurately discriminate depressed subjects from healthy controls [39, 41–45, 80, 81, 83] and predict treatment response [16, 17, 82, 84]. In our survey, there are more studies focused on classification (53 studies) than treatment response prediction (10 studies). To the best of our knowledge, the number of articles that use machine learning methods for classifying depression are limited [93], and many of these methods have not been integrated into a clinical application. We believe the main reason is due to the heterogeneity of imaging data including data collection, scanning parameters, and processing methods which hampers generalization to other datasets. This makes it difficult to draw comparisons simply based on the results. In the following we summarize these past studies.
Small sample size
The small sample size is a universal problem faced by most studies of depression, and it is hence not possible to draw definite conclusions about the diagnostic value of neuroimaging at the individual level. Given the difficulty of recruiting patients, the limitation of a small sample size is quite understandable. This problem is naturally difficult and common in machine learning methodologies, but the sample size is still miniscule in comparison with other fields in which machine learning is used leading to several problems. There are a growing number of repositories which address the broader issue of small sample sizes within neuroimaging research [19], but these typically lack uniformity between contributing sites with respect to acquisition and processing parameters which may introduce bias to the aggregated data. As long as there is no common standard between different sites, performing machine learning methods is limited to the available sample sizes.
Feature reduction
Given the small sample sizes used by the past studies, a proper feature reduction method can be used to improve overall performance. Supervised feature extraction methods can easily overfit, so more a effective approach based on previous knowledge may generalize well over unseen data. Other studies have used unsupervised data-driven feature extraction methods such as PCA or ICA. Features used by past studies vary considerably by MRI modality, feature reduction method, and number and type of features. Despite this, various features in past studies seem to be useful in major depression, e.g. reduced activation in dorsolateral prefrontal areas [3, 15, 39, 42, 44, 46, 75] and decreased gray matter volume in prefrontal cortex and subcortical systems [53, 56, 58, 62, 76, 90]. Group differences conducted on whole dataset were applied to select features in some studies [46], though this may introduce bias into the feature selection step [94, 95]. The is not a direct relationship between statistical analysis and discrimination power as they are different criteria [M. R. Arbabshirani, S. Plis, J. Sui, and V. D. Calhoun, “Single subject prediction of brain disorders in neuroimaging: Promises and pitfalls,” Neuroimage, vol. 145, no. Pt B, pp. 137, 2017. As such, valuable discriminatory information could be lost by discarding features based on group differences [96–98]. Better approaches include recursive feature elimination (RFE) [24] minimum-redundancy maximum relevancy (mRMR) [99], and methods that learn the features contributing most to the accuracy of the model including LASSO, elastic net and ridge regression [16, 59].
Overfitting
Overfitting results in very good performance on training data, very poor performance on testing data and poor generalization to independent data sets [100], which may be caused by small sample size with high dimensional features [29, 101] and complex models with many parameters. Neuroimaging applications in MDD often have limited number of samples with large feature size, so many of the studies suffered from an overfitting problem. Cross validation is a common method to control for overfitting. As mentioned earlier, the proper type of cross validation should be selected based on the data scale, as shown in figure 1g.
Classification methods and cross validation
Almost all of the past studies have used support vector machines or a variant method as primary classification method [19, 36–38, 40–48, 75, 77–79, 81–83, 90] and leave-one-out cross-validation. SVM is popular among depression studies because of its useful strengths including a reliable theoretical foundation and flexible response to high dimensional data. Most neuroimaging studies are likely non-linear and kernel SVM has been proposed to achieve better performance than the other methods for non-linear depression classification [59]. Nevertheless, if the number of samples is significantly less than the number of features, it may be better to simply use linear learning method to avoid complexity and mitigate against overfitting [102, 103]. The leave-one-out cross validation method provides more data to the training stage of learning method, which is associated with high variance weakening generalization performance and can lead to overfitting [104, 105]. According to our recent work, 10-fold cross validation provide a stable performance across different data while leave-one-out cross validation performance heavily depends on the data we use [3].
Future directions
Based on the discussion in the previous section of past studies, there are several potential directions to explore for future studies.
Selection of machine learning methods
The selection of appropriate learning methods is very important to accurately learn a classification framework or problem. Since no one learning method is the best for all applications, it may be useful to test multiple methods, including robustness, complexity, computation time and requirement for priori knowledge. Some researchers have successfully realized this selection of methods [106–108]. Suboptimal conditions in terms of data acquisition may also lead to robustness reduction in classification methods and more studies should focus on this problem.
Multimodal MRI in MDD
Although fMRI and sMRI biomarkers have been found to be associated with depression, there are additional studies that have shown the relevance of DTI[maybe use dMRI throughout as a more general term] biomarkers [37, 43, 54, 85]. Additionally, non-imaging measures have also been used in depression [109]. Thus it is important to study how multi-modal MRI in conjunction with non-imaging features affect prediction models of depression [24, 46]. Each MRI modality represents different view of the brain, and data fusion capitalizes on the strengths of each modality and their inter relationships in a joint analysis to unravel the pathophysiology of brain disease [109–111]. Recent advances in data fusion [112–114] increase our confidence in multimodal approaches and also provide insight into both anatomical and functional information [115–117]. Often multimodal studies reveal information which may be missed by methods based on a single modality [118]. Some studies have already applied advanced multimodal fusion methods like mCCA+jICA[define] [111] and its variants [109] in MDD associated analysis with promising classification performance [46]. In [24], jointly selected features from ALFF (define) and GM trained by the SVM classifier enable classifying MDD and BD at high accuracy based on the identified features (e.g., dorsal lateral prefrontal cortex in GM). Data fusion methods combined with machine learning is thus a promising direction for depression classification
Multiple classification and subtypes
Multiple classification can be performed via a pseudo multi-class strategy by applying a two-class algorithm either to separate pairs of depression subtypes or to separate different subtype from one other. An alternative approach for this problem is to apply clustering methods to label subjects as belonging to specific disease subtype clusters [19]. Although abnormalities of major neuroanatomical regions and neural networks are common in one generalized category of disorders, prominently disturbed symptoms differ between subtypes, which have already been found in MDD [119] and BD [120, 121]. Differentiating a disorder sharing symptoms with other disorders is also one of the main challenges in psychiatry and neurology. It has been reported that such overlapping disorders include schizophrenia, bipolar, unipolar and mood disorders. Classification with task-based fMRI has achieved good performance in distinguishing schizophrenia and bipolar disorder [122–124]. Other studies also classify schizophrenia, bipolar and healthy controls with high accuracy using sMRI [53, 58, 125, 126]. So, multiple classification in depression is thought to be very promising but also challenging [19].
Clinical information integration and potential prediction benefits
Though brain imaging is an important factor, neuroimaging can only provide part of the information, which should be supplemented with clinical information like severity of depression, age at onset, personality traits, early life experience, environmental factors, alcohol and smoking conditions, and general medical conditions. How to integrate all the above variables is an ongoing challenge. Furthermore, when an effective method has been validated through preliminary studies, progressing to clinical trials will be necessary to test whether this method will actually benefit patients. For the 50% of patients experiencing treatment response to first agents undergoing an antidepressant trial requiring several weeks before final diagnosis, machine-learning methods have the potential to significantly reduce the duration of depression patients suffering. Outside the scope of depression, machine learning have shown good performance in predicting treatment response for other disorders [110, 114].
Data heterogeneity: large sample size and modal parameter selection
Problems with data heterogeneity may be reduced through large training data sets and optimal parameter selection [29, 101]. Standardized data sharing has started for fMRI and sMRI to increase sample sizes. Outlier detection approaches can be applied too, treating patient classification as an outlier detection problem [79]. So far most of depression prediction studies use a relatively small sample size. A larger sample size is valuable for developing a more robust prediction model with good generalization to wider population with good statistical power. The variability among depression patients can be more thoroughly characterized by building a larger database. K-fold cross-validation method can replace leave-one-out to allow for larger test sets and improve the generalizability of the models. Computation on large-scale datasets is needed to leverage larger data sets. However, analysis can be computationally demanding. Decentralized approaches can help address this issue [[1] S. M. Plis, A. D. Sarwate, D. Wood, C. Dieringer, D. Landis, C. Reed, S. R. Panta, J. A. Turner, J. M. Shoemaker, K. W. Carter, P. Thompson, K. Hutchison, and V. D. Calhoun, “COINSTAC: A Privacy Enabled Model and Prototype for Leveraging and Processing Decentralized Brain Imaging Data,” Front Neurosci, vol. 10, p. 365, Aug 19 2016, PMC4990563.
[2] J. Ming, E. Verner, A. Sarwate, R. Kelly, C. Reed, T. Kahleck, R. Silva, S. Panta, J. Turner, S. Plis, and V. Calhoun, “COINSTAC: Decentralizing the future of brain imaging analysis,” F1000Res, vol. 6, p. 1512, 2017, PMC5657031. as can as the increasing availability of cloud based computing. A few studies [61, 76, 79] utilize parameter selection to optimize their results. Selection of the key parameters is important and can be accomplished via nested cross validation [3]. In this approach, the inner loop of a nested cross validation is used to select the parameters, while the outer one is used to evaluate the overall generalization-based performance of a learning method. The parameter value resulting in the most precise model of inner cross validation is selected as the optimal parameter value and then used to train the full data set [3, 16]. For multiple parameter selection, one can optimize across all possible combinations using a grid search technique [23].
Conclusions
The widespread availability of machine learning methods combined with MRI data affords unprecedented opportunities to further deepen individual level analysis of major depression and accelerate translation to clinical application. Approaches for combining machine learning methods and MRI data are still largely at the exploratory stage. Classification models and features extracted from multiple modalities are irregular across different studies and this heterogeneity makes it harder to unearth optimal MRI modalities, features and algorithm. The trend of combining machine learning and MRI in depression is drawing more attention due to the high potential and because it also provides information about the underlying brain regions which are involved. There are many challenges, but there is great potential for approaches which leverage multimodal fusion, brain connectomics, big sample size from different centers, subtype classification, and combination with clinical and genetic information.
Figure 2.

Brain network studies in MDD classification. a[92]: Brain network construction with MRI and connectome architecture represented by a connectivity matrix. b[75]: Region weights and distribution of 442 consensus functional connections identified by classification of MDD and HC demonstrated in sagittal and axial view (left) and in a circle graph (middle). Top 100 most discriminating consensus functional connections in sagittal and axial view (right). [a reproduced from [92]; b reproduced from [75]]
Figure 3.
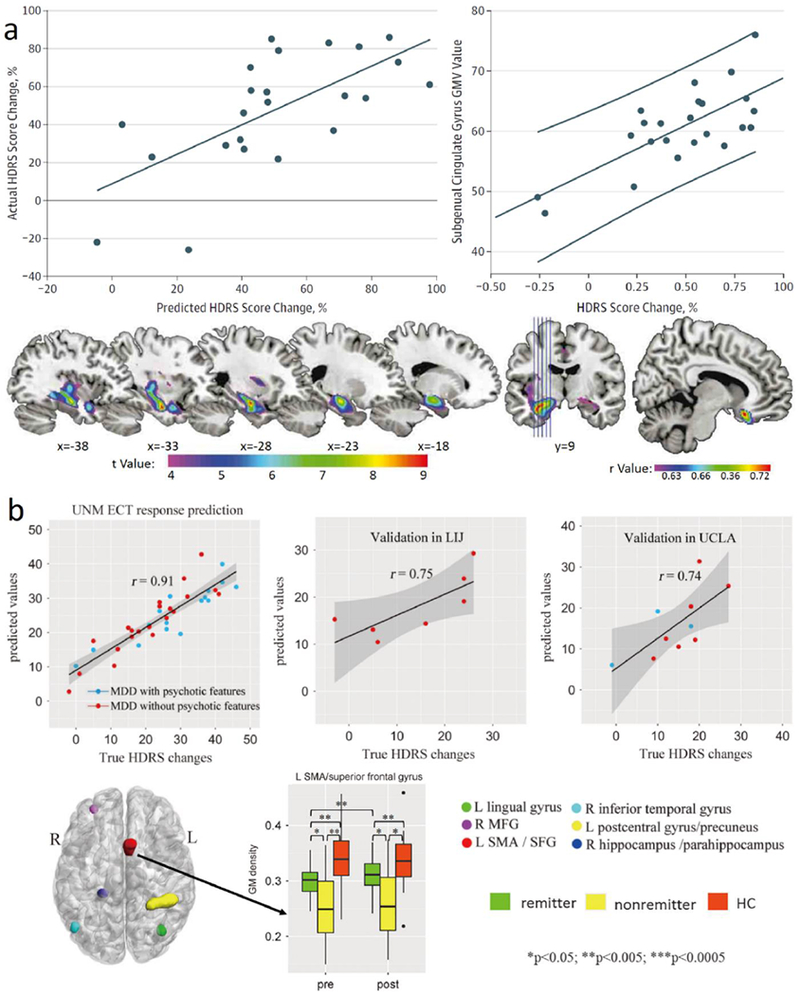
Predication studies in MDD. a[17]: Positive association between predicted and true change in the Hamilton Depression Rating Scale (HDRS) score. Positive association between change in HDRS score and subgenual anterior cingulate volume before electroconvulsive therapy (ECT). Gray Matter Volume (GMV) increasing in the ECT group. Spatial map of correlated anterior cingulate volume. b[16]: Scatter plot of the predicted ΔHDRS (Hamilton Depression Rating Scale) with respect to their true values for three sites, extracting 6 identified pre-electroconvulsive therapy (ECT) gray matter (GM) regions in University of New Mexico (UNM) and using them as regressors for two independent cohorts: Long Island Jewish Health System (LIJ) and University of California at Los Angeles (UCLA). 6 identified pre-electroconvulsive therapy (ECT) GM regions of interest (ROIs) as predictors of ΔHDRS in axial view. Longitudinal GM changes among remitters, non-remitters, and healthy controls of left supplementary motor area (SMA) and superior frontal gyrus (SFG).
Acknowledgements
This work was supported by the National High-Tech Development Plan (863, No. 2015AA020513), “100 Talents Plan” of Chinese Academy of Sciences, the Chinese National Science Foundation Number 81471367, 61773380, the Strategic Priority Research Program of the Chinese Academy of Sciences (No.XDB02060005) and NM Grant R01EB005846, 1R01MH094524 and P20GM103472.
Footnotes
The authors report no biomedical financial interests or potential conflicts of interest.
References
- [1].Murray CJ, Vos T, Lozano R, Naghavi M, Flaxman AD, Michaud C, Ezzati M, Shibuya K, Salomon JA, and Abdalla S, “Disability-adjusted life years (DALYs) for 291 diseases and injuries in 21 regions, 1990-2010: a systematic analysis for the Global Burden of Disease Study 2010,” Lancet, vol. 380, no. 9859, pp. 2197–223,2012. [DOI] [PubMed] [Google Scholar]
- [2].Papakostas GI, “Managing partial response or nonresponse: switching, augmentation, and combination strategies for major depressive disorder,” Journal of Clinical Psychiatry, vol. 70, no. 6, pp. 16–25, 2009. [DOI] [PubMed] [Google Scholar]
- [3].Gao S, Osuch EA, Wammes M, Théberge J, Jiang TZ, Calhoun VD, and Sui J, “Discriminating bipolar disorder from major depression based on kernel SVM using functional independent components,” in 2017 IEEE 27th International Workshop on Machine Learning for Signal Processing (MLSP), 2017, pp. 1 −6. [Google Scholar]
- [4].Bromet E, Andrade LH, Hwang I, Sampson NA, Alonso J, De GG, De GR, Demyttenaere K, Hu C, and Iwata N, “Cross-national epidemiology of DSM-IV major depressive episode,” Bmc Medicine, vol. 9, no. 1, pp. 90, 2011. [DOI] [PMC free article] [PubMed] [Google Scholar]
- [5].Laje G, Paddock S, Manji H, Rush AJ, Wilson AF, Chamey D, and Mcmahon FJ, “Genetic markers of suicidal ideation emerging during citalopram treatment of major depression,” American Journal of Psychiatry, vol. 164, no. 10, pp. 1530–8, 2007. [DOI] [PubMed] [Google Scholar]
- [6].Miller AH, Maletic V, and Raison CL, “Inflammation and its discontents: the role of cytokines in the pathophysiology of major depression,” Biological Psychiatry, vol. 65, no. 9, pp. 732–41, 2009. [DOI] [PMC free article] [PubMed] [Google Scholar]
- [7].Herrmann LL, Le ΜM, and Ebmeier KP, “White matter hyperintensities in late life depression: a systematic review. Journal of Neurology Neurosurgery & Psychiatry, vol. 79, no. 6, pp. 619, 2008. [DOI] [PubMed] [Google Scholar]
- [8].Le BD, Mangin JF, Poupon C, Clark CA, Pappata S, Molko N, and Chabriat H, “Diffusion tensor imaging: Concepts and applications,” Journal of Magnetic Resonance Imaging, vol. 13, no. 4, pp. 534, 2001. [DOI] [PubMed] [Google Scholar]
- [9].Raemaekers M, Vink M, Zandbelt B, Wezel RJAV, Kahn RS, and Ramsey NF, “Test–retest reliability of fMRI activation during prosaccades and antisaccades,” Neuroimage, vol. 36, no. 3, pp. 532, 2007. [DOI] [PubMed] [Google Scholar]
- [10].De KB, Ruhe E, Caan M, Rive M, Olabarriaga S, Groefsema M, Heesink L, Van WG, and Denys D, “Relation between structural and functional connectivity in major depressive disorder,” Biological Psychiatry, vol. 74, no. 1, pp. 40, 2013. [DOI] [PubMed] [Google Scholar]
- [11].Khalaf A, Edelman K, Tudorascu D, Andreescu C, Reynolds CF, and Aizenstein H, “White Matter Hyperintensity Accumulation During Treatment of Late-Life Depression,” Neuropsychopharmacology Official Publication of the American College of Neuropsychopharmacology, vol. 40, no. 13, pp. 3027, 2015. [DOI] [PMC free article] [PubMed] [Google Scholar]
- [12].Steffens DC, Taylor WD, Denny KL, Bergman SR, and Wang L, “Structural integrity of the uncinate fasciculus and resting state functional connectivity of the ventral prefrontal cortex in late life depression,” Plos One, vol. 6, no. 7, pp. e22697, 2011. [DOI] [PMC free article] [PubMed] [Google Scholar]
- [13].Orrù G, Pettersson-Yeo W, Marquand AF, Sartori G, and Mechelli A, “Using Support Vector Machine to identify imaging biomarkers of neurological and psychiatric disease: A critical review,” Neuroscience & Biobehavioral Reviews, vol. 36, no. 4, pp. 1140–1152, 2012/04/01/, 2012. [DOI] [PubMed] [Google Scholar]
- [14].Haslam N, and Beck AT, “Categorization of major depression in an outpatient sample,” Journal of Nervous & Mental Disease, vol. 181, no. 12, pp. 725–31, 1993. [DOI] [PubMed] [Google Scholar]
- [15].Patel MJ, Andreescu C, Price JC, Edelman KL, Iii CFR, and Aizenstein HJ, “Machine Learning Approaches for Integrating Clinical and Imaging Features in LLD Classification and Response Prediction,” International Journal of Geriatric Psychiatry, vol. 30, no. 10, pp. 1056, 2015. [DOI] [PMC free article] [PubMed] [Google Scholar]
- [16].Jiang R, Abbott CC, Jiang T, Du Y, Espinoza R, Narr KL, Wade B, Yu Q, Song M, Lin D, Chen J, Jones T, Argyelan M, Petrides G, Sui J, and Calhoun VD, “SMRI Biomarkers Predict Electroconvulsive Treatment Outcomes: Accuracy with Independent Data Sets,” Neuropsychopharmacology, 07/31/online, 2017. [DOI] [PMC free article] [PubMed] [Google Scholar]
- [17].Redlich R, Opel N, Grotegerd D, Dohm K, Zaremba D, Bürger C, Münker S, Mühlmann L, Wahl P, and Heindel W, “Prediction of Individual Response to Electroconvulsive Therapy via Machine Learning on Structural Magnetic Resonance Imaging Data,” Jama Psychiatry, vol. 73, no. 6, pp. 557, 2016. [DOI] [PubMed] [Google Scholar]
- [18].Moher D, Liberati A, Tetzlaff J, Altman DG, and The PG, “Preferred Reporting Items for Systematic Reviews and Meta-Analyses: The PRISMA Statement,” PLOS Medicine, vol. 6, no. 7, pp. e1000097, 2009. [DOI] [PMC free article] [PubMed] [Google Scholar]
- [19].Drysdale AT, Grosenick L, Downar J, Dunlop K, Mansouri F, Meng Y, Fetcho RN, Zebley B, Oathes DJ, and Etkin A, “Resting-state connectivity biomarkers define neurophysiological subtypes of depression,” Nature Medicine, vol. 23, no. 1, pp. 28, 2017. [DOI] [PMC free article] [PubMed] [Google Scholar]
- [20].Saeys Y, Inza I, and Larrañaga P, “A review of feature selection techniques in bioinformatics,” Bioinformatics, vol. 23, no. 19, pp. 2507, 2007. [DOI] [PubMed] [Google Scholar]
- [21].Navot A, Shpigelman L, Tishby N, and Vaadia E, “Nearest Neighbor Based Feature Selection for Regression and its Application to Neural Activity,” Advances in Neural Information Processing Systems, vol. 18, pp. 995–1002, 2005. [Google Scholar]
- [22].Gilad-Bachrach R, Navot A, and Tishby N, “Margin based feature selection - theory and algorithms,” in Proceedings of the twenty-first international conference on Machine learning, Banff, Alberta, Canada, 2004, pp. 43. [Google Scholar]
- [23].Fan Y, Liu Y, Wu H, Hao Y, Liu H, Liu Z, and Jiang T, “Discriminant analysis of functional connectivity patterns on Grassmann manifold,” Neuroimage, vol. 56, no. 4, pp. 2058–2067, 2011. [DOI] [PubMed] [Google Scholar]
- [24].Jie NF, Zhu MH, Ma XY, Osuch EA, Wammes M, Theberge J, Li HD, Zhang Y, Jiang TZ, and Sui J, “Discriminating Bipolar Disorder From Major Depression Based on SVM-FoBa: Efficient Feature Selection With Multimodal Brain Imaging Data,” IEEE Transactions on Autonomous Mental Development, vol. 7, no. 4, pp. 320–331,2015. [DOI] [PMC free article] [PubMed] [Google Scholar]
- [25].Kohavi R, “A study of cross-validation and bootstrap for accuracy estimation and model selection.” pp. 1137–1143.
- [26].Patel MJ, Khalaf A, and Aizenstein HJ, “Studying depression using imaging and machine learning methods,” Neuroimage: Clinical, vol. 10, pp. 115–123, 2016/01/01/, 2016. [DOI] [PMC free article] [PubMed] [Google Scholar]
- [27].Lemm S, Blankertz B, Dickhaus T, and Müller KR, “Introduction to machine learning for brain imaging,” Neuroimage, vol. 56, no. 2, pp. 387, 2011. [DOI] [PubMed] [Google Scholar]
- [28].Sato JR, Fujita A, Thomaz CE, Momao-Miranda J, Brammer MJ, and Junior EA, “Evaluating SVM and XMLDA in the extraction of discriminant regions for mental state prediction,” Neuroimage, vol. 46, no. 1, pp. 105–114, 2009. [DOI] [PubMed] [Google Scholar]
- [29].Franke K, Ziegler G, Klöppel S, and Gaser C, “Estimating the age of healthy subjects from T 1 -weighted MRI scans using kernel methods: Exploring the influence of various parameters,” Neuroimage, vol. 50, no. 3, pp. 883, 2010. [DOI] [PubMed] [Google Scholar]
- [30].Chen R, and Herskovits EH, “Machine-learning techniques for building a diagnostic model for very mild dementia,” Neuroimage, vol. 52, no. 1, pp. 234–244, 2010. [DOI] [PMC free article] [PubMed] [Google Scholar]
- [31].Plant C, Teipel SJ, Oswald A, Bohm C, Meindl T, Mouraomiranda J, Bokde AW, Hampel H, and Ewers M, “Automated detection of brain atrophy patterns based on MRI for the prediction of Alzheimer’s disease,” Neuroimage, vol. 50, no. 1, pp. 162–174, 2010. [DOI] [PMC free article] [PubMed] [Google Scholar]
- [32].Cuingnet R, Gerardin E, Tessieras J, Auzias G, Lehéricy S, Habert MO, Chupin M, Benali H, and Colliot O, “Automatic classification of patients with Alzheimer’s disease from structural MRI: a comparison of ten methods using the ADNI database,” Neuroimage, vol. 56, no. 2, pp. 766, 2011. [DOI] [PubMed] [Google Scholar]
- [33].Cortes C, and Vapnik V, “Support-vector networks,” Machine Learning, vol. 20, no. 3, pp. 273–297, 1995. [Google Scholar]
- [34].Baldi P, Brunak S, Chauvin Y, Andersen CAF, and Nielsen H, “Assessing the accuracy of prediction algorithms for classification: an overview,” Bioinformatics, vol. 16, no. 5, pp. 412, 2000. [DOI] [PubMed] [Google Scholar]
- [35].Alberg AJ, Park JW, Hager BW, Brock MV, and Diener-West M, “The use of “overall accuracy” to evaluate the validity of screening or diagnostic tests,” Journal of General Internal Medicine, vol. 19, no. 5pl, pp. 460–465, 2010. [DOI] [PMC free article] [PubMed] [Google Scholar]
- [36].Rubin-Falcone H, Zanderigo F, Thapa-Chhetry B, Lan M, Miller JM, Sublette ΜE, Oquendo MA, Hellerstein DJ, McGrath PJ, Stewart JW, and Mann JJ, “Pattern recognition of magnetic resonance imaging-based gray matter volume measurements classifies bipolar disorder and major depressive disorder,” Journal of Affective Disorders, vol. 227, no. Supplement C, pp. 498–505, 2017/02/01/, 2017. [DOI] [PMC free article] [PubMed] [Google Scholar]
- [37].Deng F, Wang Y, Huang H, Niu M, Zhong S, Zhao L, Qi Z, Wu X, Sun Y, and Niu C, “Abnormal segments of right uncinate fasciculus and left anterior thalamic radiation in major and bipolar depression,” Progress in neuro-psychopharmacology & biological psychiatry, 2017. [DOI] [PubMed] [Google Scholar]
- [38].Jing B, Long Z, Liu H, Yan H, Dong J, Mo X, Li D, Liu C, and Li H, “Identifying current and remitted major depressive disorder with the Hurst exponent: a comparative study on two automated anatomical labeling atlases,” Oncotarget, vol. 8, no. 52, pp. 90452–90464, 2017. [DOI] [PMC free article] [PubMed] [Google Scholar]
- [39].Yoshida K, Shimizu Y, Yoshimoto J, Takamura M, Okada G, Okamoto Y, Yamawaki S, and Doya K, “Prediction of clinical depression scores and detection of changes in whole-brain using resting-state functional MRI data with partial least squares regression,” Plos One, vol. 12, no. 7, pp. e0179638, 2017. [DOI] [PMC free article] [PubMed] [Google Scholar]
- [40].Li M, Das T, Deng W, Wang Q, Li Y, Zhao L, Ma X, Wang Y, Yu H, Li X, Meng Y, Palaniyappan L, and Li T, “Clinical utility of a short resting-state MRI scan in differentiating bipolar from unipolar depression,” Acta Psychiatrica Scandinavica, vol. 136, no. 3, pp. 288–299, 2017. [DOI] [PubMed] [Google Scholar]
- [41].Zhong X, Shi H, Ming Q, Dong D, Zhang X, Zeng LL, and Yao S, “Whole-brain resting-state functional connectivity identified major depressive disorder: a multivariate pattern analysis in two independent samples,” Journal of Affective Disorders, vol. 218, pp. 346–352, 2017. [DOI] [PubMed] [Google Scholar]
- [42].Wang X, Ren Y, and Zhang W, “Depression Disorder Classification of fMRI Data Using Sparse Low-Rank Functional Brain Network and Graph-Based Features,” Computational and Mathematical Methods in Medicine, vol. 2017, pp. 3609821,2017. [DOI] [PMC free article] [PubMed] [Google Scholar]
- [43].Schnyer DM, Clasen PC, Gonzalez C, and Beevers CG, “Evaluating the diagnostic utility of applying a machine learning algorithm to diffusion tensor MRI measures in individuals with major depressive disorder,” Psychiatry Research, vol. 264, pp. 1, 2017. [DOI] [PMC free article] [PubMed] [Google Scholar]
- [44].Sundermann B, Feder S, Wersching H, Teuber A, Schwindt W, Kugel H, Heindel W, Arolt V, Berger K, and Pfleiderer B, “Diagnostic classification of unipolar depression based on resting-state functional connectivity MRI: effects of generalization to a diverse sample,” Journal of Neural Transmission, vol. 124, no. 5, pp. 589, 2017. [DOI] [PubMed] [Google Scholar]
- [45].Bhaumik R, Jenkins LM, Gowins JR, Jacobs RH, Barba A, Bhaumik DK, and Langenecker SA, “Multivariate pattern analysis strategies in detection of remitted major depressive disorder using resting state functional connectivity,” Neuroimage Clinical, vol. 16, no. C, pp. 390, 2017. [DOI] [PMC free article] [PubMed] [Google Scholar]
- [46].He H, Sui J, Du Y, Yu Q, Lin D, Drevets WC, Savitz JB, Yang J, Victor TA, and Calhoun VD, “Coaltered functional networks and brain structure in unmedicated patients with bipolar and major depressive disorders,” Brain Structure and Function, vol. 222, no. 9, pp. 4051–4064, December 01, 2017. [DOI] [PMC free article] [PubMed] [Google Scholar]
- [47].Hilbert K, Lueken U, Muehlhan M, and Beesdobaum K, “Separating generalized anxiety disorder from major depression using clinical, hormonal, and structuralMRIdata: A multimodal machine learning study,” Brain & Behavior, vol. 7, no. 3, pp. e00633, 2017. [DOI] [PMC free article] [PubMed] [Google Scholar]
- [48].Sankar A, Zhang T, Gaonkar B, Doshi J, Eras G, Costafreda SG, Marangell L, Davatzikos C, and Fu CHY, “Diagnostic potential of structural neuroimaging for depression from a multi-ethnic community sample,” BJPsych open, vol. 2, no. 4, pp. 247-254, 07/01 [DOI] [PMC free article] [PubMed] [Google Scholar]
- [49].Frangou S, Dima D, and Jogia J, “Towards person-centered neuroimaging markers for resilience and vulnerability in Bipolar Disorder,” Neuroimage, vol. 145, pp. 230–237, 2017/01/15/, 2017. [DOI] [PMC free article] [PubMed] [Google Scholar]
- [50].Ramasubbu R, Brown MRG, Cortese F, Gaxiola I, Goodyear B, Greenshaw AJ, Dursun SM, and Greiner R, “Accuracy of automated classification of major depressive disorder as a function of symptom severity,” Neuroimage Clinical, vol. 12, no. C, pp. 320–331, 2016. [DOI] [PMC free article] [PubMed] [Google Scholar]
- [51].Yang W, Chen Q, Liu R, Cheng H, Cui Q, Wei D, Zhang Q, and Qiu J, “Abnormal brain activation during directed forgetting of negative memory in depressed patients,” J Affect Disord, vol. 190, pp. 880–888, 2015. [DOI] [PubMed] [Google Scholar]
- [52].Foland-Ross LC, Sacchet MD, Prasad G, Gilbert B, Thompson RM, and Gotlib IH, “Cortical thickness predicts the first onset of major depression in adolescence,” International Journal of Developmental Neuroscience, vol. 46, pp. 125–131,2015. [DOI] [PMC free article] [PubMed] [Google Scholar]
- [53].Sacchet MD, Livermore EE, Juan Eugenio I, Glover GH, and Gotlib IH, “Subcortical volumes differentiate Major Depressive Disorder, Bipolar Disorder, and remitted Major Depressive Disorder,” Journal of Psychiatric Research, vol. 68, pp. 91, 2015. [DOI] [PMC free article] [PubMed] [Google Scholar]
- [54].Sacchet MD, Prasad G, Foland-Ross LC, Thompson PM, and Gotlib IH, “Support vector machine classification of major depressive disorder using diffusion-weighted neuroimaging and graph theory,” Frontiers in Psychiatry, vol. 6, pp. 21, 2015. [DOI] [PMC free article] [PubMed] [Google Scholar]
- [55].Sato JR, Jorge M, Sophie G, Deakin JFW, Thomaz CE, and Roland Z, “Machine learning algorithm accurately detects fMRI signature of vulnerability to major depression,” Psychiatry Research, vol. 233, no. 2, pp. 289–91,2015. [DOI] [PMC free article] [PubMed] [Google Scholar]
- [56].Johnston BA, Steele JD, Tolomeo S, Christmas D, and Matthews K, “Structural MRI-Based Predictions in Patients with Treatment-Refractory Depression (TRD),” Plos One, vol. 10, no. 7, 2015. [DOI] [PMC free article] [PubMed] [Google Scholar]
- [57].Johnston BA, Tolomeo S, Gradin V, Christmas D, Matthews K, and Douglas SJ, “Failure of hippocampal deactivation during loss events in treatment-resistant depression,” Brain, vol. 138, no. 9, 2015. [DOI] [PubMed] [Google Scholar]
- [58].Koutsouleris N, Meisenzahl EM, Borgwardt S, Riecherrössler A, Frodl T, Kambeitz J, Köhler Y, Falkai P, Möller H, and Reiser M, “Individualized differential diagnosis of schizophrenia and mood disorders using neuroanatomical biomarkers,” Brain A Journal of Neurology, vol. 138, no. 7, pp. 2059, 2015. [DOI] [PMC free article] [PubMed] [Google Scholar]
- [59].Yu S, Yoshimoto J, Toki S, Takamura M, Yoshimura S, Okamoto Y, Yamawaki S, and Doya K, “Toward Probabilistic Diagnosis and Understanding of Depression Based on Functional MRI Data Analysis with Logistic Group LASSO,” Plos One, vol. 10, no. 5, pp. e0123524, 2015. [DOI] [PMC free article] [PubMed] [Google Scholar]
- [60].Fung G, Deng Y, Zhao Q, Li Z, Qu M, Li K, Zeng Y, Jin Z, Ma Y, and Yu X, “Distinguishing bipolar and major depressive disorders by brain structural morphometry: a pilot study,” Bmc Psychiatry, vol. 15, no. 1, pp. 298, 2015. [DOI] [PMC free article] [PubMed] [Google Scholar]
- [61].Rosa MJ, Portugal L, Shawe-Taylor J, and Mourao-Miranda J, “Sparse Network-Based Models for Patient Classification Using fMRI,” in 2013 International Workshop on Pattern Recognition in Neuroimaging, 2013, pp. 66–69. [Google Scholar]
- [62].Redlich R, Almeida JJ, Grotegerd D, Opel N, Kugel H, Heindel W, Arolt V, Phillips ML, and Dannlowski U, “Brain morphometric biomarkers distinguishing unipolar and bipolar depression. A voxel-based morphometry-pattern classification approach.” Jama Psychiatry vol. 71, no. 11, pp. 1222, 2014. [DOI] [PMC free article] [PubMed] [Google Scholar]
- [63].Cao L, Guo S, Xue Z, Hu Y, Liu H, Mwansisya TE, Pu W, Yang B, Liu C, and Feng J, “Aberrant functional connectivity for diagnosis of major depressive disorder: a discriminant analysis,” Psychiatry & Clinical Neurosciences, vol. 68, no. 2, pp. 110–119, 2014. [DOI] [PubMed] [Google Scholar]
- [64].Macmaster FP, Carrey N, Langevin LM, Jaworska N, and Crawford S, “Disorder-specific volumetric brain difference in adolescent major depressive disorder and bipolar depression,” Brain Imaging & Behavior, vol. 8, no. 1, pp. 119–127, 2014. [DOI] [PubMed] [Google Scholar]
- [65].Zeng LL, Shen H, Liu L, and Hu D, “Unsupervised classification of major depression using functional connectivity MRI,” Human Brain Mapping, vol. 35, no. 4, pp. 1630, 2014. [DOI] [PMC free article] [PubMed] [Google Scholar]
- [66].Rondina JM, Hahn T, Oliveira L. d., Marquand AF, Dresler T, Leitner T, Fallgatter AJ, ShaweTaylor J, and MouraoMiranda J, “SCoRS - a Method Based on Stability for Feature Selection and Mapping in Neuroimaging,” IEEE transactions on medical imaging, vol. 33, no. 1, pp. 85, 2014. [DOI] [PMC free article] [PubMed] [Google Scholar]
- [67].Guo H, Cheng C, Cao X, Xiang J, Chen J, and Zhang K, “Resting-state functional connectivity abnormalities in first-onset unmedicated depression,” Neural Regeneration Research, vol. 9, no. 2, pp. 153–163, 2014. [DOI] [PMC free article] [PubMed] [Google Scholar]
- [68].Serpa ΜH, Ou Y, Schaufelberger MS, Doshi J, Ferreira LK, Machadovieira R, Menezes PR, Scazufca M, Davatzikos C, and Busatto GF, “Neuroanatomical Classification in a Population-Based Sample of Psychotic Major Depression and Bipolar I Disorder with 1 Year of Diagnostic Stability,” Biomed Research International, vol. 2014, no. 5, pp. 706157, 2014. [DOI] [PMC free article] [PubMed] [Google Scholar]
- [69].Habes I, Krall SC, Johnston SJ, Yuen KSL, Healy D, Goebel R, Sorger B, and Linden DEJ, “Pattern classification of valence in depression,” Neuroimage Clinical, vol. 2, no. 1, pp. 675–683, 2013. [DOI] [PMC free article] [PubMed] [Google Scholar]
- [70].Wei M, Qin J, Yan R, Li H, Yao Z, and Lu Q, “Identifying major depressive disorder using Hurst exponent of resting-state brain networks,” Psychiatry Research, vol. 214, no. 3, pp. 306–12, 2013. [DOI] [PubMed] [Google Scholar]
- [71].Grotegerd D, Stuhrmann A, Kugel H, Schmidt S, Redlich R, Zwanzger R, Rauch AV, Heindel W, Zwitserlood R, and Arolt V, “Amygdala excitability to subliminally presented emotional faces distinguishes unipolar and bipolar depression: An fMRI and pattern classification study,” Human Brain Mapping, vol. 35, no. 7, pp. 2995–3007, 2014. [DOI] [PMC free article] [PubMed] [Google Scholar]
- [72].Yu Y, Shen H, Zeng LL, Ma Q, and Hu D, “Convergent and Divergent Functional Connectivity Patterns in Schizophrenia and Depression,” Plos One, vol. 8, no. 7, pp. e68250, 2013. [DOI] [PMC free article] [PubMed] [Google Scholar]
- [73].Modinos G, Mechelli A, Petterssonyeo W, Allen P, Mcguire P, and Aleman A, “Pattern classification of brain activation during emotional processing in subclinical depression: psychosis proneness as potential confounding factor,” Peerj, vol. 1, no. 7, pp. e42, 2013. [DOI] [PMC free article] [PubMed] [Google Scholar]
- [74].Ma Z, Li R, Yu J, He Y, and Li J, “Alterations in Regional Homogeneity of Spontaneous Brain Activity in Late-Life Subthreshold Depression,” Plos One, vol. 8, no. 1, pp. e53148, 2013. [DOI] [PMC free article] [PubMed] [Google Scholar]
- [75].Zeng LL, Shen H, Liu L, Wang L, Li B, Fang P, Zhou Z, Li Y, and Hu D, “Identifying major depression using whole-brain functional connectivity: a multivariate pattern analysis,” Brain A Journal of Neurology, vol. 135, no. Pt 5, pp. 1498, 2012. [DOI] [PubMed] [Google Scholar]
- [76].Mwangi B, Ebmeier KP, Matthews K, and Steele JD, “Multi-centre diagnostic classification of individual structural neuroimaging scans from patients with major depressive disorder,” Brain A Journal of Neurology, vol. 135, no. Pt 5, pp. 1508, 2012. [DOI] [PubMed] [Google Scholar]
- [77].Lord A, Horn D, Breakspear M, and Walter M, “Changes in community structure of resting state functional connectivity in unipolar depression,” Plos One, vol. 7, no. 8, pp. e41282, 2012. [DOI] [PMC free article] [PubMed] [Google Scholar]
- [78].Liu F, Guo W, Yu D, Gao Q, Gao K, Xue Z, Du H, Zhang J, Tan C, and Liu Z, “Classification of Different Therapeutic Responses of Major Depressive Disorder with Multivariate Pattern Analysis Method Based on Structural MR Scans,” Plos One, vol. 7, no. 7, pp. e40968, 2012. [DOI] [PMC free article] [PubMed] [Google Scholar]
- [79].Mourão-Miranda J, Hardoon DR, Hahn T, Marquand AF, Williams SCR, Shawe-Taylor J, and Brammer M, “Patient classification as an outlier detection problem: An application of the One-Class Support Vector Machine,” Neuroimage, vol. 58, no. 3, pp. 793–804, 2011. [DOI] [PMC free article] [PubMed] [Google Scholar]
- [80].Hahn T, Marquand AF, Ehlis AC, Dresler T, Kittelschneider S, Jarczok TA, Lesch KP, Jakob PM, Mouraomiranda J, and Brammer MJ, “Integrating neurobiological markers of depression,” Archives of General Psychiatry, vol. 68, no. 4, pp. 361, 2011. [DOI] [PubMed] [Google Scholar]
- [81].Nouretdinov I, Costafreda SG, Gammerman A, Chervonenkis A, Vovk V, Vapnik V, and Fu CHY, “Machine learning classification with confidence: Application of transductive conformal predictors to MRI-based diagnostic and prognostic markers in depression,” Neuroimage, vol. 56, no. 2, pp. 809–813, 2011. [DOI] [PubMed] [Google Scholar]
- [82].Costafreda SG, Khanna A, Mourao-Miranda J, and Fu CH, “Neural correlates of sad faces predict clinical remission to cognitive behavioural therapy in depression,” Neuroreport, vol. 20, no. 7, pp. 637–41, 2009. [DOI] [PubMed] [Google Scholar]
- [83].Fu CH, Mouraomiranda J, Costafreda SG, Khanna A, Marquand AF, Williams SC, and Brammer MJ, “Pattern classification of sad facial processing: toward the development of neurobiological markers in depression,” Biological Psychiatry, vol. 63, no. 7, pp. 656, 2008. [DOI] [PubMed] [Google Scholar]
- [84].Lythe KE, Moll J, Gethin JA, Workman CI, Green S, Lambon Ralph MA, Deakin JF, and Zahn R, “Self-blame-Selective Hyperconnectivity Between Anterior Temporal and Subgenual Cortices and Prediction of Recurrent Depressive Episodes,” Jama Psychiatry, vol. 72, no. 11, pp. 1119–26, 2015. [DOI] [PubMed] [Google Scholar]
- [85].Korgaonkar MS, Rekshan W, Gordon E, Rush AJ, Williams LM, Blasey C, and Grieve SM, “Magnetic Resonance Imaging Measures of Brain Structure to Predict Antidepressant Treatment Outcome in Major Depressive Disorder,” Ebiomedicine, vol. 2, no. 1, pp. 37–45, 2015. [DOI] [PMC free article] [PubMed] [Google Scholar]
- [86].Williams LM, Korgaonkar MS, Song YC, Paton R, Eagles S, Goldstein-Piekarski A, Grieve SM, Harris AW, Usherwood T, and Etkin A, “Amygdala Reactivity to Emotional Faces in the Prediction of General and Medication-Specific Responses to Antidepressant Treatment in the Randomized iSPOT-D Trial,” Neuropsychopharmacology Official Publication of the American College of Neuropsychopharmacology, vol. 40, no. 10, 2015. [DOI] [PMC free article] [PubMed] [Google Scholar]
- [87].Schmaal L, Marquand AF, Rhebergen D, van Tol MJ, Ruha© HG, Nj VDW, Veltman DJ, and Penninx BW, “Predicting the Naturalistic Course of Major Depressive Disorder Using Clinical and Multimodal Neuroimaging Information: A Multivariate Pattern Recognition Study,” Biol Psychiatry, vol. 78, no. 4, pp. 278–286, 2015. [DOI] [PMC free article] [PubMed] [Google Scholar]
- [88].van Waarde JA, Scholte HS, van Oudheusden LJ, Verwey B, Denys D, and van Wingen GA, “Afunctional MRI marker may predict the outcome of electroconvulsive therapy in severe and treatment-resistant depression,” Molecular Psychiatry, vol. 20, no. 5, pp. 609, 2015. [DOI] [PubMed] [Google Scholar]
- [89].Korgaonkar MS, Williams LM, Song YJ, Usherwood T, and Grieve SM, “Diffusion tensor imaging predictors of treatment outcomes in major depressive disorder,” British Journal of Psychiatry the Journal of Mental Science, vol. 205, no. 4, pp. 321, 2014. [DOI] [PubMed] [Google Scholar]
- [90].Gong Q, Wu Q, Scarpazza C, Su L, and Jia Z, “Prognostic prediction of therapeutic response in depression using high-field MR imaging,” Neuroimage, vol. 55, no. 4, pp. 1497, 2011. [DOI] [PubMed] [Google Scholar]
- [91].Domingos P, “A few useful things to know about machine learning,” Communications of the Acm, vol. 55, no. 10, pp. 78–87, 2012. [Google Scholar]
- [92].Gong Q, and He Y, “Depression, neuroimaging and connectomics: a selective overview,” Biol Psychiatry, vol. 77, no. 3, pp. 223–235, February 1, 2015. [DOI] [PubMed] [Google Scholar]
- [93].Arbabshirani MR, Plis S, Sui J, and Calhoun VD, “Single subject prediction of brain disorders in neuroimaging: Promises and pitfalls,” Neuroimage, vol. 145, no. PtB, pp. 137, 2017. [DOI] [PMC free article] [PubMed] [Google Scholar]
- [94].Bishop CM, Pattern Recognition and Machine Learning (Information Science and Statistics) : Springer-Verlag New York, Inc., 2006. [Google Scholar]
- [95].Demirci O, Clark VP, Magnotta VA, Andreasen NC, Lauriello J, Kiehl KA, Pearlson GD, and Calhoun VD, “A Review of Challenges in the Use of fMRI for Disease Classification / Characterization and A Projection Pursuit Application from Multi-site fMRI Schizophrenia Study,” Brain Imaging & Behavior, vol. 2, no. 3, pp. 207–226, 2008. [DOI] [PMC free article] [PubMed] [Google Scholar]
- [96].Blum AL, and Langley P, “ Selection of relevant features and examples in machine,” Artificial Intelligence, vol. 97, no. 1–2, pp. 245–271, 1997. [Google Scholar]
- [97].Hall MA, and Smith LA, “Practical feature subset selection for machine learning,” Springer, 1998. [Google Scholar]
- [98].Kohavi R, and John GH, “Wrappers for feature subset selection,” Artificial Intelligence, vol. 97, no. 1–2, pp. 273–324, 1997. [Google Scholar]
- [99].Batmanghelich NK, Taskar B, and Davatzikos C, “Generative-discriminative basis learning for medical imaging,” IEEE Transactions on Medical Imaging, vol. 31, no. 1, pp. 51–69, 2011. [DOI] [PMC free article] [PubMed] [Google Scholar]
- [100].Pereira F, Mitchell T, and Botvinick M, “Machine learning classifiers and fMRI: a tutorial overview,” Neuroimage, vol. 45, no. 1 Suppl, pp. S199, 2009. [DOI] [PMC free article] [PubMed] [Google Scholar]
- [101].Klöppel S, Stonnington CM, Chu C, Draganski B, Scahill RI, Rohrer JD, Fox NC, Ashbumer J, and Frackowiak RSJ, “A plea for confidence intervals and consideration of generalizability in diagnostic studies,” Brain, vol. 132, no. 4, pp. el02–el02, 2009. [DOI] [PMC free article] [PubMed] [Google Scholar]
- [102].Hsu C, Chang C, and Lin C, “A Practical Guide to Support Vector Classication,” Journal of Intelligent and Fuzzy Systems, 2008. [Google Scholar]
- [103].Raudys SJ, and Jain AK, “Small sample size effects in statistical pattern recognition: recommendations for practitioners,” Pattern Analysis & Machine Intelligence IEEE Transactions on, vol. 13, no. 3, pp. 252–264, 1991. [Google Scholar]
- [104].Elisseeff A, andPontil M, “Lcavc-onc-out error and stability of learning algorithms w ith applications.”. Advances in Learning Theory: Methods, Models and Applications, Vol. 190, 2002. [Google Scholar]
- [105].Refaeilzadeh P, Tang L, and Liu H, Cross-Validation’. Springer US, 2009. [Google Scholar]
- [106].Bibi S, and Stamelos I, Selecting the Appropriate Machine Learning Techniques for the Prediction of Software Development Costs: Springer US, 2006. [Google Scholar]
- [107].Frank E, Hall M, Trigg L, Holmes G, and Witten IH, “Data mining in bioinformatics using Weka,” Bioinformatics, vol. 20, no. 15, pp. 2479, 2004. [DOI] [PubMed] [Google Scholar]
- [108].Kotthoff L, Gent IP, and Miguel I, “An evaluation of machine learning in algorithm selection for search problems,” Ai Communications, vol. 25, no. 3, pp. 257–270, 2011. [Google Scholar]
- [109].Qi S, Yang X, Zhao L, Calhoun VD, Perrone-Bizzozero N, Liu S, Jiang R, Jiang T, Sui J, and Ma X, “MicroRNA132 associated multimodal neuroimaging patterns in unmedicated major depressive disorder,” Brain, pp. awx366–awx366, 2018. [DOI] [PMC free article] [PubMed] [Google Scholar]
- [110].Calhoun VD, Adal T, Kiehl KA, Astur R, Pekar JJ, and Pearlson GD, “A method for multitask fMRI data fusion applied to schizophrenia,” Human Brain Mapping, vol. 27, no. 7, pp. 598, 2006. [DOI] [PMC free article] [PubMed] [Google Scholar]
- [111].Sui J, He H, Pearlson GD, Adali T, Kiehl KA. Yu Q, Clark VP, Castro E, White T, and Mueller BA, “Three-way (N-way) fusion of brain imaging data based on mCCA+jICA and its application to discriminating schizophrenia,” Neuroimage, vol. 66, pp. 119, 2013. [DOI] [PMC free article] [PubMed] [Google Scholar]
- [112].Kim DI, Sui J, Rachakonda S, White T, Manoach DS, Clark VP, Ho BCC, Schulz SC, and Calhoun VD, “Identification of Imaging Biomarkers in Schizophrenia: A Coefficient-constrained Independent Component Analysis of the Mind Multi-site Schizophrenia Study,” Neuroinformatics, vol. 8, no. 4, pp. 213–229, 2010. [DOI] [PMC free article] [PubMed] [Google Scholar]
- [113].Sui J, Adali T, Pearlson GD, and Calhoun VD, “An ICA-based method for the identification of optimal FMRI features and components using combined group-discriminative techniques,” Neuroimage, vol. 46, no. 1, pp. 73–86, 2009. [DOI] [PMC free article] [PubMed] [Google Scholar]
- [114].Sui J, Pearlson GD, Du Y, Yu Q, Jones TR, Chen J, Jiang T, Bustillo J, and Calhoun VD, “In search of multimodal neuroimaging biomarkers of cognitive deficits in schizophrenia,” Biological Psychiatry, vol. 78, no. 11, pp. 794–804, 2015. [DOI] [PMC free article] [PubMed] [Google Scholar]
- [115].Michael AM, Baum SA, Fries JF, Ho BC, Pierson RK, Andreasen NC, and Calhoun VD, “A method to fuse fMRI tasks through spatial correlations: applied to schizophrenia,” Human Brain Mapping, vol. 30, no. 8, pp. 2512–2529, 2010. [DOI] [PMC free article] [PubMed] [Google Scholar]
- [116].Sui J, Pearlson G, Caprihan A, Adali T, Kiehl KA, Liu J, Yamamoto J, and Calhoun VD, “Discriminating schizophrenia and bipolar disorder by fusing fMRI and DTI in a multimodal CCA+ joint ICA model,“ Neuroimage, vol. 57, no. 3, pp. 839–855, 2011. [DOI] [PMC free article] [PubMed] [Google Scholar]
- [117].He Y, and Evans AC, “Graph theoretical modeling of brain connectivity,” Current Opinion in Neurology, vol. 23, no. 4, pp. 341–350, 2010. [DOI] [PubMed] [Google Scholar]
- [118].Calhoun VD, and Adah T, “Feature-Based Fusion of Medical Imaging Data,” IEEE Transactions on Information Technology in Biomedicine A Publication of the IEEE Engineering in Medicine & Biology Society, vol. 13, no. 5, pp. 711, 2009. [DOI] [PMC free article] [PubMed] [Google Scholar]
- [119].Bracht T, Horn H, Strik W, Federspiel A, Schnell S, Höfle O, Stegmayer K, Wiest R, Dierks T, and Muller TJ, “White matter microstructure alterations of the medial forebrain bundle in melancholic depression,” Journal of Affective Disorders, vol. 155, no. 1, pp. 186, 2014. [DOI] [PubMed] [Google Scholar]
- [120].Abé C, Ekman CJ, Sellgren C, Petrovic R, Ingvar M, and Landén M, “Cortical thickness, volume and surface area in patients with bipolar disorder types I and II,” Journal of Psychiatry & Neuroscience Jpn, vol. 41, no. 4, pp. 240, 2015. [DOI] [PMC free article] [PubMed] [Google Scholar]
- [121].Phillips ML, and Swartz HA, “A Critical Appraisal of Neuroimaging Studies of Bipolar Disorder: Toward a New Conceptualization of Underlying Neural Circuitry and a Road Map for Future Research,” American Journal of Psychiatry, vol. 171, no. 8, pp. 829, 2014. [DOI] [PMC free article] [PubMed] [Google Scholar]
- [122].Arribas JI, Calhoun VD, and Adah T, “Automatic Bayesian classification of healthy controls, bipolar disorder, and schizophrenia using intrinsic connectivity maps from FMRI data,” IEEE Transactions on Biomedical Engineering, vol. 57, no. 12, pp. 2850–2860, 2010. [DOI] [PMC free article] [PubMed] [Google Scholar]
- [123].Calhoun V, Maciejewski P, d G, and Kiehl K, “Temporal lobe and “default” hemodynamic brain modes discriminate between schizophrenia and bipolar disorder,” Human Brain Mapping, vol. 29, no. 11, pp. 1265–1275, 2008. [DOI] [PMC free article] [PubMed] [Google Scholar]
- [124].Costafreda SG, Fu CH, Picchioni M, Toulopoulou T, Mcdonald C, Kravariti E, Walshe M, Praia D, Murray RM, and Mcguire PK, “Pattern of neural responses to verbal fluency shows diagnostic specificity for schizophrenia and bipolar disorder.” Bmc Psychiatry vol. 11, no. 1, pp. 18, 2011. [DOI] [PMC free article] [PubMed] [Google Scholar]
- [125].Pardo PJ, Georgopoulos AP, Kenny JT, Stuve TA, Findling RL, and Schulz SC, “Classification of adolescent psychotic disorders using linear discriminant analysis,” Schizophrenia Research, vol. 87, no. 1, pp. 297–306, 2006. [DOI] [PubMed] [Google Scholar]
- [126].Schnack HG, Nieuwenhuis M, Haren NEΜV, Abramovic L, Scheewe TW, Brouwer RM, Pol HEH, and Kahn RS, “Can structural MRI aid in clinical classification? A machine learning study in two independent samples of patients with schizophrenia, bipolar disorder and healthy subjects,” Neuroimage, vol. 84, no. 1, pp. 299, 2014. [DOI] [PubMed] [Google Scholar]