

1. Introduction
Traumatic brain injury (TBI) occurs when a head impact, penetration or rapid movement causes the brain to move rapidly within the skull leading to damage (Prins et al., 2013). Each year, approximately 1.7 million TBIs occur. This results in 1,365,000 (80.7%) emergency department visits, 275,000 (16.3%) hospitalizations, and 52,000 (3.0%) deaths (Taylor et al., 2015). TBI based on clinical symptoms is classified according to the Glasgow Coma Scale (GCS): mild (score 13–15), moderate (score 9–10) and severe (score <9) (Prins et al., 2013). Multiple neurochemical processes and cellular pathways are involved in response to the initial insult, including neuron and oligodendrocyte death (Raghupathi, 2004). Secondary injuries can occur from cellular and molecular mechanisms responding to the initial injury and can continue long-term (Prins et al., 2013). Repeated TBI are associated with chronic and sometimes progressive clinical symptoms and neuro-pathological loss of function. Additionally, evidence is growing that moderate to severe or repeated mild TBI (mTBI) incidents could lead to increased risk for Alzheimer’s Disease (Heneka et al., 2015; Prins et al., 2013), and chronic traumatic encephalopathy (CTE) (Mez et al., 2017; Prins et al., 2013; McKee et al., 2009), which is specifically described in patients that have a history of repeated head impacts (Gavett et al., 2010).
Objective and quantifiable biomarkers are needed to aid in acute TBI diagnosis and help predict those at risk for long-term effects (Rogg et al., 2014). Recent reviews evaluating moderate to severe TBI highlight the importance of candidate protein biomarkers abundant within neuronal and glial cells (Yokobori et al., 2013; Dash et al., 2010; Svetlov et al., 2009; Kochanek et al., 2008). However, this strategy has not produced relevant and clinically useful results when applied to mTBI. Although numerous works are focused on biomarkers to identify complicated or hemorrhagic mTBI, there is a paucity of similar studies on uncomplicated mTBI (Papa et al., 2016), which is a more prevalent pathology.
Extracellular vesicles (EVs) were described as a mechanism of cell-to-cell communication. EVs are released by cells, including stem cells and progenitors, and interact with target cells by surface-expressed ligands in the transfer of surface receptors, proteins, mRNA, and bioactive lipids (Papa et al., 2016; Yokobori et al., 2013; Michael et al., 2010; Svetlov et al., 2009). Clinically EVs can be isolated easily and quickly in a non-invasive fashion from multiple bodily fluids including urine and blood (Lakkaraju et al., 2008). Because of the distinctive cargo EVs can shuttle, as well as the fact that they are tissue specific, they may have a strong clinical application as biomarkers (Zhong et al., 2010; Hu et al., 2008; Skog et al., 2008). Additionally, since EVs are membrane bound, they are not subject to the same degradation that conventional serum biomarkers face. While most studies investigate disease processes with EVs isolated from serum, those that focus on noninvasive EVs biomarkers, such as those present in urine as seen in renal disease (Gonzales et al., 2009; Hu et al., 2008) and prostate cancer (Mitchell et al., 2009) or saliva (Gonzalez-Begne et al., 2009; Kapsogeorgou et al., 2005) as seen in brain cancer poses an exciting avenue to painlessly diagnose disease.
In the present study, we report the isolation and characterization of EVs from saliva and for the first time profiled the expression of Alzheimer disease genes in three groups of patients: acutely head injured emergency department (ED) patients, patients diagnosed with concussion from an outpatient concussion clinic, and controls. Given the literature surrounding head injury and Alzheimer’s disease (Becker at al., 2018; Ramos-Cejudo et al., 2018; Julien et al., 2017; Grinberg et al., 2016; Mendez et al., 2015), we hypothesized that patients with mTBI would express Alzheimer’s disease genes at significantly greater levels than controls. Our aim is to determine whether those gene expression profiles changed after mTBI and if the changes of the biomarkers could be potentially used to diagnose mTBI to prognosticate future development of post concussion syndrome (PCS) or CTE, a disease characterized by tau protein deposition and amyloid beta plagues similar to those seen in Alzheimer’s disease (Gavett et al., 2010).
2. MATERIALS AND METHODS
All participants and/or their relatives in addition to normal healthy control subjects gave written informed consent. The study was approved by the Rhode Island Hospital IRB. All clinical investigations have been conducted according to the principles expressed in the Declaration of Helsinki and have been carried out according to the international Good Laboratory Practice (GLP) and Good Clinical Practice (GCP) standard.
2.1. Patient selection
The study enrolled 54 participants: 15 patients with acute head trauma from the Rhode Island Hospital Level 1 Trauma Center Emergency Department (Emergency department patients; EDPT), 23 controls, and 16 patients with a diagnosis of concussion evaluated at an outpatient concussion clinic patients (CCPT). The patients and control subjects were randomly selected, and not matched for age, sex or ethnicity. Controls were screened and denied a history of mild, moderate or severe TBI. The patient demographic data are summarized (Table 1).
Table 1.
Patient Demographics of all subjects.
| ALL PARTICIPANTS | NORMAL HEALTHY CONTROLS |
CONCUSSION CLINIC PATIENTS |
ED HEAD TRAUMA PATIENTS |
|
|---|---|---|---|---|
| SAMPLE SIZE | 54 | 23 | 16 | 15 |
| AGE RANGE | 21–63 | 21–59 | 6–69 | |
| MEDIAN AGE | 25 | 33 | 27 | |
| GENDER | ||||
| MALE | 19 | 7 | 6 | 6 |
| FEMALE | 35 | 16 | 10 | 9 |
|
CONCUSSION
CLINIC PATIENTS ID |
GENDER |
Date of Injury |
AGE AT collection |
Days from injury to collection |
Medications prescribed at time of sampling |
| CCPT1 | M | 2-Mar-16 | 48 | 56 | none |
| CCPT2 | F | 3-Dec-15 | 51 | 145 | amitriptyline 10mg, melatonin 3mg, voltaren 1% topical gel |
| CCPT3 | F | 5-Nov-15 | 52 | 173 | none |
| CCPT4 | F | 28-Mar-16 | 31 | 30 | fioricet with codeine |
| CCPT5 | M | 17-Mar-16 | 46 | 41 | none |
| CCPT6 | F | 10-Nov-15 | 50 | 168 | meclizine 25mg |
| CCPT7 | M | 1-Oct-15 | 28 | 207 | amitripyline 50mg, amitriptyline 75mg |
| CCPT8 | F | 3-Mar-16 | 59 | 55 | none |
| CCPT9 | M | 1-May-16 | 33 | 107 | none |
| CCPT10 | F | 26-Jul-16 | 33 | 22 | none |
| CCPT11 | M | 19-Jul-16 | 21 | 29 | none |
| CCPT12 | F | 14-May-16 | 29 | 94 | trazodone 50mg |
| CCPT13 | M | 21-Jul-16 | 49 | 27 | none |
| CCPT15 | F | 6-Jun-16 | 33 | 72 | none |
| CCPT17 | F | 9-Jun-16 | 22 | 69 | none |
| CCPT19 | F | 16-May-16 | 26 | 92 | none |
|
ED PATIENT ID |
AGE
AT INJURY |
GENDER |
DIAGNOSIS OF
CONCUSSION IN ED |
REASON FOR ED VISIT | CT IMAGING |
| EDPT01 | 43 | M | U | Complex neuro history | NONE DOCUMENTED |
| EDPT02 | 36 | M | U | tree limb fell on head | NONE DOCUMENTED |
| EDPT03 | 25 | F | U | motocycle crash | NONE DOCUMENTED |
| EDPT04 | 31 | M | U | Recent head injury, assaulted | small subarachnoid hemorrhage |
| EDPT05 | 21 | M | U | motocycle crash | NONE DOCUMENTED |
| EDPT06 | 26 | F | N | collision with bus | NONE DOCUMENTED |
| EDPT07 | 6 | F | N | acute pharyngitis | NONE DOCUMENTED |
| EDPT08 | 67 | F | N | fell on ice, hit head, contusion occipital area | CT HEAD, negative |
| EDPT09 | 31 | F | Y | Motocycle crash head and neck | NONE DOCUMENTED |
| EDPT10 | 24 | F | Y | Fell on ice, struck left side of head and elbow | NONE DOCUMENTED |
| EDPT11 | 27 | F | Y | Car accident | CT head/cervical spine negative |
| EDPT12 | 45 | M | U | Hit head snowboarding with helmet | NONE DOCUMENTED |
| EDPT13 | 43 | M | U | Fell off minibike yesterday | NONE DOCUMENTED |
| EDPT14 | 20 | F | U | Hit head during car accident | NONE DOCUMENTED |
| EDPT15 | 19 | F | U | Head collision against another player | HEAD CT, negative |
Number of participants in control group, Concussion clinic patient group, and ED head trauma patients, with age range, median age, and gender. Concussion clinic patients = CCPT, ED head trauma patients =EDPT, N= no, M=male, F= female, Y= yes, U= Unknown
2.2. Saliva sample collection
According to established protocols (Navazesh et al., 1993), subjects were directed to orally rinse with cup of water prior to saliva collection. Subjects were directed to spit saliva into the test tube every 60 seconds. At least 5 ml of saliva was collected. One sample was collected per patient. Patients recruited from the ED had their head injury within 24 hours of saliva collection. EVs were isolated via differential ultracentrifugation and the size and concentration of the EV was analyzed using NanoSight NS500 instrument, transmission electron microscopy, and western blot analysis.
2.3. Salivary EVs Isolation
The protocol was adapted and modified from a previously reported method for salivary EVs isolation (Michael et al., 2010). Saliva samples were stored at −80°C until they were ready to be analyzed. The samples were subsequently thawed and centrifuged at 1,500g for 10 minutes at 4°C. The supernatant was collected and centrifuged at 17,000g for 15 minutes at 4°C. The supernatant was transferred and underwent ultracentrifugation at 120,000g for 1 hour at 4°C. The remaining pellet was washed with phosphate buffered saline (PBS) and centrifuged at 120,000g for 1hour at 4°C. EVs were then resuspended in 500 μl PBS.
2.4. Measurement of particle size and concentration distribution with NanoSight
Nanoparticles in the saliva EVs suspensions were analyzed using the NanoSight NS500 instrument (NanoSight Ltd). The analysis settings were optimized and kept constant between samples, and each video was analyzed to give the mean, mode, median and estimated concentration for each particle size. Samples were measured at 1:20 dilution, yielding particle concentrations in the region of 1 × 10⁸ particles ml−1 as per manufacturer’s recommendations. All samples were analyzed in triplicate.
2.5. Transmission electron microscopy (TEM)
TEM was performed on isolated salivary EVs resolved in PBS, placed on 200 mesh nickel formvar carbon coated grids (Electron Microscopy Science) and left to adhere for 20 minutes. Grids were incubated with 2.5 % glutaraldehyde / 2% sucrose. EVs were negatively stained with NanoVan (Nanoprobes) and observed by Jeol JEM 1010 electron microscope (Jeol).
2.6. Western Blot analysis
EVs were lysed with RIPA buffer (Sigma Aldrich). Protein content was measured by Bradford method (Bio-Rad). EVs lysates (30μg) were separated by 4%−15% gradient polyacrylamide gel electrophoresis (Bio-Rad) and then immunoblotted with antibody anti-CD63 (Santa Cruz). The protein bands were visualized with an enhanced chemiluminescence (ECL) detection kit and ChemiDoc™ XRS-System (Bio-Rad).
2.7. PCR Profiling
RNA was isolated using Trizol (Invitrogen) according to the manufacturer’s protocol. RNA quality and quantification was done using Nanodrop 1000. cDNA was synthesized from the RNA with the High Capacity cDNA transcription kit (Applied Biosystems) in a final volume of 20ul. Amplification reactions consisted of one cycle for 10 minutes at 25°C, one cycle for 120 minutes at 37°C, and one cycle for 5 minutes at 85°C using a 9800 Fast Thermal Cycler (Applied Biosystems). Pre-amplification reactions were performed in a final volume of 50μl: 12.5μl of diluted 96 TaqMan gene assay mix, 25μl of TaqMan Preamp Master mix (Applied Biosystems) and 12.5μl of cDNA. The reaction consisted of 10 minutes at 95ºC followed by 14 cycles consisted of 15 seconds at 95ºC then 60ºC at 4 minutes. TaqMan® Human Alzheimer’s Array (Applied Biosystems), (Supplementary Table1, List of genes on the array) has 93 genes (3 endogenous controls) known to be altered in Alzheimer’s disease and three endogenous controls. Cards were loaded with cDNA and TaqMan® Universal PCR master mix (Applied Biosystems) and run on the Viia7 Real-Time PCR System (Life Technologies) using Relative Quantification settings. The cycle threshold (CT) readings were used to determine fold change (FC) of gene expression. Samples with a CT of <35 were considered for calculating the FC in expression. The 2-CT method was used to calculate relative expression of each target gene. Mean CT value of target genes in each sample were normalized to its averaged housekeeping gene (GAPDH) CT value to give a delta CT value. This was then normalized to control sample (delta delta CT), and the 2-CT value was obtained and converted to FC.
2.8. Statistical Analysis Methods
All statistical analysis was done on STATA software. One-way ANOVA statistical test was performed on participant ages. Wilcoxon sum test was performed on the gender differences in each group. Wilcoxon sum test was used to compare the delta CT values of each gene between two groups: ED patients (EDPT) versus controls, concussion clinic patients (CCPT) versus controls, and EDPT versus CCPT. A p-value of <0.05 was used for statistical significance.
3. Results
3.1. Sample comparison of patient groups to healthy controls
The mean ages of the outpatient concussion clinic patients are significantly older than the average age of controls (38.1 versus 29.5, p=0.045), but not so with the EDPT (30.9 versus 29.52, p=0.76) (Table 1).
3.2. Characterization, Quantification, and Size Distribution of human salivary EVs
TEM was performed on purified EVs characterizing their spheroid morphology and size (Fig. 1A), and protein marker CD63 (Fig. 1B). The diameter of the particles ranged from 20 to 1000 nm. The individual patient salivary EVs sample size distribution (Fig. 2A) and concentration of EVs (Fig. 2B) from controls, ED patients, and concussion clinic patients are displayed with standard deviation. Both the mean size (Fig. 2C) of the EVs as well as the concentration of the EVs (Fig. 2D) increased in ED patients compared with controls.
Figure 1. Transmission Electron Microscope and western blot images and Nanosight images.
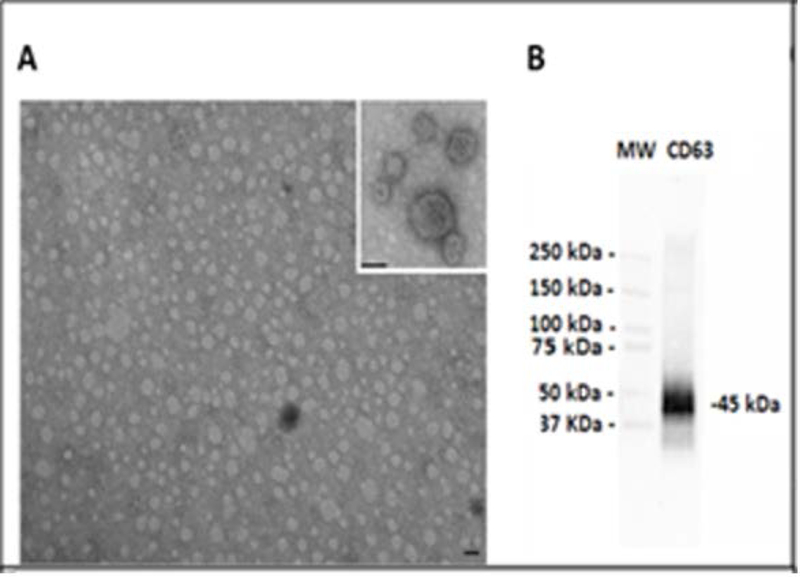
(A) Representative transmission electron microscopy of EVs isolated from saliva. EVs were viewed by JEOL Jem 1010 electron microscope (original magnification X100,000; inset original magnification X150,000; black lines= 100 nm). (B) Representative Western Blot analysis of CD63 from saliva EVs. (MW= standard molecular weight markers).
Figure 2 . Transmission Electron Microscope and western blot images and Nanosight images.
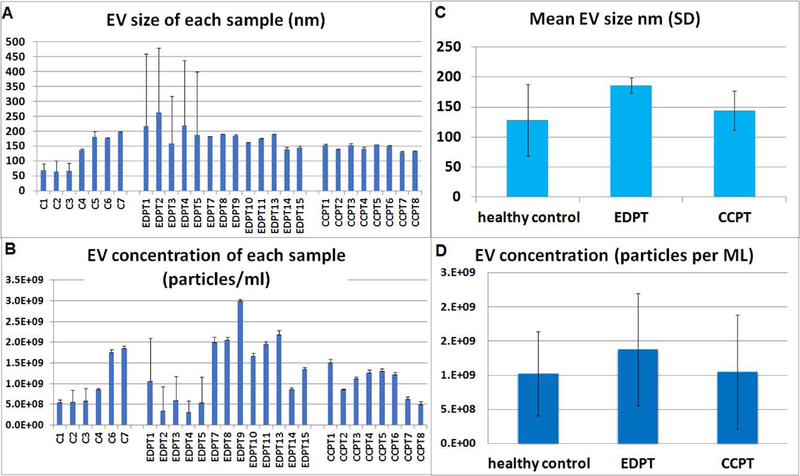
(A) Salivary EVs size distribution in nanometer (nm) of each control (n =7), concussion clinic patients (CCPT) (n=8), and ED head trauma patients (EDPT) (n=13). (B) EVs concentration for each patient by nanosight analysis showing the number of EVs per milliliter of saliva derived from controls (n =7), CCPT (n=8), and EDPT (n=13). (C) mean salivary evs size with standard deviation by nanosight analysis showing the mode size of EVs in 1 ml of saliva derived from controls (n =7), CCPT (n=8), and EDPT (n=13).(D) mean EVs concentration with standard deviation by nanosight analysis showing the mode size of EVs in 1 ml of saliva derived from controls (n =7), CCPT (n=8), and EDPT (n=13).
3.3. Comparison between control and acute ED patients
To assess whether the salivary EVs gene expression profiles in response to head trauma, we used Alzheimer’s disease array analysis in salivary EVs. Of the 93 genes from the array, 57 genes were upregulated with a FC higher than two between EDPT and controls. Wilcoxon sum test shows a statistically different expression between the two groups in 15 genes (Table 2A), including: ABCA1, AGER, APLP2, CDC2, CSNK1A1, CSNKID, CTSD, GSK3B, IL1B, LRPAP1, MAPT, PRKCB1, PSEN1, SOAT1, and SOD2. Each individual EDPT with the number of genes with FC above 50, 20, or 2 (FC above 2 considered biologically relevant) is represented (Fig. 3A). The 57 genes that were upregulated in EDPT compared to controls is shown in figure 3B. Gene upregulation (FC > 2) ranged from 45 genes in EDPT5 and EDPT8 to only eight genes in EDPT12.
Table 2.
Analysis of genes in controls vs. patient populations.
| A Controls vs ED head trauma patients | ||||
|---|---|---|---|---|
| GENE | ΔCT ± SD controls |
ΔCT ± SD EDPT |
P-value ΔCT | FC ± SD EDPT |
| ABCA1 | 9·51 ± 3·54 | 7·99 ± 1·80 | 0·0239 | 5·27 ± 6·73 |
| AGER | 8·60 ± 4·02 | 5·92 ± 2·95 | 0·0203 | 20·5 ± 32·75 |
| APLP2 | 7·36 ± 3·24 | 5·33 ± 2·34 | 0·0008 | 17·20 ± 26·99 |
| CDC2 | 9·62 ± 3·11 | 11·48 ± 3·70 | 0·055 | 6·90 ± 18·48 |
| CSNK1A1 | 6·25 ± 2·57 | 3·92 ± 2·01 | 0·0071 | 15·9 ± 15·2 |
| CSNK1D | 4·80 ± 2·03 | 3·33 ± 1·58 | 0·004 | 5·34 ± 5·6 |
| CTSD | 4·68 ± 3·53 | 2·95 ± 2·27 | 0·0354 | 8·06 ± 5·09 |
| GSK3B | 6·44 ± 2·74 | 3·91 ± 1·25 | 0·0027 | 6·89 ± 5·87 |
| IL1B | −0·28 ± 5·95 | −1·63 ± 1·39 | 0·055 | 2·72 ± 2·35 |
| LRPAP1 | 7·67 ± 2·53 | 6·27 ± 1·12 | 0·0102 | 3·77 ± 4·39 |
| MAPT | 8·15 ± 2·81 | 10·93 ± 3·93 | 0·0477 | 3·0 ± 7·15 |
| PRKCB1 | 5·8 ± 3·24 | 3·27 ± 2·04 | 0·0049 | 10·599 ± 15·49 |
| PSEN1 | 6·94 ± 2·66 | 6·15 ± 2·05 | 0·0259 | 5·1 ± 7·64 |
| SOAT1 | 8·67 ± 4·59 | 7·31 ± 2·09 | 0·044 | 7·51 ± 14·87 |
| SOD2 | 1·24 ± 4·43 | −0·74 ± 1·30 | 0·027 | 4·29 ± 3·22 |
| B Controls vs Concussion clinic patients | |||||
|---|---|---|---|---|---|
| GENE | ΔCT ± SD controls |
ΔCT ± SD CCPT |
P-value ΔCT | FC ± SD CCPT | |
| ACHE | 10·84 ± 3·86 | 12·8 ± 2·4 | 0·054 | 3·57 ± 14·31 | |
| APPBP1 | 9·54 ± 3·57 | 11·62 ± 1·71 | 0·0141 | 0·42 ± 0·65 | |
| CAPNS2 | 2·80 ± 3·05 | −0·32 ± 2·03 | 0·0002 | 19·30 ± 167 | |
| CASP6 | 7·90 ± 2·88 | 10·41 ± 3·5 | 0·0811 | 2·11 ± 3·41 | |
| CDC2 | 9·62 ± 3·11 | 12·42 ± 2·73 | 0·006 | 1·83 ± 5·88 | |
| CDK5R1 | 3·90 ± 3·55 | −0·69 ± 1·78 | 0·009 | 42·25 ± 41·46 | |
| CHRM1 | 3·99 ± 3·13 | 0·44 ± 1·80 | 0·0011 | 23·7 ± 30·48 | |
| CHRM3 | 5·22 ± 4·54 | 2·63 ± 4·7 | 0·011 | 34·97 ± 38·18 | |
| CHRNA7 | 10·91 ± 4·11 | 12·87 ± 2·9 | 0·051 | 16·89 ± 67·59 | |
| CSNK1A1 | 6·25 ± 2·57 | 3·4 ± 1·10 | 0·0002 | 14·0 ± 9·25 | |
| CTSD | 4·68 ± 3·53 | 2·8 ± 2·69 | 0·0195 | 8·59 ± 6·55 | |
| GJB1 | 3·74 ± 3·44 | −0·23 ± 1·74 | 0·0002 | 22·03 ± 18·3 | |
| GRIN2A | 10·93 ± 3·79 | 13·05 ± 2·3 | 0·051 | 2·4 ± 9·8 | |
| SLC18A3 | 4·18 ± 4·97 | 1·71 ± 3·36 | 0·0153 | 15·71 ± 15·92 | |
| C Concussion clinic patients compared to ED head trauma patients | ||||||
|---|---|---|---|---|---|---|
| GENE |
ΔCT ± SD CCPT |
FC ± SD CCPT |
ΔCT ± SD EDPT |
FC ± SD EDPT |
EDPT vs CCPT p- value |
|
| AGER | 8·32 ± 3·37 | 5·65 ± 7·7 | 5·92 ± 2·95 | 20·17 ± 32·9 | 0·0243 | |
| APH1B | 8·79 ± 2·8 | 1·2 ± 1·22 | 6·78 ± 2·07 | 3·23 ± 4·54 | 0·0398 | |
| APLP2 | 8·3 ± 3·46 | 5·5 ± 10·44 | 5·33 ± 2·34 | 17·0 ± 27·12 | 0·0159 | |
| BACE2 | 5·58 ± 1·81 | 3·97 ± 7·8 | 7·10 ± 1·95 | 0·65 ± 0·75 | 0·015 | |
| CAPNS2 | −0·32 ± 2·03 | 19·30 ± 16·77 | 5·45 ± 4·31 | 1·36 ± 2·22 | 0·0001 | |
| CDK5R1 | −0·69 ± 1·78 | 42·2 ± 41·46 | 2·21 ± 3·10 | 10·35 ± 15·76 | 0·003 | |
| CHRM1 | 0·44 ± 1·80 | 23·72 ± 30·48 | 5·42 ± 4·60 | 4·4 ± 7·5 | 0·0009 | |
| CHRM3 | 2·63 ± 4·7 | 34·9 ± 38·18 | 6·18 ± 4·03 | 6·09 ± 14·2 | 0·0044 | |
| CSNK1D | 4·1 ± 0·90 | 2·2 ± 1·3 | 3·33 ± 1·58 | 5·2 ± 5·7 | 0·0398 | |
| GJB1 | −0·23 ± 1·74 | 22·0 ± 18·33 | 4·57 ± 3·95 | 3·23 ± 6·36 | 0·0001 | |
| GSK3B | 5·92 ± 2·4 | 2·94 ± 4·39 | 3·91 ± 1·25 | 6·82 ± 5·95 | 0·0034 | |
| IL1B | −0·60 ± 1·36 | 1·4 ± 1·7 | −1·63 ± 1·39 | 2·72 ± 2·35 | 0·0197 | |
| IL6 | 12·5 ± 2·71 | 1·66 ± 5·13 | 9·89 ± 2·62 | 4·37 ± 14·77 | 0·0143 | |
| MAPK1 | 5·48 ± 1·7 | 1·32 ± 0·95 | 4·62 ± 2·41 | 3·22 ± 2·57 | 0·0297 | |
| MME | 6·64 ± 1·52 | 2·04 ± 1·86 | 5·58 ± 2·79 | 8·68 ± 16·2 | 0·0481 | |
| NCSTN | 8·857 ± 1·95 | 0·84 ± 1·20 | 6·92 ± 1·62 | 2·17 ± 2·89 | 0·0023 | |
| PRKCB1 | 5·44 ± 2·31 | 1·98 ± 1·92 | 3·27 ± 2·04 | 10·46 ± 15·58 | 0·0012 | |
| PSEN1 | 7·72 ± 2·46 | 1·5 ± 1·09 | 6·15 ± 2·05 | 4·98 ± 7·77 | 0·0481 | |
| SLC18A3 | 1·71 ± 3·36 | 15·7 ± 15·9 | 6·04 ± 4·48 | 3·13 ± 5·87 | 0·002 | |
| SOAT1 | 8·82 ± 2·5 | 3·27 ± 4·9 | 7·31 ± 2·09 | 7·18 ± 15·03 | 0·0481 | |
| SOD2 | 0·94 ± 1·4 | 1·33 ± 0·87 | −0·74 ± 1·30 | 4·29 ± 3·22 | 0·0018 | |
| ST6GAL1 | 10·69 ± 2·84 | 1·18 ± 1·85 | 8·62 ± 3·81 | 4·40 ± 7·08 | 0·0398 | |
| TNF | 9·37 ± 4·13 | 2·4 ± 3·4 | 5·95 ± 3·23 | 7·76 ± 8·04 | 0·0114 | |
(SD= standard deviation) (FC = fold change)
Comparison between controls (n=23) and EDPT (n=15), columns: gene, controls average ±SD deltaCT, EDPT average ±SD deltaCT, p-value, and average ±SD FC.
Comparison between controls (n=23) and CCPT (n=16), columns: gene, controls average ±SD deltaCT, CCPT average ±SD deltaCT, p-value, and average ±SD FC.
Comparison of gene expression between CCPT and EDPT. Columns: gene, CCPT average ±SD deltaCT, CCPT average ±SD FC, EDPT average ±SD deltaCT, EDPT average ±SD FC, and the p-value.
Figure 3. Gene expression information of ED Patients.
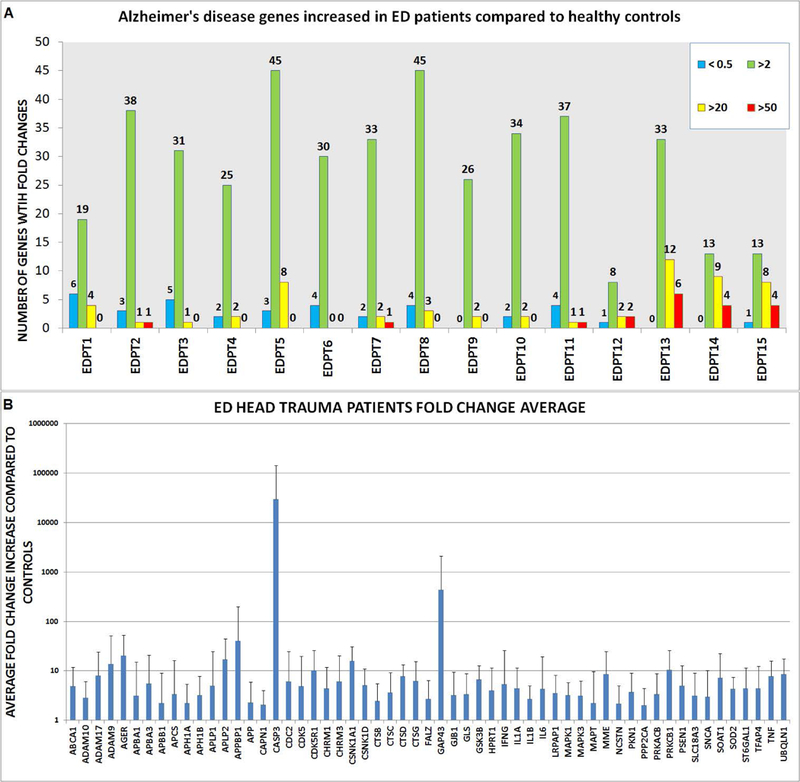
(A) Number of genes upregulated and downregulated. Upregulated gene expression in three tiers: fold increase 50-fold higher than controls in red, 20-fold higher in yellow, and fold increase of two in green. Downregulated gene expression <0.5 in blue. (B) Genes with two- fold increase in gene expression or higher. Error bars represent standard deviation.
3.4. Comparison between control and chronic concussion clinic patients
Gene expression profile in outpatient clinic patients (CCPT) showed 56 genes upregulated compared with controls. Wilcoxon rank sum test identified 14 genes with significant difference between the two groups (Table 2B), including: APBB3, ACHE, CAPNS2, CDC2, CDK5R1, CHRM1, CHM3, CSNK1A1, CTSD, GJB1, IFNG, IL6, CHRNA7, GRIN2A, AND SLC18A3. The number of genes upregulated in each CCPT compared to controls is demonstrated in Fig. 3A. The genes of the individual patients with FC above 50, 20, or 2 is shown in figure 4. Gene upregulation (FC > 2) ranged from 54 genes with CCPT4 to 17 genes in CCPT6. Level in gene expression from each Alzheimer’s disease gene was averaged (Fig. 4B).
Figure 4. Gene expression information of Concussion Clinic patients.
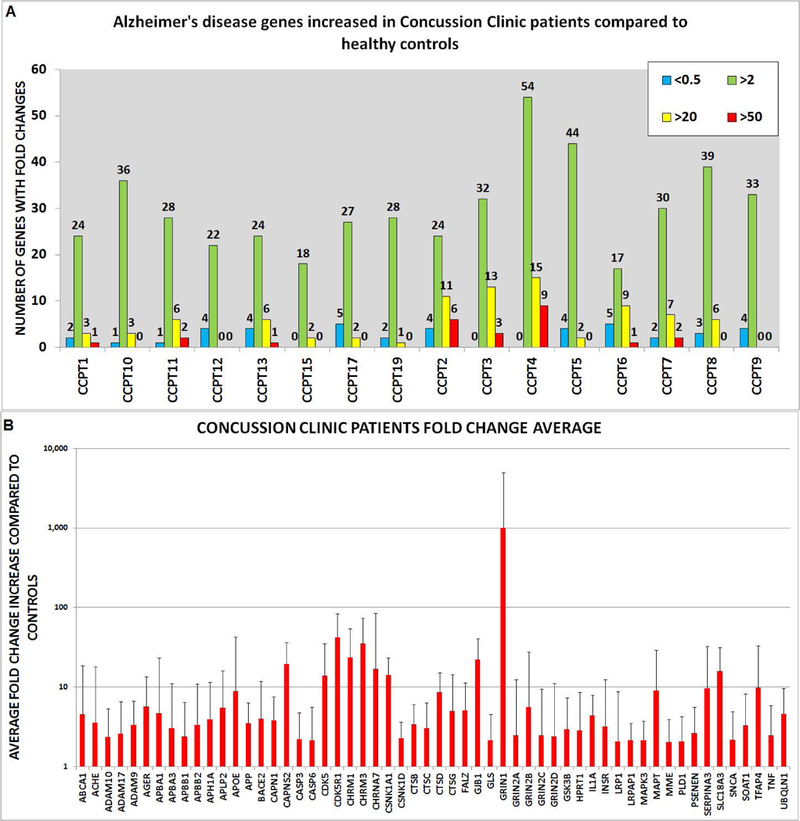
(A) Number of genes upregulated and downregulated. Upregulated genes are shown in three tiers: fold increase 50-fold higher than controls in red, 20-fold higher in yellow, and a fold increase of two in green. Downregulated gene expression <0.5 shown in blue. (B) All the genes that had two- fold increase in expression or higher. Error bars represent standard deviation.
3.5. Comparison between ED patients and outpatient concussion clinic patients
Wilcoxon sum test of delta CT values shows that 23 Alzheimer’s disease genes have a statistically significant difference between the two patient groups (Table 2C), including: AGER, APH1B, APLP2, BACE2, CAPNS2, CDK5R1, CHRM1, CHRM3, CSNK1D, GJB1, GSK3B, IL1B, IL6, MAPK1, MME, NCSTN, PRKCB1, PSEN1, SLC18A3, SOAT1, SOD2, ST6GAL1, and TNF. The average FC in each gene is shown in graph (Fig. 5A) comparing EDPT and CCPT. Concussion clinic patients have higher upregulation of genes: BACE2, CAPNS2, CDK5R1, CHRM1, CHRM3, GJB1, and SLC18A3 while emergency department patients have higher gene upregulation of AGER, APH1B, APLP2, CSNK1D, GSK3B, ILIB, IL6, MAPK1, MME, NCSTN, PRKCB1, PSEN1, SOAT1, SOD2, ST6GAL1, and TNF. Of the 14 genes of the CCPT and 15 genes of the EDPT that had statistically significant changes compared to controls, three were found in both group CDC2, CSNK1A1, and CTSD. Comparing the genes among the individual patients from the emergency department using the Wilcoxon test showed no statistical significance, p>0.05. EDPT FC was CDC2 (6.1±18.75), CSNK1A1 (15.78±15.84), and CTSD (7.86±5.39). CCPT FC was CDC2 (1.83±5.88), CSNK1A1 (14.0±9.25), and CTSD (8.5±6.5) (Fig. 5B).
Figure 5. Upregulated Genes in experimental groups.

Wilcoxon analysis was done comparing deltaCT of EDPT and CCPT. 23 Alzheimer’s disease genes significantly (p<0.05) changed in EDPT (n=15) compared to CCPT (n=16). (A) Fold increase of significant genes of each patient is compared. (B) Three genes found in both patient groups. No statistical difference of three genes between EDPT and CCPT (p>0.05).
4. Conclusions
There are no biomarkers to help diagnose mTBI or that can predict poor sequelae such as PCS or CTE. Current biomarkers of brain injuries are obtained from serum or CSF, which is not easily accessible, and focus on more severe head injuries that have associated radiographic abnormalities. On the other hand, identifying a noninvasive biomarker, such as saliva, that can diagnose a concussion or that can identify those at risk for sequelae such as a prolonged recovery or post concussive syndrome, Alzheimer’s disease, or CTE is an exciting possibility. This is the first study isolating EVs from saliva in order to identify potential biomarkers for mTBI. In this study, we successfully isolated and identified EVs from saliva as confirmed by TEM and NanoSight analysis of EVs morphology and size and we were able to detect the EVs size distribution and concentration through NanoSight (Fig. 2A–2D). Circulating EVs contain proteins and RNAs, such as mRNA and miRNA (Quesenberry et al., 2015). Several studies have suggested using exosome biomarkers for disease diagnosis (Lau et al., 2012; Michael et al., 2010; Valadi et al., 2007). The use of exosome cargo as possible markers for disease is a new area of research and EVs to diagnose dementia has been explored previously by Schneider et al., 2016, and Goetzl et al., 2016.
CTE is a constellation of cognitive, mood, personality, and behavioral alterations that can develop following a single incident or repeated episodes of mild TBI (Gavett et al., 2011; Jordan et al., 2000; Mendez et al., 1995). CTE currently can only be diagnosed at autopsy and in vivo biomarker studies are lacking as are longitudinal studies (Asken et al., 2017). CTE features include extensive tau neurofribrillary tangles, amyloid beta plaques, and some macroscopic abnormalities such as cerebral atrophy and enlarged ventricles as seen in Alzheimer’s disease (Gavett et al., 2010). While the clinical definition is much debated, there is clear overlap between CTE and TBI-induced dementia as experienced by professional boxers (Zetterberg et al., 2013), retired football players, soccer players, hockey and wrestlers (Gavett et al., 2010). On this same spectrum of cognitive decline, one could also include Alzheimer’s disease, and its cardinal findings of neurofibrillary tangles, tau and amyloid plaques – a striking pathology often found in professional boxers with CTE (Tokuda et al., 1991; Roberts et al., 1990). -Studies of individuals who died after a TBI event had amyloid plaques present in all age groups (Ramos-Cejudo et al., 2018; Johnson et al., 2010). However, among patients who died from non-neurological causes, plaques were only seen in elderly individuals (Ramos-Cejudo et al., 2018; Johnson et al., 2010). Therefore, TBI or repeated head injuries (mTBI) are strong risk factor for both CTE and Alzheimer’s disease (Sivanandam et al., 2012; Gavett et al., 2010). Because of this association, the TaqMan® human Alzheimer’s disease array was used to profile gene expressions in our patient samples. The selected genes that were identified are involved in amyloid precursor protein (APP) processing and are implicated in multiple secondary steps of Aβ aggregation, tau hyperphosphorylation, excitotoxicity, inflammation, apoptosis, oxidation, and microglial activation.
We identified 15 Alzheimer’s disease associated mRNAs that had significant expression changes in salivary EVs isolated from ED patients when compared to controls and 14 Alzheimer’s disease associated mRNAs in outpatient concussion clinic patients compared to controls (Table 2A-2B). There were three genes that were common in both patient groups CDC2, CTSD, and CSNK1A1. CTSD (cathepsin D) is associated with pathways involved in plaque formation and APP metabolism and was present in 12 out of the 15 ED patients and 15 out of 16 concussion clinic patients with a FC higher than two when compared to controls (p< 0.05). CSNK1A1 was present in 13 out of 15 ED patients and 16 out of 16 concussion clinic patients with a FC higher than two when compared to controls (p <0.05). This is a casein-kinase which is involved in the phosphorylation state of tau, a component of neurofibrillary tangles and plays a key role in the pathology to Alzheimer’s disease and cell death. Both CTSD and casein kinase (CSNK1A1) are potential candidates for determination of head trauma and likely concussion. Future studies will correlate the levels of these two candidate biomarkers with neurocognitive testing.
Genes associated with Alzheimer’s disease have also been associated with other cerebral/neuronal injury (Ramos-Cejudo et al., 2018; White et al., 2016). We assayed a number of Alzheimer’s disease related genes that also play a role in neuronal injury: CAPN1 (Saatman et al., 2010), CDK5R1 (Dekker et al. 2014), CDK5 (Yousuf et al., 2016), MAPT (Raghupathi, 2004), GSK3B (White et al., 2016), and CASP3 (White et al., 2016; Raghupathi, 2004), which were all upregulated (FC >2) in the patient populations. These genes are involved in the formation of neurofibrillary tangles and cell death associated in Alzheimer’s disease. Also, of interest was the portion of the Alzheimer’s disease pathway that is involved in CDK5 deregulation. Many genes involved in the deregulation of CDK5 aspect of the Alzheimer’s disease pathway were upregulated in both subacute patients from the concussion clinic and acutely head injured patients from the ED. The genes involved in the deregulation of CDK5 within the Alzheimer’s disease pathway that were upregulated (FC>2) in the concussion clinic patients: CDK5R1 (FC=44.9) CDK5 (FC=27.83), GSK3B (FC=5.54), CAPN1 (FC=5.13), CAPNS2 (FC=20.5), CSNK1A1 (FC=14.0), and MAPT (FC= 23.85). The genes involved in the deregulation of CDK5 that were upregulated (FC > 2) in the ED patient group: CDK5(FC=18.58), CDK5R1(FC=12.83), GSK3B(FC=7.72), CAPN1(FC=3.81), CSNK1A1(FC=18.21), and CSNK1D(FC=6.62). Current research has demonstrated aberrant CDK5 expression with TBI. CDK5 knockout mice subjected to controlled cortical impact show significantly less injury compared to wild type mice (Yousuf et al., 2016). CDK5 is consistently elevated in mice subjected to cortical impact (Yousuf et al., 2016) and in hypoxia/ischemic brain injury in rats (Tan et al., 2015). This pathway becomes of interest for human TBI diagnosis and for possible therapeutic targets.
The salivary markers we have identified have established physiological roles in the pathogenesis of neurodegenerative disease such as Alzheimer’s disease, a disease with a multitude of pathophysiological and clinical correlations with TBI (Hu et al., 2017). Clinically, collecting salivary EVs is a simple and non-invasive process. Additionally, EVs are membrane bound, and are therefore not subject to the same degradation that conventional serum biomarkers face. Salivary EVs in particular can be isolated based on tissue specificity and have well established roles in the detection of numerous other disease states, including oral squamous cell carcinoma (Tang et al., 2013). Grading and stratifying TBI severity are routinely based on very subtle examination and neuroimaging findings, which are increasingly difficult to identify acutely (Papa et al., 2015). Salivary EVs may circumvent this, and ultimately allow for early diagnosis, as well as stratification of TBI at a time when intervention may dictate prognosis. Another clinical potential of salivary EVs would be to isolate their chemical cargo and monitor therapeutic responses to interventions by scanning for signals associated with neural regeneration or neural degeneration; thus, alerting clinicians to patients that warrant more aggressive therapy earlier in the course of recovery.
Limitations of this study include the cross-sectional design. While samples were collected only once in each patient group, the use of the acute ED head injury and a sub-acute/chronic symptomatic concussed group provided inferential data on the longitudinal course of mTBI. A prospective study of patients with mTBI, obtaining repeated samples over weeks and months could provide data on intra-subject patterns of post-TBI gene expression. Another limitation is that it has not been definitively shown that a single mTBI can be a pre-cursor to CTE. While the Alzheimer’s disease panel appears to be a potential marker for mTBI and PCS, whether the Alzheimer’s disease panel is an indicator of potential future CTE is not known or addressed in our study.
In this study, we have provided evidence that salivary EVs serve as a minimally invasive and reliable source for human mTBI-biomarkers. The patterns of candidate biomarkers might indicate current risk factors for PCS, and their expression might be an indication of symptomatic and neurophysiologic recovery after mTBI. Delineating the evolution of salivary EVs gene expression after head trauma or diagnosis of concussion will be necessary for a fuller understanding of the significance to these elevated gene expression patterns.
We assert that determination of mRNA expression on the Taqman® Alzheimer’s disease array may be a valid measure of concussion risk. Larger, longitudinal studies over time will be necessary to determine their overall value in patients with mTBI.
Supplementary Material
Funding
This project was supported by the National Heart, Lungs, and Blood Institute Grant #T32HL116249. Additional support from the National Institute of General Medical Sciences of the NIH through grant (COBRE) #P20GM103468 Flow Cytometry Core, National Center for Advancing Translational Sciences of the NIH grant #5UH3TROOO880–05 and institutional support through the Division of Hematology/oncology, Rhode Island Hospital Providence RI.
Footnotes
Conflicts of Interest
All authors have no conflicts of interest to report.
Contributor Information
Yan Cheng, Department of Medicine Division of Hematology/Oncology, Rhode Island Hospital, Providence, Rhode Island. 401-444-2480, ycheng@lifespan.org.
Mandy Pereira, Department of Medicine Division of Hematology/Oncology, Rhode Island Hospital, Providence, Rhode Island., 401-444-2480, Mpereira7@lifespan.org.
Neha Raukar, Department of Emergency Medicine, Rhode Island Hospital, Providence, Rhode Island.,Director, Division of Sports Medicine, Associate Professor, Emergency Medicine, The Warren Alpert Medical School of Brown University, Providence, Rhode Island, 401-854-2504, nraukar@gmail.com.
John L. Reagan, Department of Medicine Division of Hematology/Oncology, Rhode Island Hospital, Providence, Rhode Island., 401-444-5435, jreagan@lifespan.org
Mathew Queseneberry, Department of Medicine Division of Hematology/Oncology, Rhode Island Hospital, Providence, Rhode Island., 401-444-5435, mquesenberry@lifespan.org.
Laura Goldberg, Department of Medicine Division of Hematology/Oncology, Rhode Island Hospital, Providence, Rhode Island. 401-444-5435, lgoldberg@lifespan.org.
Theodor Borgovan, Department of Medicine, Division of Hematology/Oncology, Rhode Island Hospital/The Miriam Hospital, Providence, Rhode Island, 401-444-2480, Theodor.Borgovan@lifespan.org.
W Curt LaFrance, Jr, Depts of Psychiatry and Neurology, Brown University, Rhode Island Hospital, Providence, Rhode Island, Director of Neuropsychiatry and Behavioral Neurology, 401-444-3534, william_lafrance_jr@brown.edu.
Mark Dooner, Department of Medicine Division of Hematology/Oncology, Rhode Island Hospital, Providence Rhode Island, 401-444-2463, mdooner@lifespan.org.
Maria Deregibus, Department of Medical Sciences, University of Turin, Italy, Corso Dogliotti 1410126 Torino, Tel: +390116709588, mariachiara.deregibus@unito.it.
Giovanni Camussi, Department of Medical Sciences, University of Turin, Italy, Corso Dogliotti 1410126 Torino, Tel: +390116709588, giovanni.camussi@unito.it.
Bharat Ramratnam, Department of Medicine Division of Infectious Diseases, Rhode Island Hospital, Providence, Rhode Island. Chief Science Officer, Lifespan, and Medical Director, Lifespan Clinical Research Center Associate Professor of Medicine, Warren Alpert Medical School, Brown University, 401-444-5219, bramratnam@lifespan.org.
Peter Quesenberry, Department of Medicine Division of Hematology/Oncology, Rhode Island Hospital, Providence Rhode Island, 401-444-2464, pquesenberry@lifespan.org.
References
- Asken BM, Sullan MJ, DeKosky ST, Jaffee MS, Bauer RM. Research Gaps and Controversies in Chronic Traumatic Encephalopathy A Review. JAMA Neurol. 2017;74(10):1255–1262. [DOI] [PubMed] [Google Scholar]
- Becker RE, Kapogiannis D, Greig NH. Does traumatic brain injury hold the key to the Alzheimer’s disease puzzle? Alzheimers Dement 2018; 14:431–443. [DOI] [PMC free article] [PubMed] [Google Scholar]
- Dash PK, Zhao J, Hergenroeder G, Moore AN. Biomarkers for the diagnosis, prognosis, and evaluation of treatment efficacy for traumatic brain injury. Neurotherapeutics 2010; 7: 100–114. [DOI] [PMC free article] [PubMed] [Google Scholar]
- Dekker SE, Bambakidis T, Sillesen M, Liu B, Johnson CN, Jin G, Li Y, Alam HB. Effect of pharmacologic resuscitation on the brain gene expression profiles in a swine model of traumatic brain injury and hemorrhage. Journal of Trauma and Acute Care Surgery. 2014. December 1;77(6):906–12. [DOI] [PubMed] [Google Scholar]
- Gavett BE, Cantu RC, Shenton M, Lin AP, Nowinski CJ, McKee AC, Stern RA. Clinical appraisal of chronic traumatic encephalopathy: current perspectives and future directions. Curr Opin Neurol 2011; 24: 525–531. [DOI] [PubMed] [Google Scholar]
- Gavett BE, Stern RA, Cantu RC, Nowinski CJ, McKee AC. Mild traumatic brain injury: a risk factor for neurodegeneration. Alzheimer’s research & therapy. 2010. June;2(3):18. [DOI] [PMC free article] [PubMed] [Google Scholar]
- Goetzl EJ, Mustapic M, Kapogiannis D, Eitan E, Lobach IV, Goetzl L, Schwartz JB, Miller BL. Cargo proteins of plasma astrocyte-derived exosomes in Alzheimer’s disease. The FASEB Journal. 2016. August 10;30(11):3853–3859. [DOI] [PMC free article] [PubMed] [Google Scholar]
- Gonzales PA, Pisitkun T, Hoffert JD, Tchapyjnikov D, Star RA, Kleta R, Wang NS, Knepper MA. Large-scale proteomics and phosphoproteomics of urinary exosomes. Journal of the American Society of Nephrology. 2009. February 1;20(2):363–379. [DOI] [PMC free article] [PubMed] [Google Scholar]
- Gonzalez-Begne M, Lu B, Han X, Hagen FK, Hand AR, Melvin JE, Yates JR. Proteomic analysis of human parotid gland exosomes by multidimensional protein identification technology (MudPIT). J Proteome Res 2009; 8:1304–1314. [DOI] [PMC free article] [PubMed] [Google Scholar]
- Grinberg LT, Anghinah R, Nascimento CF, Amaro E, Leite RP, Martin Mda G, Naslavsky MS, Takada LT, Filho WJ, Pasqualucci CA, Nitrini R. Chronic Traumatic Encephalopathy Presenting as Alzheimer’s Disease in a Retired Soccer Player. J Alzheimers Dis 2016; 54:169–174. [DOI] [PMC free article] [PubMed] [Google Scholar]
- Heneka MT, Carson MJ, El Khoury J, Landreth GE, Brosseron F, Feinstein DL, Jacobs AH, Wyss-Coray T, Vitorica J, Ransohoff RM, Herrup K. Neuroinflammation in Alzheimer’s disease. The Lancet Neurology. 2015. April 1;14(4):388–405. [DOI] [PMC free article] [PubMed] [Google Scholar]
- Hu YS, Xin J, Hu Y, Zhang L, Wang J. Analyzing the genes related to Alzheimer’s disease via a network and pathway-based approach. Alzheimer’s research & therapy. 2017. December;9(1):29. [DOI] [PMC free article] [PubMed] [Google Scholar]
- Hu S, Arellano M, Boontheung P, Wang J, Zhou H, Jiang J, Elashoff D, Wei R, Loo JA, Wong DT. Salivary proteomics for oral cancer biomarker discovery. Clinical Cancer Research. 2008. October 1;14(19):6246–52. [DOI] [PMC free article] [PubMed] [Google Scholar]
- Johnson VE, Stewart W, Smith DH. Traumatic brain injury and amyloid-β pathology: a link to Alzheimer’s disease?. Nature Reviews Neuroscience. 2010. May;11(5):361. [DOI] [PMC free article] [PubMed] [Google Scholar]
- Jordan BD. Chronic traumatic brain injury associated with boxing. Semin Neurol 2000; 20:179–185. [DOI] [PubMed] [Google Scholar]
- Julien J, Joubert S, Ferland MC, Frenette LC, Boudreau-Duhaime MM, Malo-Véronneau L, De Guise E. Association of traumatic brain injury and Alzheimer disease onset: a systematic review. Annals of physical and rehabilitation medicine. 2017. September 1;60(5):347–56. [DOI] [PubMed] [Google Scholar]
- Kapsogeorgou EK, Abu-Helu RF, Moutsopoulos HM, Manoussakis MN. Salivary gland epithelial cell exosomes: A source of autoantigenic ribonucleoproteins. Arthritis Rheum 2005; 52:1517–1521. [DOI] [PubMed] [Google Scholar]
- Kochanek PM, Berger RP, Bayir H, Wagner AK, Jenkins LW, Clark RS. Biomarkers of primary and evolving damage in traumatic and ischemic brain injury: diagnosis, prognosis, probing mechanisms, and therapeutic decision making. Curr Opin Crit Care 2008; 14: 135–141. [DOI] [PubMed] [Google Scholar]
- Lakkaraju A, & Rodriguez-Boulan E. Itinerant exosomes: emerging roles in cell and tissue polarity. Trends Cell Biol 2008; 18:199–209. [DOI] [PMC free article] [PubMed] [Google Scholar]
- Lau CS & Wong DT. Breast cancer exosome-like microvesicles and salivary gland cells interplay alters salivary gland cell-derived exosome-like microvesicles in vitro. PLoS One 2012; 7: e33037. [DOI] [PMC free article] [PubMed] [Google Scholar]
- McKee AC, Cantu RC, Nowinski CJ, Hedley-Whyte ET, Gavett BE, Budson AE, Santini VE, Lee HS, Kubilus CA, Stern RA. Chronic traumatic encephalopathy in athletes: progressive tauopathy after repetitive head injury. Journal of Neuropathology & Experimental Neurology. 2009. July 1;68(7):709–35. [DOI] [PMC free article] [PubMed] [Google Scholar]
- Mendez MF, Paholpak P, Lin A, Zhang JY, Teng E. Prevalence of Traumatic Brain Injury in Early Versus Late-Onset Alzheimer’s Disease. J Alzheimers Dis 2015; 47: 985–993. [DOI] [PMC free article] [PubMed] [Google Scholar]
- Mendez MF. The neuropsychiatric aspects of boxing. Int J Psychiatry Med 1995; 25:249–262. [DOI] [PubMed] [Google Scholar]
- Mez J, Daneshvar DH, Kiernan PT, Abdolmohammadi B, Alvarez VE, Huber BR, Alosco ML, Solomon TM, Nowinski CJ, McHale L, Cormier KA. Clinicopathological evaluation of chronic traumatic encephalopathy in players of American football. Jama. 2017. July 25;318(4):360–70. [DOI] [PMC free article] [PubMed] [Google Scholar]
- Michael A, Bajracharya SD, Yuen PS, Zhou H, Star RA, Illei GG, Alevizos I. Exosomes from human saliva as a source of microRNA biomarkers. Oral diseases. 2010. January;16(1):34–8. [DOI] [PMC free article] [PubMed] [Google Scholar]
- Mitchell PJ, Welton J, Staffurth J, Mason MD, Tabi Z, Clayton A. Can urinary exosomes act as treatment response markers in prostate cancer?. Journal of translational medicine. 2009. December;7(1):4. [DOI] [PMC free article] [PubMed] [Google Scholar]
- Navazesh M Methods for collecting saliva. Ann N Y Acad Sci 1993: 694: 72–77. [DOI] [PubMed] [Google Scholar]
- Papa L, Brophy GM, Welch RD, Lewis LM, Braga CF, Tan CN, Ameli NJ, Lopez MA, Haeussler CA, Giordano DI, Silvestri S. Time course and diagnostic accuracy of glial and neuronal blood biomarkers GFAP and UCH-L1 in a large cohort of trauma patients with and without mild traumatic brain injury. JAMA neurology. 2016. May 1;73(5):551–60. [DOI] [PMC free article] [PubMed] [Google Scholar]
- Papa L, Edwards D, Ramia M. Exploring Serum Biomarkers for Mild Traumatic Brain Injury In Kobeissy FH, editors. Brain Neurotrauma: Molecular, Neuropsychological, and Rehabilitation Aspects. Frontiers in Neuroengineering. CRC Press/Taylor & Francis; 2015. Chapter 22. [PubMed] [Google Scholar]
- Prins M, Greco T, Alexander D, Giza CC. The pathophysiology of traumatic brain injury at a glance. Disease models & mechanisms. 2013. November 1;6(6):1307–15. [DOI] [PMC free article] [PubMed] [Google Scholar]
- Quesenberry PJ, Aliotta J, Deregibus MC, Camussi G. Role of extracellular RNA-carrying vesicles in cell differentiation and reprogramming. Stem Cell Res Ther 2015; 6:153. [DOI] [PMC free article] [PubMed] [Google Scholar]
- Raghupathi R Cell death mechanisms following traumatic brain injury. Brain pathology. 2004. April;14(2):215–22. [DOI] [PMC free article] [PubMed] [Google Scholar]
- Ramos-Cejudo J, Wisniewski T, Marmar C, Zetterberg H, Blennow K, de Leon MJ, Fossati S. Traumatic Brain Injury and Alzheimer’s Disease: The Cerebrovascular Link. EBioMedicine. 2018. January 31. [DOI] [PMC free article] [PubMed] [Google Scholar]
- Roberts GW, Allsop D, Bruton C. The occult aftermath of boxing. J Neurol Neurosurg Psychiatry 1990; 53: 373–378. [DOI] [PMC free article] [PubMed] [Google Scholar]
- Rogg J, Spader HE, Wilcox BJ, Ellermeier A, Correia ST, Chodobski AD, Lafrance W Jr. The Brown University Traumatic Brain Injury Research Consortium and the Norman Prince Neurosciences Institute. Rhode Island Medical Journal. 2014. May 1;96(3):22–6. [PubMed] [Google Scholar]
- Saatman KE, Creed J, Raghupathi R. Calpain as a therapeutic target in traumatic brain injury. Neurotherapeutics. 2010. January 1;7(1):31–42. [DOI] [PMC free article] [PubMed] [Google Scholar]
- Sivanandam TM, Thakur MK. Traumatic brain injury: a risk factor for Alzheimer’s disease. Neurosci Biobehav Rev 2012; 36:1376–1381. [DOI] [PubMed] [Google Scholar]
- Schneider R, McKeever P, Kim T, Graff C, van Swieten JC, Karydas A, Boxer A, Rosen H, Miller BL, Laforce R Jr, Galimberti D. Downregulation of exosomal miR-204–5p and miR-632 as a biomarker for FTD: a GENFI study. J Neurol Neurosurg Psychiatry. 2018. February 6:jnnp-2017. [DOI] [PMC free article] [PubMed] [Google Scholar]
- Skog J, Wurdinger T, van Rijn S, Meijer D, Gainche L, Sena-Esteves M, Curry WT Jr, Carter BS, Krichevsky AM, Breakfield XO. Glioblastoma microvesicles transport RNA and proteins that promote tumour growth and provide diagnostic biomarkers. Nat Cell Biol 2008; 10:1470–1476. [DOI] [PMC free article] [PubMed] [Google Scholar]
- Svetlov SI, Larner SF, Kirk DR, Atkinson J, Hayes RL, Wang KK. Biomarkers of blast-induced neurotrauma: profiling molecular and cellular mechanisms of blast brain injury. J Neurotrauma 2009; 26: 913–921. [DOI] [PMC free article] [PubMed] [Google Scholar]
- Tan X, Chen Y, Li J, Li X, Miao Z, Xin N, Zhu J, Ge W, Feng Y, Xu X. The inhibition of Cdk5 activity after hypoxia/ischemia injury reduces infarct size and promotes functional recovery in neonatal rats. Neuroscience. 2015. April 2;290:552–560. [DOI] [PubMed] [Google Scholar]
- Tang H, Wu Z, Zhang J, Su B. Salivary lncRNA as a potential marker for oral squamous cell carcinoma diagnosis. Mol Med Rep 2013; 7:761–766. [DOI] [PubMed] [Google Scholar]
- Taylor CA, Greenspan AI, Xu L, Kresnow MJ. Comparability of national estimates for traumatic brain injury-related medical encounters. J Head Trauma Rehabil 2015; 30: 150–159. [DOI] [PMC free article] [PubMed] [Google Scholar]
- Tokuda T, Ikeda S, Yanagisawa N, Ihara Y, Glenner GG. Re-examination of ex-boxers’ brains using immunohistochemistry with antibodies to amyloid beta-protein and tau protein. Acta Neuropathol 1991; 82: 280–285. [DOI] [PubMed] [Google Scholar]
- Valadi H, Ekstrӧm K, Bossios A, Sjӧstrand M, Lee JJ, Lӧtvall JO. Exosome-mediated transfer of mRNAs and microRNAs is a novel mechanism of genetic exchange between cells. Nat Cell Biol 2007; 9:654–659. [DOI] [PubMed] [Google Scholar]
- White TE, Surles-Zeigler MC, Ford GD, Gates AS, Davids B, Distel T, LaPlaca MC, Ford BD. Bilateral gene interaction hierarchy analysis of the cell death gene response emphasizes the significance of cell cycle genes following unilateral traumatic brain injury. BMC genomics. 2016. December;17(1):130. [DOI] [PMC free article] [PubMed] [Google Scholar]
- Yokobori S, Hosein K, Burks S, Sharma I, Gajavelli S, Bullock R. Biomarkers for the clinical differential diagnosis in traumatic brain injury--a systematic review. CNS Neurosci Ther 2013; 19: 556–565. [DOI] [PMC free article] [PubMed] [Google Scholar]
- Yousuf MA, Tan C, Torres‐Altoro MI, Lu FM, Plautz E, Zhang S, Takahashi M, Hernandez A, Kernie SG, Plattner F, Bibb JA. Involvement of aberrant cyclin‐dependent kinase 5/p25 activity in experimental traumatic brain injury. Journal of neurochemistry. 2016. July;138(2):317–27. [DOI] [PMC free article] [PubMed] [Google Scholar]
- Zetterberg H, Smith DH, Blennow K. Biomarkers of mild traumatic brain injury in cerebrospinal fluid and blood. Nat Rev Neurol 2013; 9:201–210. [DOI] [PMC free article] [PubMed] [Google Scholar]
- Zhong L, Taylor DL, Whittington RJ. Proteomic profiling of ovine serum by SELDI-TOF MS: optimisation, reproducibility and feasibility of biomarker discovery using routinely collected samples. Comp Immunol Microbiol Infect Dis 2010; 33:47–63. [DOI] [PubMed] [Google Scholar]
Associated Data
This section collects any data citations, data availability statements, or supplementary materials included in this article.