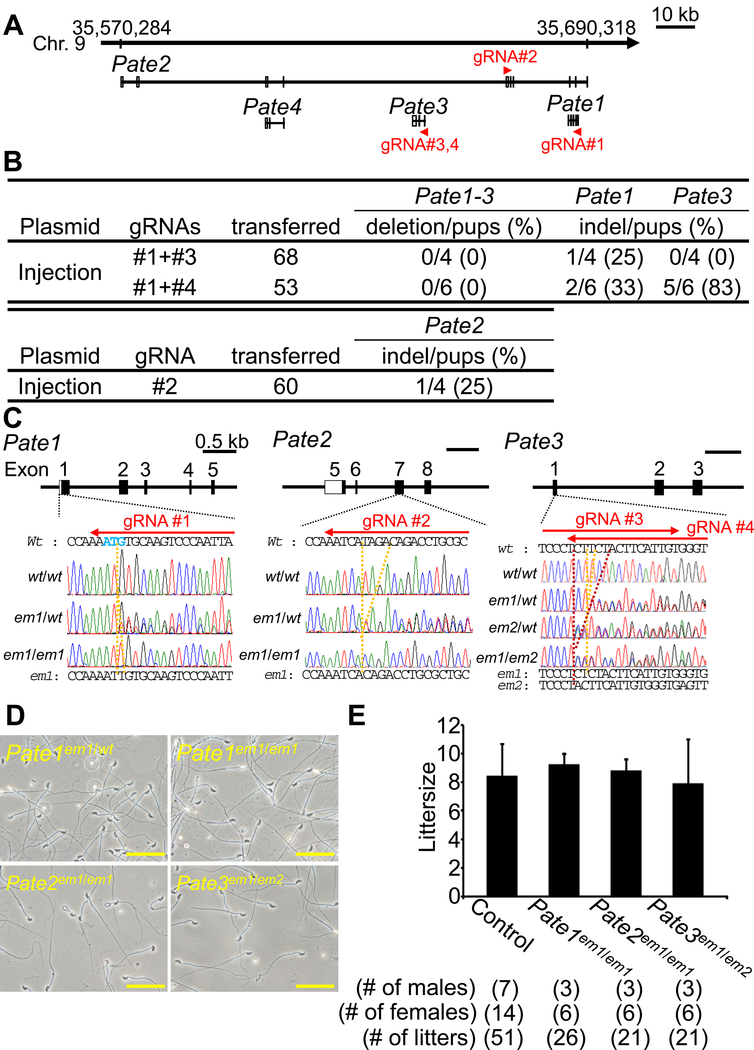
Figure 2. Fecundity of KO males of Pate family genes.
(A) Pate family genes within murine genomic locus |chromosome 9qA4|. (B) Genome editing efficiency of injecting gRNA/Cas9 expressing plasmids into eggs. (C) DNA sequencing of KO mice of Pate family genes. Enzyme mutation (em) 1 for Pate1: 1 base “T” insertion; em1 for Pate2: 4 base “TAGA” deletion; em1 and em2 for Pate3: 1 base “T” and 5 base “CTTCT” deletion. Black boxes: coding region, Blue colored letters: initial methionine. (D) Sperm morphology observed under phase contrast. (E) Male fecundity. There was no difference in average litter size between control and KO males of each gene (Pate1: p = 0.57, Pate2: p = 0.80, Pate3: p = 0.76). Heterozygous males of each gene were used as controls.

