Abstract
Purpose:
Total variation (TV) regularization is efficient in suppressing noise, but is known to suffer from staircase artifacts. The goal of this work was to develop a regularization method using the infimal convolution of the first- and the second-order derivatives to reduce or even prevent staircase artifacts in the reconstructed images, and to investigate if the advantage in noise suppression by this TV-type regularization can be translated into dose reduction.
Methods:
In the present work, we introduce the infimal convolution of the first- and the second-order total variation (ICTV) as the regularization term in penalized maximum likelihood reconstruction. The preconditioned alternating projection algorithm (PAPA), previously developed by the authors of this article, was employed to produce the reconstruction. Using Monte Carlo-simulated data, we evaluate noise properties and lesion detectability in the reconstructed images and compare the results with conventional total variation (TV) and clinical EM-based methods with Gaussian post filter (GPF-EM). We also evaluate the quality of ICTV regularized images obtained for lower photon number data, compared with clinically used photon number, to verify the feasibility of radiation-dose reduction to patients by use of the ICTV reconstruction method.
Results:
By comparison with GPF-EM reconstructed images, we have found that the ICTV-PAPA method can achieve a lower background variability level while maintaining the same level of contrast. Images reconstructed by the ICTV-PAPA method with 80,000 counts per view exhibit even higher channelized Hotelling observer (CHO) signal-to-noise ratio (SNR), as compared to images reconstructed by the GPF-EM method with 120,000 counts per view.
Conclusions:
In contrast to the TV-PAPA method, the ICTV-PAPA reconstruction method avoids substantial staircase artifacts, while producing reconstructed images with higher CHO SNR and comparable local spatial resolution. Simulation studies indicate that a 33% dose reduction is feasible by switching to the ICTV-PAPA method, compared with the GPF-EM clinical standard.
Keywords: fixed-point proximity methods, infimal convolution, noise suppression, penalized maximum likelihood optimization total variation regularization, SPECT reconstruction, staircase artifact
1. INTRODUCTION
Tomographic reconstruction of medical images in emission computed tomography (ECT), typically performed in a discrete domain, can be characterized as an ill-posed inverse problem.1 Solutions for such problems have been successfully implemented by creation of approximate mathematical models of ECT imaging systems (system matrices), and by application of variational methods combined with efficacious minimization algorithms. Of special interest is the Bayesian approach based on statistical considerations. It relies on the maximization of a posteriori probability (MAP) of a solution using the negative log likelihood of the objective function and a priori knowledge about the solution. Using the concept of Gibbs a priori distribution,2 the reconstruction problem can thus be approached as a convex optimization problem consisting of three terms.3 The first two terms, collectively known as the fidelity term, evaluate and penalize the mismatch between expected and observed data (i.e., assess goodness-of-fit), while the last term, known as the regularization term, penalizes low a priori probability solutions. The balance between these two terms is determined by a regularization parameter.
The regularization term needs to reflect statistical properties of a priori distribution of the unobserved radiotracer activity f and should allow preservation of image details including sharp edges while suppressing image noise. One of the most popular candidates is total variation (TV), introduced by Rudin, Osher, and Fatemi in 1992.4
The TV regularization was introduced to SPECT reconstruction by Panin et al.5 and became increasingly popular because of its capability of preserving the original objects. However, since it considers only the first derivatives, it tends to create artificial piecewise constant blocky regions with spurious sharp edges called staircase artifacts even if the original image contains only smooth gradients of gray values representing ECT activity distribution. In order to reduce staircase artifacts while retaining the edge-preservation property of TV, modifications of TV using l1 norm of high-order gradients have been proposed in the context of image denoising and restoration, including direct addition of a higher order derivative term (HOTV),6 infimal convolution of the first- and second-order TV terms (ICTV),7,8 and total generalized variation (TGV).9
We have introduced a proximity operator-based fixed-point algorithm — the preconditioned alternating projection algorithm (PAPA)10 — that rigorously treats non-differentiable TV regularization; and we have implemented this algorithm for SPECT reconstruction with high-order TV (HOTV) regularization aiming at reduction or elimination of staircase arti-facts.11 Even though this attempt was successful, we have continued seeking better TV-based regularization and, accordingly, have implemented infimal convolution of the first- and second-order TV (ICTV) as a penalty term for PAPA. Here we investigate the quality of SPECT images reconstructed using the ICTV-PAPA method and compare it with the quality of images reconstructed with TV-PAPA method and the conventional EM algorithm with Gaussian post filter (GPF). In our previous publications,12,13 we developed a new blockwise explicit fixed-point proximity algorithm, instead of PAPA, to solve a class of three-termed convex optimization problems. The SPECT reconstruction problem with ICTV penalty term can be categorized into this class of problems. In particular, our previous work directly replaced the TV term in the SPECT reconstruction model proposed in Ref. [10] with the ICTV penalty term, and thus imposed a non-negativity constraint on the sum of the involved image components. Moreover, in the aspects of image quality assessment, our previous study solely investigated the ability of the ICTV regularization in curing the staircase artifacts. In the current work, we require both image components to be non-negative, for the two components represent image regions of different smoothness and the radioactivity distribution is non-negative in the whole image domain. This yields a more reasonable SPECT reconstruction model than that in our previous work. In addition, we perform simulation studies to compare all aspects of the reconstructed images and investigate the feasibility of radiation-dose reduction to patients by use of the ICTV-PAPA method.
2. PENALIZED LIKELIHOOD RECONSTRUCTION WITH THE PRECONDITIONED ALTERNATING PROJECTION ALGORITHM
2.A. Penalized likelihood optimization model
In a SPECT system, the detection of gamma photons by a detector element is a random process following Poisson distribution (assuming detector dead time can be neglected) with its expected value determined by the radioactivity distribution inside the patient body, the photon attenuation along the propagation path, and the sensitivity of the detector. Therefore, the detected counts at m detector elements, denoted by a vector g ∈ Rm, and the expected activity distribution in d volume elements (voxels) of the reconstruction space, denoted by a vector f ∈ Rd, can be modeled as:
| (1) |
where A ∈ Rm × d is the system matrix and γ ∈ Rm is the vector of background counts originating from the background activity (e.g., scattered photons coming from outside the field of view of the gamma camera or from room radioactive background). We assume that f and γ are both vectors of expectation values of independent Poisson distributed random variables and that γ can be experimentally estimated in the absence of patient in the scanner field of view.
Each entry on the nth column of matrix A represents the expected number of photon counts detected by the corresponding detector element when a point source with unit activity is placed within voxel n, assuming fixed exposure time. The system matrix is determined by the gamma camera system geometry, the patient anatomy and physiology and the involved radioisotope. Specifically, attenuation coefficients depend on the patient’s tissue composition and the energy of the gamma and/or x-ray photons used for imaging. The sensitivity of detector elements to a certain voxel depends on the radiological depth, which is directly correlated with patient anatomy. Applying the notation used in our previous work,10 the penalized likelihood optimization model for SPECT reconstruction (1) can be written as:
| (2) |
In Eq. (2), notation denotes the inner product in the Euclidean space, and 1 is an m-dimensional vector with all its elements equal to 1. The Kullback-Leibler (KL) data divergence denoted by F in subsequent sections, measures the discrepancy between the estimated and the observed data. It is derived from the negative logarithm of the Poisson probability density function. Please refer to Ref. [10] for its detailed derivation. The penalty term (regularization term) λU is introduced to enforce desired smoothness on the estimate. Here, λ is a positive penalty weight, and its practical selection is often based on qualitative evaluation of reconstructed images.
2.B. Total variation-based penalty term
In SPECT reconstruction, we frequently use the isotropic definition of TV regularization. For a 3D image f of size p × p × q, we have the following discretized representation of isotropic total variation (ITV):
| (3) |
In the above definition, we apply the symmetric boundary condition to extend the voxels, meaning that the extended voxels are equal to their symmetric voxels along the image boundaries. For example, we set For simplified presentation of the algorithm, we next introduce a first-order derivative matrix acting on the 3D image and formulate the ITV penalty term as a composition with φ being a convex non-negative function and B being a matrix. In particular, the α × α difference matrix Dα that calculates the discrete first-order derivative of a 1D signal is defined as:
| (4) |
Using the Kronecker tensor product (represented by symbol ⊗), we define the first-order derivative matrix acting on a column-wise vectorized 3D image as:
| (5) |
where In is the n × n identity matrix. The ITV penalty term (3) can then be rewritten as:
| (6) |
where d = p × p × q is the number of voxels in the reconstruction space, and is the d-sum of isotropic vector norms, which is a convex function defined on R3d.
Further, the second-order partial derivative matrices can be similarly defined as
| (7) |
We then stack the above matrices together and propose the following complete second-order derivative matrix:
| (8) |
Here denotes the transpose of the matrix Dxx. By defining a convex function we can calculate the second-order TV penalty term as composition
Next, we present the definition of infimal convolution. For proper, convex functions their infimal convolution is the function ψ defined by
If (a) the are also lower semicontinuous; (b) one of the ψi is coercive and the others are all bounded below, then ψ is proper, convex and lower semicontinuous, and the infimum in the definition of ψ(f) is attained for any f ∈ Rn. In this case, the infimum operation can be replaced by the minimization operation. We remark that the first- and second-order TV are both proper, convex, continuous functions that are coercive and bounded below by 0. Hence, with the above definition and properties of infimal convolution, the ICTV function is also proper, convex and lower semicontinuous, which is well-defined by
| (9) |
In Eq. (9), the first term has a small value if component f1 is piecewise constant, while the second term favors a piecewise linearly varying component f2. Thus, f1 has the appearance of TV-regularized reconstructed images, with sharp edges and piecewise constant regions, while f2 resembles HOTV reconstructed features, with smoother radioactivity distribution. Accordingly, the infimal convolution-regularized SPECT reconstruction problem amounts to a two-variable optimization problem. Moreover, the two variables f1 and f2 represent image regions of different smoothness, and thus should both be non-negative.
The main justification for ICTV functional as a penalty term used in SPECT reconstruction is its adaptiveness. Instead of enforcing a single penalty criterion, e.g., ITV penalty, on the whole image f, only part of f that has piecewise constant regions with sharp edges is penalized by the ITV penalty term. Part of the image with smooth distribution is more likely to be penalized by the second-order TV. The decomposition of radioactivity distribution estimate f into components f1 and f2 is determined adaptively. ICTV can preserve both smooth and piecewise constant features of an image. On the other hand, the ITV penalty term tends to reconstruct smooth regions as a collection of piecewise constant regions. This phenomenon, known as staircase artifacts, may limit clinical use of the ITV regularization. In sum, the ICTV regularization is more suitable for images consisting of regions with very different characteristics, e.g., some parts of the image are very smooth while some other parts have piecewise constant features, as compared to the ITV regularization only. Moreover, as per discussed above, the ICTV function is convex, so the existence of solutions of the model (2) is guaranteed. In the present study, for the purpose of simplifying the evaluation process, we fixed the ratio of λ1 to λ2 to be 1, i.e., λ1/λ2 = 1, in the ICTV penalty term (9). We leave the rigorous discussion of parameter variation between λ1 and λ2 to future study.
2.C. Preconditioned alternating projection algorithm
The TV regularization was first introduced to the field of SPECT reconstruction by Panin et al.5 in the framework of the one-step-late algorithm.14 In their approach, the non-differentiability of TV was dealt with by using its smooth approximation via the introduction of an ad hoc parameter.5 However, such an approximation of TV by differentiable function may lead to a loss of image resolution and contrast, as well as the instability in solutions.10 In contrast, our proposed preconditioned alternating projection algorithm (PAPA)10 rigorously tackles the issue of non-differentiability, avoids any ad hoc smoothing parameters, and provides a robust efficient iterative scheme for solving model (2) with penalty term in the form of Here, φ is a convex non-negative function, and B is a matrix.
Preconditioned alternating projection algorithm has been successfully applied to TV10 and HOTV11 regularization problems. Since ICTV can be formulated as a composition (Table I), the proposed algorithm can also be used to efficiently solve the ICTV regularization problem. In particular, we set and define a differentiable function Recalling the definition of F, we have . With the above preparation, we propose an iterative scheme for penalized likelihood SPECT reconstruction with ICTV penalty term:
| (10) |
TABLE I.
Representation of TV and ICTV penalty terms as the composition of a convex function φ and a matrix B.
| Penalty term | Convex function φ | Matrix B | Expected image f |
|---|---|---|---|
| TV | φ1 | B1 | f |
| ICTV | λ1φ1 + λ2φ2 |
In scheme (10), b ∈ R12d is the dual variable; S is a 2d × 2d diagonal positive-definite preconditioning matrix that accelerates the resultant algorithm and is a 12d × 12d diagonal matrix with positive parameters μ1, μ2. Motivated by the original PAPA, we choose the preconditioning matrix as the diagonal matrix at the kth iteration, where The reconstructed image at each iteration is then given by
Implementation of (10) also requires the closed forms of P+ and The operator P+ is a projection operator onto the closed set Indeed, for we have Furthermore, recalling the definition of convex function φ in Table I, we know that for ICTV regularization, where denote, respectively, the 1/4 upper and 3/4 lower elements of the vector We can see that the function φ is separable with respect to its two variables z1 and z2. Hence, according to our previous work,12 the proximity operator of φ has the following block form:
| (11) |
In this case, the calculation of the proximity operator of φ amounts to the calculation of and Recalling Example 2.5 in Micchelli et al.,15 we can compute the elements of a vector by
| (12) |
Here are two 3D vectors. For the calculation of the elements of the vector we only need to replace in Eq. (12) by two 9D vectors respectively, as well as λ1/μ1 by λ2/μ2. The Appendix shows detailed pseudo-code of PAPA designated for the ICTV regularization problem.
The most time-consuming parts of iterative SPECT reconstruction are the forward and backward projections (i.e., multiplying system matrices A and AT). All other calculations involved are inexpensive in comparison. For all reconstruction methods considered in the current work, their convergence rates are comparable, so the numbers of forward and backward projections needed are similar. Hence, the computational times for all the competing methods are very similar.
We remark that the popular alternating direction method of multipliers (ADMM) can also solve the underlying optimization problem, which has a compact form of with a Lipschitz differentiable function F. When applying standard ADMM to this problem, it requires an evaluation of the proximity operators of which is complicated by the presence of matrices A and B, especially when these matrices are high dimensional and without simple structure.
On the other hand, PAPA is developed based on a fixed-point characterization of the solution of the underlying convex optimization problem. Because of this, PAPA provides four interesting and useful features. First, it allows us to deal with the functions involved in the optimization problem either through their proximity operators or through their gradients. In fact, for non-differentiable functions, the proximity operator can be a very powerful tool, however, for smooth functions, the gradient may be easier to implement. Second, PAPA does not require matrix inversion, which is an advantage when solving large-scale reconstruction problems where matrix inversion can be quite expensive. Third, PAPA introduces only one dual variable (12 times the image size), which is the minimum storage necessary for solving the above non-differentiable problem. Finally, through the preconditioning technique, PAPA suggests the search for the solution to follow the direction of the search in the classical EM algorithm and thus speeds up the original convergence.
3. METHODS
3.A. Experimental Design
3.A.1. Phantom simulations
To quantify the performance of the reconstruction methods, we conducted numerical experiments with Monte Carlo-simulated data. Two numerical voxelized phantoms were created: a reference cylinder with lumpy background [warm Gaussian blobs, Fig. 1(d)–1(f)] and targets absent; and a cylinder with identical background with targets present: a set of hot Gaussian blobs [Fig. 1(c)], a set of point sources [Fig. 1(b)], and a set of piecewise constant cold spheres [Fig. 1(a)], respectively. Both phantoms were of the size 128 × 128 × 128 voxels, with voxel size set to 2.2 × 2.2 × 2.2 mm3. The six Gaussian blobs had the same maximum-activity-to-mean-background ratio of 3:1 with radii (FWHM) of 4, 5, 6, 7, 8, and 9 mm.
FIG. 1.
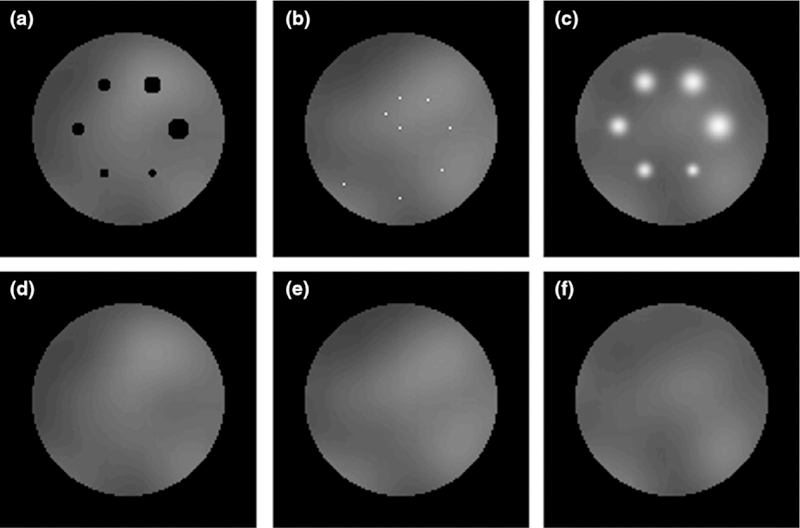
Transaxial cross-sections of a phantom with: (a) six cold (no activity) piecewise constant spheres with radii of 4, 5, 6, 7, 8, and 9 mm, (b) eight point sources with maximum-activity-to-mean-background ratio of 100:1 at different radial distances from the central axis of the phantom, (c) six hot Gaussian blobs with radii (FWHM) of 4, 5, 6, 7, 8, and 9 mm with maximum-activity-to-mean-background ratio of 3:1 and (d–f) reference phantom containing warm Gaussian blobs only. Both phantoms were of the size 128 × 128 × 128 voxels, with voxel size set to 2.2 × 2.2 × 2.2 mm3.
Projection data were simulated using the SIMIND Monte Carlo simulation package.16 Up to fourth-order scatter photons were considered in the simulation. A Siemens e.cam gamma camera with low-energy parallel-hole (LEHR) parallel-beam collimators was simulated. We set the detector element size to 2.2 × 2.2 mm2 and the active detector size 28.2 × 28.2 cm2. The radius of rotation was set at 13 cm, and 120 projections were simulated for each phantom. The isotope simulated was Tc-99 m. The main energy window and scatter energy window were set at 127–155 keV and 123–127 keV, respectively. A total of 3.9 × 10⁹ photon histories per view were simulated to create approximately “noise-free” data.
Poisson noise was added to the simulated projection data. Three different scenarios corresponding to 40,000, 80,000, and 120,000 counts per view, respectively, were considered. A hundred noise realizations at each noise level were created for each phantom. Poisson noise was added to photopeak-window data and scatter-window data according to count level. Scatter correction was implemented by adding estimated scatter counts in forward projection during each iteration. Scatter counts were estimated using scatter-window data.17
A wide range of penalty weights have been tested (Section 3). Smoothing parameters were chosen by four radiologists based on lesion detectability by their judgment. The penalty weights chosen in this fashion for the TV-PAPA and ICTV-PAPA methods were λ = 0.15, and λ1 = 0.2, λ2 = 0.2, respectively. The Gaussian post-filter size was selected by radiologists to be FWHM = 7.3 mm.
3.A.2. Patient data
To test the performance of the reconstruction methods in real clinical applications, we reconstructed anonymized patient data. The projection data consisted of 128 projection views in a 128 × 100-dimensional detector matrix with 3.9 × 3.9 mm2 detector element. The imaging was performed on a Siemens e.cam SPECT gamma camera with LEHR collimators. Imaging time was set at 20 s per view. A total number of 2.2 × 10⁸ photons were recorded within the selected (20%) energy window. Reconstruction space voxel size was 3.9 × 3.9 × 3.9 mm3.
3.B. Image quality metrics
3.B.1. Contrast recovery coefficient, spatial variability, and Bias
The contrast recovery coefficient (CRC) is defined as
| (13) |
where represent ensemble averaged values of selected “lesion” and background region, respectively. The ideal CRC value is 1 for both hot and cold lesions. Spatial variability (SV) is defined as the standard deviation of reconstructed activity in the selected background regions averaged over the whole ensemble reconstructions. For cold spheres, spatial variabilities are measured in relative activity units; for hot spheres, spatial variabilities are quantified as the percentages of the mean value (similar to the definition of coefficient of variation). For the phantoms investigated, the lowest values for spatial variabilities were 0.0110 (22.7%) and 0.0087 (17.6%) for cold (hot) lesion and background, respectively. The non-zero lowest values of spatial variability were due to background lumpiness. The CRC vs. background variability curves provide insight into the tradeoff between contrast recovery and image noise for various penalty parameters. Bias is defined as the difference between the reconstructed activity and the true value. Bias describes the reconstruction accuracy in terms of activity estimation.
3.B.2. Local noise power spectrum
The noise power spectrum is an effective method for evaluation of image noise properties. However, noise in SPECT reconstructed images is nonstationary.18 Therefore, we used a relatively small local region-of-interest (ROI) to obtain data on local noise power spectrum (LNPS). It was estimated using the method described in ICRU Report 54.19 We used 100 reconstructed noise realizations to obtain each LNPS.
3.B.3. Local point spread function
Due to nonstationary properties of reconstructed images, we evaluated local point spread function (LPSF) using the approach proposed in Ref. [20]. Point sources were introduced as background perturbations at different radial distances from the phantom’s central axis [Fig. 1(b)]. We reconstructed images for 100 noise realizations for each phantom and obtained average images of the phantom with point sources and of the reference phantom. We then obtained a difference image by subtraction of the latter image from the former. The local PSF vs. radial location was then evaluated using the difference image.
3.B.4. Channelized hotelling observer
The channelized Hotelling observer (CHO) technique21–23 is a well-established method of measuring the task-based performance of imaging systems. By simulating the response of the human visual system at various spatial frequencies, CHO has been shown to correlate well with human observer performance in numerous studies.24–27 CHO with internal observer noise was used to evaluate the performance of our regularization methods. The sparse difference of Gaussian (S-DOG) channels was implemented following Abbey et al28 and applied to our data.
4. RESULTS AND DISCUSSION
4.A. Reconstructed Images
Figure 2 shows images reconstructed for Monte Carlo-simulated SPECT projection data described in Section 3.A. All three algorithms were used to reconstruct the simulated 120,000 counts/view (120 kc/view) SPECT projection data. Additionally, the ICTV-PAPA method was used to reconstruct the simulated 40 and 80 kc/view SPECT projection sets. Figure 3 showcases the flexibility of the proposed methods: Fig. 3(a) shows the f1 component of the reconstruction that has piecewise constant features; Fig. 3(b) shows the f2 component that is smooth; Fig. 3(c) shows the combined final image that has low noise and reduced staircase artifact, compared with TV reconstructed images shown in Fig. 2(d).
FIG. 2.
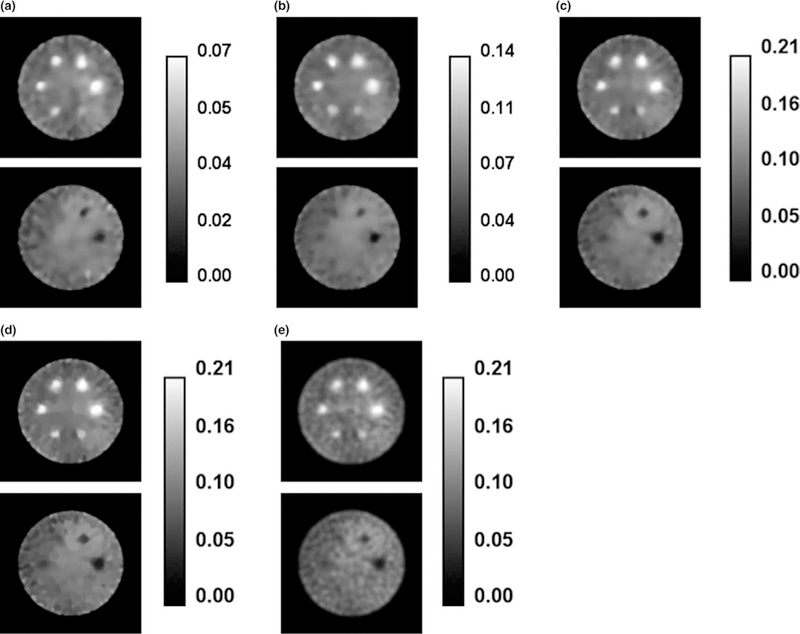
Transaxial cross-sections of images for Monte Carlo-simulated SPECT data for phantom shown in Fig. 1, reconstructed by: (a) the ICTV-PAPA method for 40 kc/view data, λ1 = 0.4, λ2 = 0.4; (b) the ICTV-PAPA method for 80 kc/view data, λ1 = 0.3, λ2 = 0.3; (c) the ICTV-PAPA method for 120 kc/view data, λ1 = 0.2, λ2 = 0.2; (d) the TV-PAPA method for 120 kc/view data, λ = 0.2; and (e) the GPF-MLEM method using 120 kc/view data, FWHM = 7.3 mm. For all images, reconstructions were stopped at 100 iterations. Left column: hot spheres with Gaussian activity distribution (see text). Right column: cold spheres with zero activity.
FIG. 3.
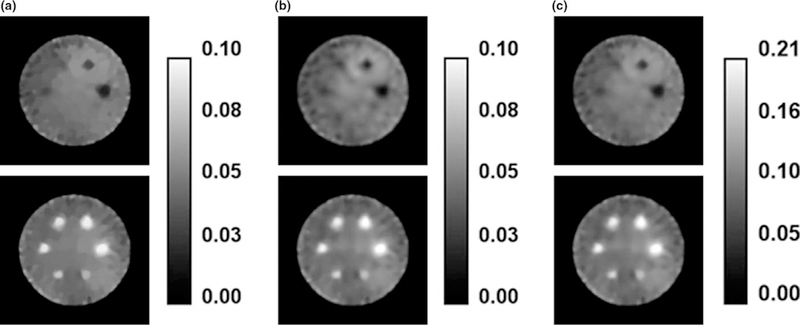
Components of the ICTV-PAPA-reconstructed images obtained at 100 iterations for simulated SPECT data with 120 kc/view, λ1 = 0.2, and λ2 = 0.2: (a) f1 component, (b) f2 component, and (c) final combined image (f = f1 + f2). Top row: cold spheres with zero activity. Bottom row: hot spheres with Gaussian activity distribution (see Fig. 1 and text).
4.B. Contrast recovery coefficient (CRC), background variability and bias
Reconstructions of ten noise realizations for 120 kc/view simulated SPECT data were performed. Six hot-sphere ROIs and four largest cold spheres ROIs were used to estimate mean values of CRC, background variability, and bias (Fig. 4). Each point on the curves was calculated for penalty parameters selected in the 0.01–200 range for TV-based algorithms and Gaussian post-filter radii in the 1.1–7.1 mm range for GPF-EM. Only parameters that resulted in images with more than four visible spheres (hot spheres and cold spheres combined) were selected.
FIG. 4.
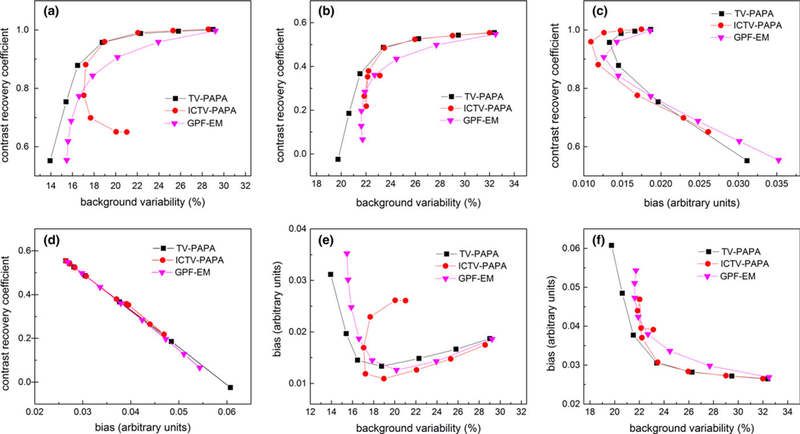
(a) Mean CRC vs. background variability for hot spheres; (b) Mean CRC vs. background variability for cold spheres; (c) Mean CRC vs. bias for hot spheres; (d) Mean CRC vs. bias for cold spheres; (e) Bias vs. background variability for hot spheres; (f) Bias vs. background variability for cold spheres. Each point on the curves was calculated for penalty parameters selected in the 0.01–200 range for TV-based algorithms and Gaussian post-filter radii in the 1.1–7.1 mm range for GPF-EM. Only the four largest spheres were considered among cold spheres. The true background spatial variability for selected ROIs is 17.6% for the background in the cross-section with hot spheres and 22.7% for the cross-section with cold spheres due to the lumpy background.
Analysis of Fig. 4 shows that both TV-based methods out-perform the GPF-EM method in terms of (a) preserving contrast recovery coefficient while reducing the background spatial variability [Fig. 4a and 4(b)], and (b) bias-background variability tradeoff [Fig. 4c and 4(d)]. In Fig. 4(a) and Fig. 4(b), we notice that the TV-PAPA method produces smaller background variability than both ICTV-PAPA and GPF-EM methods for lower contract recovery coefficient reconstructions. However, low background variability no longer correlates with high-quality image reconstructions in that parameter range, because the ground truth background variability is actually higher than the TV-PAPA reconstructed results, and TV-PAPA generates images with substantial piecewise constant artifacts. Figure 4(d) shows that all reconstruction methods produce identical bias-CRC tradeoff, due to the fact that for cold lesions the definitions of these two metrics are the same. When penalty parameters or post-filter sizes are reduced to zero, all methods are equivalent to the MLEM algorithm. Therefore, all curves converge to the same points in the plots.
Note that the images reconstructed by the ICTV-PAPA method exhibit somewhat anomalous behavior for larger penalty parameters. They never reach the background spatial variability below a particular threshold (17% for hot and 21% for cold spheres, respectively), even when a large smoothing parameter is used and the CRC is decreasing. Further, they never cross certain maximum levels of bias (0.027 for hot and 0.048 for cold spheres, respectively). In contrast, CRC (bias) of TV-PAPA and GPF-EM decreases (increases) when the background spatial variability decreases.
4.C. Local noise power spectra
We analyzed LNPS using a small ROI located at the isocenter for simulated SPECT data with 120 kc/view. Examples of Local noise power spectra (LNPS) are shown in Fig. 5. We observe similar “donut” shapes of LNPS for all investigated methods. The donut shape of NPS is typical for reconstructed images in CT and SPECT. Essentially, the donut shape is due to the lack of noise in low spatial frequency and high spatial frequency. NPS was acquired with zero-mean noise images, which are reconstructed images sub-tracted by the ground truth. Therefore, the zero-frequency component is exactly 0. The high spatial frequency component is also small due to the fact that the reconstructed images are relatively smooth. We observe that the corresponding mean and maximum noise power amplitudes are an order of magnitude higher for GPF-MLEM, compared to the TV-based methods (Table II). Furthermore, the ICTV-PAPA method produces lower mean noise power amplitude than TV-PAPA. The full width at half maximum (FWHM) of LNPS for GPF-EM is larger than that for the TV-based methods and does not depend on radial location. Examples of average radial profiles through LNPS are shown in Fig. 6.
FIG. 5.
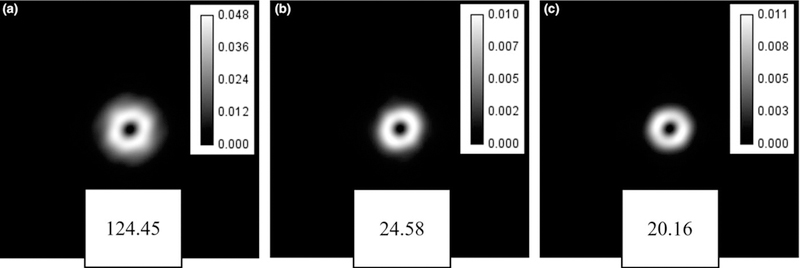
Local noise power spectra (LNPS) obtained for the central location of small ROI: (a) the GPF-EM method; (b) the TV-PAPA method; and (c) the ICTV-PAPA method all obtained for simulated SPECT data with 120 kc/view. Noise variance values of the selected ROI and penalty parameters are displayed at the bottom of each image.
TABLE II.
Mean and maximum amplitudes of LNPS obtained for the simulated SPECT data with 120 kc/view.
| Mean values of LNPS |
Maximum values of LNPS |
FWHM | |
|---|---|---|---|
| GPF-EM | 1.90 × 10⁻³ | 0.0557 at 0.28 cm−1 | 0.48 cm−1 |
| TV-PAPA | 3.75 × 10⁻⁴ | 0.0182 at 0.27 cm−1 | 0.37 cm−1 |
| ICTV-PAPA | 3.07 × 10⁻⁴ | 0.0192 at 0.27 cm−1 | 0.32 cm−1 |
FIG. 6.
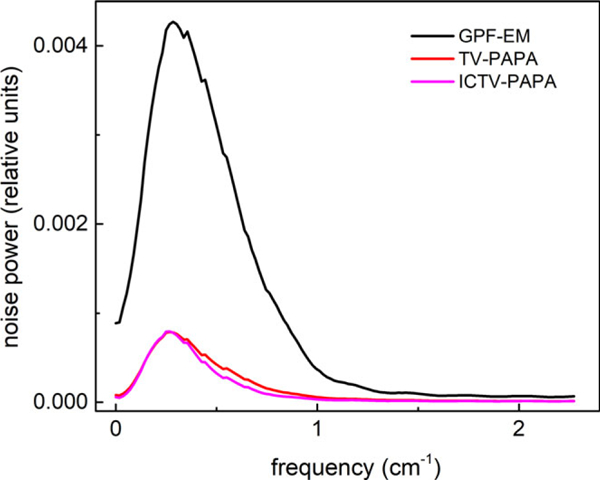
Average radial profiles for local noise power spectra shown in Fig. 5. The profiles were obtained by averaging the data every 10°.
4.D. Channelized Hotelling observer
CHO detectability indices, shown in Figs. 7 and 8, indicate that the ICTV-PAPA method is capable of providing images with higher conspicuity of hot and cold “lesions,” compared to the GPF-EM method. The CHO signal-to-noise ratio (SNR) obtained for simulated “lesions” at 80 kc/view using the ICTV-PAPA method is higher than CHO SNR obtained for 120 kc/view data using the GPF-EM method.
FIG. 7.
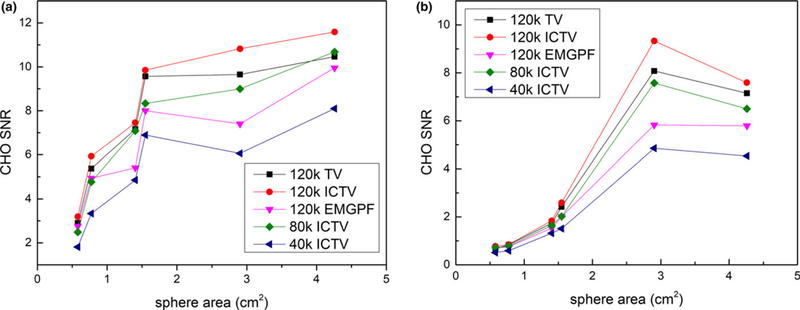
CHO detectability indices of (a) hot; and (b) cold spheres vs. cross-sectional area of the spheres and vs. the number of counts per view in the simulated SPECT data. The ICTV-PAPA method for 40 kc/view data, λ1 = 0.4, λ2 = 0.4; the ICTV-PAPA method for 80 kc/view data, λ1 = 0.3, λ2 = 0.3; the ICTV-PAPA method for 120 kc/view data, λ1 = 0.2, λ2 = 0.2; the TV-PAPA method for 120 kc/view data, λ = 0.2; and the GPF-MLEM method using 120 kc/view data, FWHM = 7.3 mm. The reconstructions were stopped at 100 iterations. The solid lines connecting the data points are provided as a visual guide only.
FIG. 8.
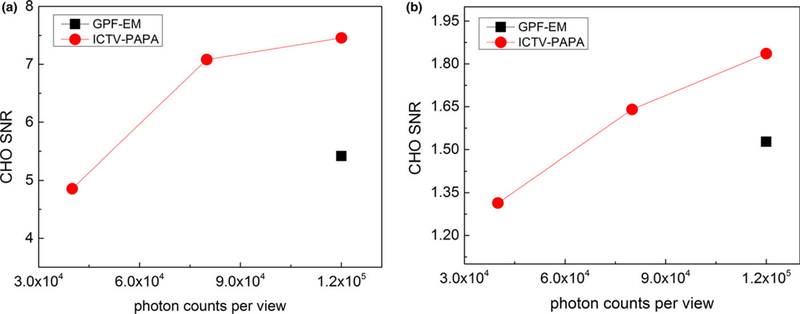
CHO detectability indices estimated (solid circles) for the fourth largest sphere (1.4 cm2 cross-sectional area) for images reconstructed with three photon levels (40, 80, and 120 kc/view) using the ICTV-PAPA method and the GPF-EM method (solid squares) at 120 kc/view level. The solid lines connecting the data points are provided as a visual guide.
4.E. Local point spread function
Plots of local PSF components vs. radial distance are shown in Fig 9. The transaxial local spatial resolution improves approximately monotonically with increasing radial distance from the center of the cylindrical phantom toward the edges. The GPF-EM-reconstructed images have lower FWHM near the center of the phantom, while TV-based methods reconstructed images have lower FWHM near the edge of the phantom. GPF-EM-reconstructed images have more uniform (less steep slope) local FWHM throughout the reconstruction space, compared with TV-based methods. The tangential FWHM is lower than radial FWHM. The actual local FWHM strongly depends on selected penalty parameters.
FIG. 9.
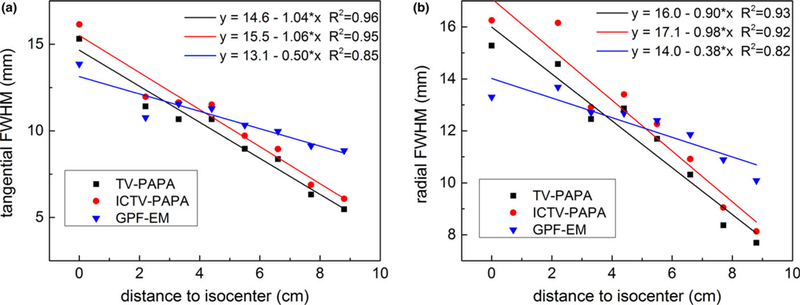
(a) Radial full width at half maximum (FWHM) and (b) tangential FWHM of transaxial local point spread function (LPSF) as a function of radial positions of point sources. The SPECT data were simulated for 120 kc/view. Reconstructions were performed with the following penalty parameters: the ICTV-PAPA method for 40 kc/view data, λ1 = 0.4, λ2 = 0.4; the ICTV-PAPA method for 80 kc/view data, λ1 = 0.3, λ2 = 0.3; the ICTV-PAPA method for 120 kc/view data, λ1 = 0.2, λ2 = 0.2; the TV-PAPA method for 120 kc/view data, λ = 0.2; and the GPF-EM method using 120 kc/view data, FWHM = 7.3 mm. Reconstructions were stopped at 100 iterations. The solid lines are linear regression fits.
4.F. Reconstruction of clinical data
To evaluate the performance of the reconstruction methods in a realistic setting, a projection set for a SPECT Tc-99 m clinical parathyroid study29 was reconstructed using all of the methods. Analysis of Figs. 10–12 shows that images reconstructed using the TV-PAPA and ICTV-PAPA methods with physician determined penalty parameters both have higher spatial resolution and lower background variability, compared with the GPF-EM and clinical OSEM methods (HOSEM, by Hermes30,31). In addition, the ICTV penalty term effectively reduces staircase artifacts.
FIG. 10.

Transaxial views of reconstructed images obtained for clinical Tc-99 m Sestamibi SPECT parathyroid, late-phase study: the clinical Hermes HOSEM method (a); the GPF-EM method (b); the TV (c, d); and ICTV-PAPA (e, f) methods, each with two sets of penalty parameters.
FIG. 12.
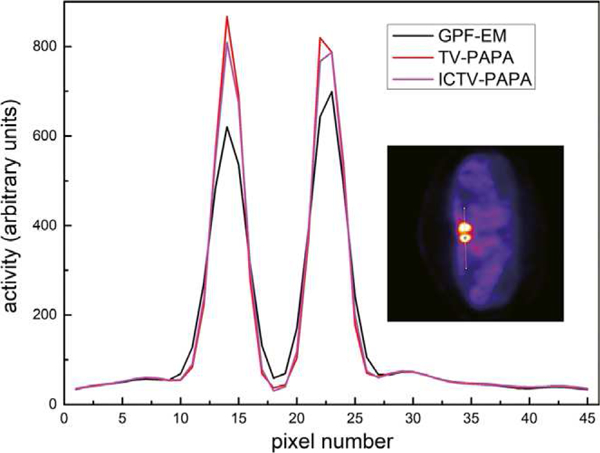
One-channel-wide line profiles through reconstructed transaxial images of clinical Tc-99 m Sestamibi parathyroid scan image shown in Fig. 10. The location of the profile is shown in the inset. Penalty weights were set as: the TV-PAPA method: λ = 2, the ICTV-PAPA method: λ1 = 2, λ2 = 2.
Considering the clinical workflow, penalty parameters should be decided based on a template once a scan is scheduled. For given tasks, the optimal parameter should be roughly the same. Alternatively, an unsupervised method that utilizes the discrepancy principle has been proposed to customize the penalty parameters to each scan.32 However, if computational time is not a concern (e.g., if GPUs are in use for image reconstruction tasks), the better approach may be to reconstruct multiple images with multiple penalty weights and provide radiologists several reconstructed images instead of one image.
5. CONCLUSIONS
In our pursuit for superior regularization for ECT image reconstruction, we implemented infimal convolution of the first-and second-order gradient TV (ICTV) regularization, using our PAPA algorithm. We investigated the quality of SPECT images reconstructed using the ICTV-PAPA method and compared it with the quality of images reconstructed with the TV-PAPA method and the conventional EM algorithm with GPF.
Numerical experiments and initial clinical data reconstructions and analyses indicate that our proposed ICTV-PAPA reconstruction method outperforms the TV-PAPA and GPF-EM methods. The local noise power spectra (LNPS) comparison shows that the ICTV-PAPA method efficiently suppresses the noise while preserving edges without creating staircase artifacts. The maximum and mean amplitudes of LNPS for the TV-based methods for 120 kc/view SPECT data are 5–8 times lower than that for the GPF-EM method. The ICTV-PAPA method permits a better tradeoff of contrast recovery vs. background variability. Thus, with properly selected parameters, the ICTV-PAPA-reconstructed images can simultaneously achieve higher contrast and lower noise (without creating staircase artifacts), compared with the GPF-EM and clinical HOSEM methods. We also found that the TV-based methods exhibit higher CHO SNR for hot and cold simulated “lesions” of various sizes, compared with the GPF-EM method. These findings are also confirmed by quantitative analysis of the reconstructed clinical images.
Imaging performance of simulated lower count (higher noise) SPECT data reconstruction using the ICTV-PAPA method was also investigated. Even with only 67% of the number of photons used in the GPF-EM reconstruction, the hot and cold “lesions” CHO SNR in ICTV-PAPA-reconstructed images still surpassed GPF-EM CHO SNR, indicating that a 33% radiation-dose reduction per patient might be possible.
We conclude that the ICTV-PAPA method exhibits better noise suppression, lower local FWHM, higher contrast recovery and higher lesion detectability than that of the GPF-EM and clinical HOSEM methods. Consequently, it could allow reduction of the radiation dose to patients in clinical SPECT studies.
FIG. 11.

Coronal views of reconstructed images obtained for clinical Tc-99 m Sestamibi SPECT parathyroid late-phase study: the clinical Hermes HOSEM method (a); the GPF-EM method (b); the TV (c, d); and ICTV-PAPA (e, f) methods, each with two sets of penalty parameters.
ACKNOWLEDGMENTS
This work is supported in part by the Special Project on High-performance Computing under the National Key R&D Program (No. 2016YFB0200602), by the Natural Science Foundation of China under grants 11771464, 11601537 and 11471013, and by the US National Science Foundation under grant DMS-1522332. This work is also funded in part through the National Institutes of Health/National Cancer Institute Cancer Center Support Grant No. P30 CA008748.
APPENDIX. PSEUDO-CODE FOR SOLVING THE ICTV-PAPA REGULARIZATION PROBLEMS
The ICTV penalty term can be formularized as:
| (A1) |
where B1 and B2 denote first-order TV, and second-order discrete derivative, respectively. Following the notation used in Section 2.B, the objective function of the ICTV-PAPA method is:
| (A2) |
Assuming both f1 and f2 are non-negative components of f, (17) becomes:
| (A3) |
With element-wise division and multiplication respectively represented by “./” and “.*”, the pseudo-code for ICTV-PAPA is as follows:
|
Footnotes
CONFLICTS OF INTEREST
The authors have no conflicts to disclose.
Contributor Information
Jiahan Zhang, Department of Radiation Oncology, Duke University Medical Center, Durham, NC 27713, USA.
Si Li, School of Computer Science and Technology, Guangdong University of Technology, Guangzhou 510006, China.
Andrzej Krol, Department of Radiology, Department of Pharmacology, SUNY Upstate Medical University, Syracuse, NY 13210, USA.
C. Ross Schmidtlein, Department of Medical Physics, Memorial Sloan Kettering Cancer Center, New York, NY 10065, USA.
Edward Lipson, Department of Physics, Syracuse University, Syracuse, NY 13244, USA.
David Feiglin, Department of Radiology, Department of Pharmacology, SUNY Upstate Medical University, Syracuse, NY 13210, USA.
Yuesheng Xu, Department of Mathematics and Statistics, Old Dominion University, Norfolk, VA 23529, USA; School of Data and Computer Science, Guangdong Province Key Lab of Computational Science, Sun Yat-sen University, Guangzhou 510275, China.
REFERENCES
- 1.Bertero M, Boccacci P. Introduction to Inverse Problems in Imaging. BocaRoton, FL: CRC Press; 1998. [Google Scholar]
- 2.Geman S, Geman D. Stochastic relaxation, gibbs distributions, and the bayesian restoration of images. IEEE Trans Pattern Anal Mach Inteil. 1984;6:721–741. [DOI] [PubMed] [Google Scholar]
- 3.Geman S, MacClure D. Bayesian Image Analysis: An Application to Single Photon Emission Tomography. Alexandria, VA: American Statistical Association; 1985. [Google Scholar]
- 4.Rudin LI, Osher S, Fatemi E. Nonlinear total variation based noise removal algorithms. Physica D. 1992;60:259–268. [Google Scholar]
- 5.Panin VY, Zeng GL, Gullberg GT. Total variation regulated EM algorithm [SPECTreconstruction]. IEEE Trans Nucl Scie. 1999;46:2202–2210. [Google Scholar]
- 6.Chan T, Marquina A, Mulet P. High-order total variation-based image restoration. SIAM J Sci Comput. 2000;22:503–514. [Google Scholar]
- 7.Setzer S, Steidl G, Teuber T. Infimal convolution regularizations with discrete l1-type functionals. Commun Mathemat Sci. 2011;9:797–827. [Google Scholar]
- 8.Chambolle A, Lions P-L. Image recovery via total variation minimization and related problems. Numer Math. 1997;76:167–188. [Google Scholar]
- 9.Bredies K, Kunisch K, Pock T. Total generalized variation*. SIAM J Imaging Sci. 2010;3:492–526. [Google Scholar]
- 10.Krol A, Li S, Shen L, Xu Y. Preconditioned alternating projection algorithms for maximum a posteriori ECT reconstruction. Inverse Prob. 2012;28:115005. [DOI] [PMC free article] [PubMed] [Google Scholar]
- 11.Li S, Zhang J, Krol A, et al. Effective noise-suppressed and artifact-reduced reconstruction of SPECT data using a preconditioned alternating projection algorithm. Med Phys. 2015;42:4872–4887. [DOI] [PMC free article] [PubMed] [Google Scholar]
- 12.Wu Z, Li S, Zeng X, Xu Y, Andrzej K. Reducing staircasing artifacts in spect reconstruction by an infimal convolution regularization. J Comput Mathemat. 2016;34:624–645. [Google Scholar]
- 13.Zhang J, Li S, Lipson E, et al. Image quality comparison of reconstruction using total variation-based regularizers. 2014 IEEE Nucl Sci Symp Med Imaging Conf(NSSZMIC) 2014, 2014: 1–3. [Google Scholar]
- 14.Green PJ. Bayesian reconstructions from emission tomography data using a modified EM algorithm. IEEE Trans Med Imaging. 1990;9:84–93. [DOI] [PubMed] [Google Scholar]
- 15.Micchelli CA, Shen L, Xu Y. Proximity algorithms for image models: denoising. Inverse Prob. 2011;27:045009. [Google Scholar]
- 16.Ljungberg M. The SIMIND Monte Carlo Program. Bristol and Philadelphia: IOP Publishing; 1998. [Google Scholar]
- 17.Ogawa K, Harata Y, Ichihara T, Kubo A, Hashimoto S. A practical method for position-dependent Compton-scatter correction in single photon emission CT. IEEE Trans Med Imaging. 1991;10:408–412. [DOI] [PubMed] [Google Scholar]
- 18.Wilson DW, Tsui BMW, Terry JA. Non-stationary noise characteristics for SPECT images. Paper presented at: Nuclear Science Symposium and Medical Imaging Conference, 1991., Conference Record of the 1991 IEEE; 2–9 Nov 1991, 1991. [Google Scholar]
- 19.Vennart W. ICRU Report 54: Medical imaging—the assessment of image quality: ISBN 0–913394-53-X April 1996, Maryland, USA: Radiography. 1997;3:243–244. [Google Scholar]
- 20.Wilson DW. Noise and resolution properties of FB and ML-EM reconstructed SPECT images Chapel Hill, NC: Department of Biomedical Engineering, University of North Carolina; 1994. [Google Scholar]
- 21.Barrett HH, Yao J, Rolland JP, Myers KJ. Model observers for assessment of image quality. Proc Natl Acad Sci. 1993;90:9758–9765. [DOI] [PMC free article] [PubMed] [Google Scholar]
- 22.Barrett HH, Denny JL, Wagner RF, Myers KJ. Objective assessment of image quality. II. Fisher information, Fourier crosstalk, and figures of merit for task performance. J Opt Soc Am A 1995;12:834–852. [DOI] [PubMed] [Google Scholar]
- 23.Barrett HH, Myers KJ. Foundations of Image Science. Hoboken, NY: Wiley-Interscience; 2004. [Google Scholar]
- 24.Gifford HC, King MA, de Vries DJ, Soares EJ. Channelized hotelling and human observer correlation for lesion detection in hepatic SPECT imaging. J Nucl Med. 2000;41:514–521. [PubMed] [Google Scholar]
- 25.Shidahara M, Inoue K, Maruyama M, et al. Predicting human performance by channelized Hotelling observer in discriminating between Alzheimer’s dementia and controls using statistically processed brain perfusion SPECT. Ann Nucl Med. 2006;20:605–613. [DOI] [PubMed] [Google Scholar]
- 26.Leng S, Yu L, Zhang Y, Carter R, Toledano AY, McCollough CH. Correlation between model observer and human observer performance in CT imaging when lesion location is uncertain. Med Phys. 2013;40: 081908. [DOI] [PMC free article] [PubMed] [Google Scholar]
- 27.Li K, Garrett J, Chen GH. Correlation between human observer performance and model observer performance in differential phase contrast CT. Med Phys. 2013;40:111905. [DOI] [PubMed] [Google Scholar]
- 28.Abbey CK, Barrett HH. Human- and model-observer performance in ramp-spectrum noise: effects of regularization and object variability. J Opt Soc Am A. 2001;18:473–488. [DOI] [PMC free article] [PubMed] [Google Scholar]
- 29.Greenspan BS, Dillehay G, Intenzo C, et al. SNM practice guideline for parathyroid scintigraphy 4.0. J Nucl Med Technol. 2012;40:111–118. [DOI] [PubMed] [Google Scholar]
- 30.Dey D, Slomka PJ, Hahn LJ, Kloiber R. Comparison of ordered subsets expectation maximization and Chang’s attenuation correction method in quantitative cardiac SPET: a phantom study. Nucl Med Commun. 1998;19:1149–1157. [DOI] [PubMed] [Google Scholar]
- 31.Kauppinen T, Koskinen MO, Alenius S, Vanninen E, Kuikka JT. Improvement of brain perfusion SPET using iterative reconstruction with scatter and non-uniform attenuation correction. Eur J Nucl Med. 2000;27:1380–1386. [DOI] [PubMed] [Google Scholar]
- 32.Schmidtlein CR, Lin Y, Li S, et al. Relaxed ordered subset pre-conditioned alternating projection algorithm for PET reconstruction with automated penalty weight selection. Med Phys. 2017;44:4083–4097. [DOI] [PMC free article] [PubMed] [Google Scholar]


