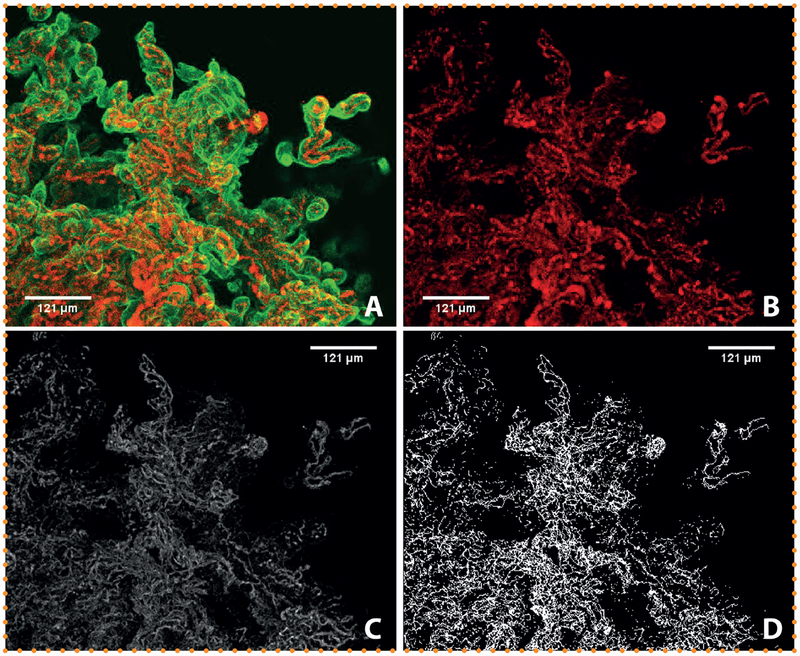
Figure 5.
Maximum-intensity projections of immunofluorescent labeled (CD31 – red; CK7 – green) and clarified NHP placental tissue imaged using the Leica SP5 AOB5 spectral confocal system with a 20× PL APO NA 0.75 AIR CORR CS2 objective. (A) Placenta tissue visualized at excitation wavelengths for the detection of CD31 (AF647) and CK7 (AF488); (B) the same tissue following isolation of the fetal vasculature, and background subtraction (rolling ball radius of 10); (C) the same tissue once it has been made binary and undergone thresholding; (D) the same tissue following skeletonization, the final step prior to quantitative analysis.

