Abstract
PURPOSE
Early-stage cancers are routinely treated with surgery followed by radiotherapy (SR). Radiotherapy before surgery (RS) has been widely ignored for some cancers. We evaluate overall survival (OS) and disease-free survival (DFS) with SR and RS for different cancer types and simulate the plausibility of RS-nd SR-induced antitumor immunity contributing to outcomes.
MATERIALS AND METHODS
We analyzed a SEER data set of early-stage cancers treated with SR or RS. OS and DFS were calculated for cancers with sufficient numbers for statistical power (cancers of lung and bronchus, esophagus, rectum, cervix uteri, corpus uteri, and breast). We simulated the immunologic consequences of SR, RS, and radiotherapy alone in a mathematical model of tumor-immune interactions.
RESULTS
RS improved OS for cancers with low 20-year survival rates (lung: hazard ratio [HR], 0.88; P = .046) and improved DFS for cancers with higher survival (breast: HR = 0.64; P < .001). For rectal cancer, with intermediate 20-year survival, RS improved both OS (HR = 0.89; P = .006) and DFS (HR = 0.86; P = .04). Model simulations suggested that RS could increase OS by eliminating cancer for a broader range of model parameters and radiotherapy-induced antitumor immunity compared with SR for selected parameter combinations. This could create an immune memory that may explain increased DFS after RS for certain cancers.
CONCLUSION
Study results suggest plausibility that radiation to the bulk of the tumor could induce a more robust immune response and better harness the synergy of radiotherapy and antitumor immunity than postsurgical radiation to the tumor bed. This exploratory study provides motivation for prospective evaluation of immune activation of RS versus SR in controlled clinical studies
INTRODUCTION
Surgery followed by radiotherapy (SR) improves locoregional control in numerous locally advanced cancers,1–3 making radiotherapy a vital component of intent-to-cure cancer treatment.4 Radiotherapy followed by surgery (RS) versus surgery alone has demonstrated improved outcomes in bladder, cervical, esophageal, rectal, and resectable pancreatic cancers. Clinical trials comparing SR and RS out-comes are scarce and have been limited to a few cancer types. One successful example is rectal carcinoma,5,6 where improved local control after RS versus SR (with or without concurrent chemotherapy) was demonstrated and resulted in a paradigm shift from SR to RS. However, these trials have failed to demonstrate superior overall survival (OS) after RS. Similarly, in a prospective trial for muscle-invasive bladder cancer,7 no significant difference in 3-year statistics between RS and SR was found. A slight increase in OS for patients undergoing RS compared with SR was observed in soft tissue sarcoma of the limbs.8
To date, the few published studies comparing radiotherapy and surgery sequencing seem inconclusive. A SEER analysis showed that RS can be associated with a significantly higher risk of death in Siewert type II gastroesophageal junction cancer when compared with SR.9 However, for locally advanced esophageal cancer, and squamous cell carcinoma in particular, superiority of RS over SR with concurrent chemotherapy was demonstrated.10 Retrospective analyses have also shown superior OS after RS in stage III non–small-lung cancer11 and in cT2 noninflammatory breast cancer with concurrent chemotherapy.12 There are also some indications that RS can reduce the risk of local recurrence in localized soft tissue sarcoma.13
It is increasingly appreciated that radiotherapy increases the mutational burden and induces cell stress as well as immunogenic cell death, thereby exposing a wealth of previously hidden and de novo tumor-associated antigens, stress proteins, and danger-associated molecular patterns to the immune system.14–18 Tumor-infiltrating lymphocyte enrichment after radiotherapy was previously assessed in 40 patients with rectal cancer. The densities of CD3+ and CD8+ T-lymphocytes significantly increased from preradiotherapy biopsy specimens to postradiotherapy surgically resected specimens.19 It is conceivable that immune-related benefits of radiation to the bulk tumor compared with radiation to the postsurgical cavity could be general phenomena even in early-stage disease. Herein, we evaluate OS and disease-free survival (DFS) outcome data for various cancers and present a quantitative framework to simulate tumor–immune system dynamics during the different treatment sequences, which further supports the plausibility of increased antitumor immunity with RS compared with SR.
MATERIALS AND METHODS
SEER Analysis
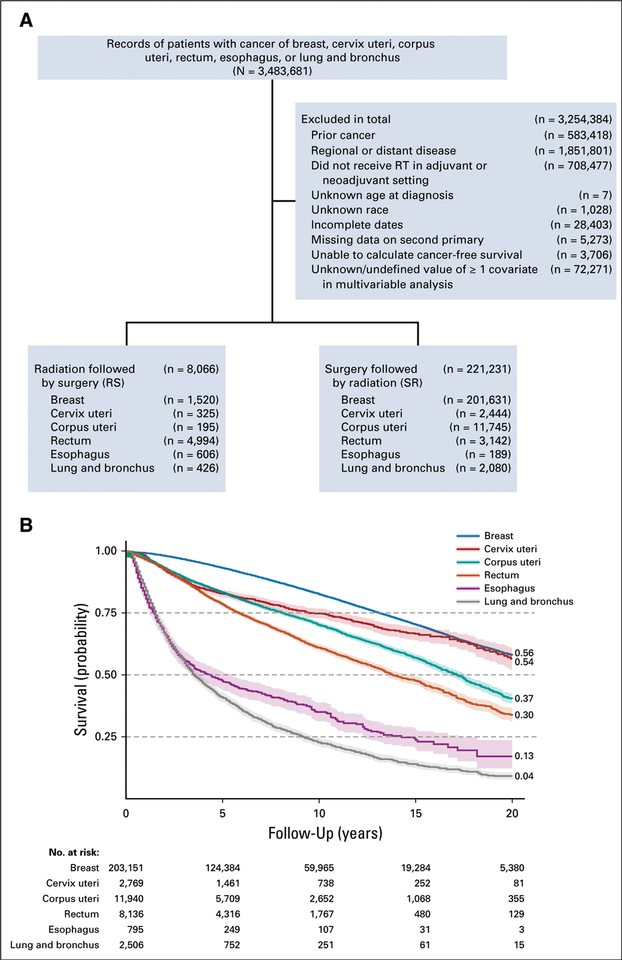
We queried the SEER database (November 2016 submission with additional treatment information) for localized cancers (no lymph node involvement and no metastasis; N0M0) with at least 100 cases of each of RS and SR and available information about potentially confounding covariates (Fig 1A). These included cancers of the lung and bronchus, esophagus, rectum, cervix uteri, corpus uteri, and breast. We selected patients who received either RS or SR and censored the follow-up period to 20 years. DFS was calculated as previously discussed.19a Hazard ratios (HRs) of DFS and OS adjusted for age, sex, year of diagnosis, histology, type of surgery, tumor size, and treatment sequencing (RS v SR) were calculated using multivariable Cox proportional hazard models.20
FIG 1.
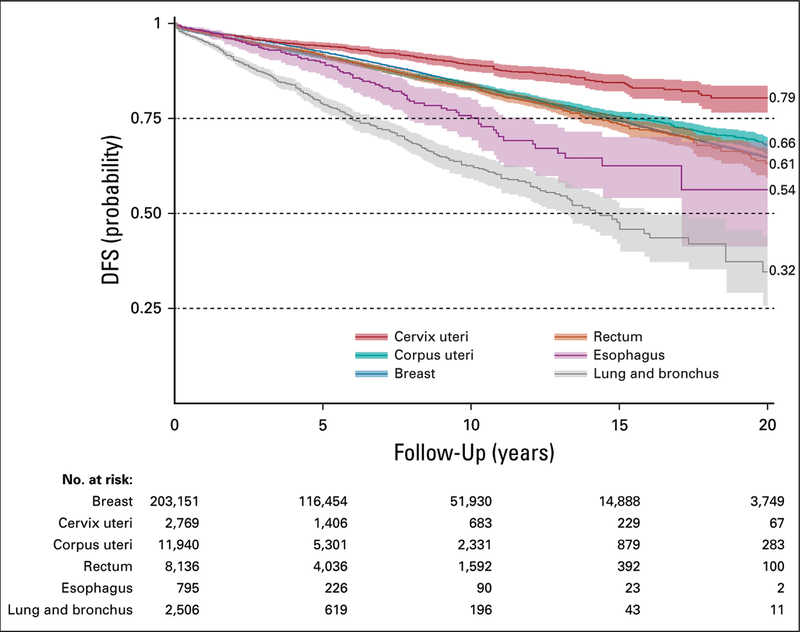
(A) SEER inclusion/exclusion. (B) Kaplan-Meier 20-year survival.
Modeling of Tumor–Immune System Dynamics During SR and RS
Mathematical modeling of tumor–immune system interactions has a long history.21,22 The established Kuznetsov model captures first-order principles underlying the complex disease dynamics and has been calibrated against experimental data.21 This model relies on the following main assumptions: tumors follow logistic growth dynamics, where initially exponential growth decelerates as the tumor approaches the tissue-carrying capacity; tumor growth is modulated by the cytotoxic action of immunocompetent effector T cells as part of specific adaptive immune responses; cytotoxic effector T cells are recruited in response to tumor burden following Michaelis-Menten dynamics; tumor-infiltrating effector T cells may get exhausted by their antitumor activity and undergo spontaneous death; and innate immunity or base immune surveillance is represented as a baseline presence of effector T cells at any time, even in the absence of tumor cells.
We extended the Kuznetsov model to explore the potential benefits and immunologic consequences of radiotherapy and surgery sequencing, on the basis of the following additional assumptions: radiotherapy kills both cancer and effector T cells23,24 at different rates determined by the radiation dose and cell type–specific radiosensitivity by some forms of cell death, including autophagy, apoptosis, necrosis, mitotic catastrophe, and senescence; irradiated tumor cells may undergo immunogenic cell death that emits immunostimulating signals and chemokines, resulting in the recruit ment of inflammatory immune cells to the tumor microenvironment, including antigen-presenting cells such as dendritic cells and macrophages, which in turn recruit and activate cytotoxic effector T cells15,25–28; the strength of radiotherapy-induced antitumor response, characterized by subsequent immune cell infiltration of the tumor, is assumed to depend on the number of tumor cells killed by radiotherapy; and surgical resection is simulated by instantaneously decreasing both cancer and effector cell populations.
We denoted the number of viable cancer cells (or clonogens) in an arbitrary tumor volume as C(t), tumor-infiltrating activated immune effector T cells as E(t), and irradiated cancer cells undergoing immunogenic cell death as D(t). The model was formulated as a system of ordinary differential equations given by dC/dt = (tumor growth) − (death of tumor cells by effector T cells) − (radiotherapy) − (surgical resection), or
| (1) |
by dE/dt = (tumor burden–stimulated effector T-cell recruitment) − (exhaustion of effector T cells by their antitumor action) + (physiologic level and decay of effector T cells) + (radiotherapy-induced immunostimulation) − (radiotherapy) − (surgical resection), or
| (2) |
and by dD/dt = (tumor cell sterilized by radiotherapy) − (lysis of tumor cells sterilized by radiotherapy), or
| (3) |
where the time coordinate on the system variables was omitted for notational simplicity. δ(τ) is the Dirac delta function. For demonstration purposes, we chose previously reported specific model parameter values that simulate a growing tumor and associated effector cell dynamic in the absence of therapy (Table 1). For analysis, we changed model parameters that may represent the patient-specific biology of individual patients, including different human leukocyte antigen haplotypes or increased mutational burden for different cancers that may translate into higher immunogenicity.
TABLE 1.
Overview of Model Parameters and Values Used in Simulations
| Parameter | Description | Value | Unit | First Author |
|---|---|---|---|---|
| r | Tumor growth rate | (1.0–4.0) × 10−1 | Day−1 | Poleszczuk22 |
| k | Tumor tissue carrying capacity | 5.32 × 10⁸ | Cells | Poleszczuk22 |
| a | T cell-cancer cell interactions constant | 0.14 × 10⁻⁶ | Day−1 cells−1 | Poleszczuk22 |
| P | Probability that during T cell-cancer cell interactions the latter is killed | 9.98 × 10⁻¹ | Dimensionless | Poleszczuk22 |
| f | Magnitude of immune system stimulation by the presence of cancer cells | (1.0–3.0) × 10−1 | Day−1 | Poleszczuk22 |
| g | Immune stimulation damping coefficient | 0.16 × 10⁶ | Cells | Poleszczuk22 |
| h | Effector cells decay rate | 5.9 × 10⁻¹ | Day−1 | Poleszczuk22 |
| E* | Physiologic level of effector cells | 0.3 × 10⁶ | Cells | Poleszczuk22 |
| α | Radiation sensitivity parameter | 0.3 | Gy−1 | Guerrero29 |
| β | Radiation sensitivity parameter | 0.03 | Gy−2 | Guerrero29 |
| 1 (proliferating cells) | ||||
| 1/3 (quiescent cells) | ||||
| q | RT-induced immunostimulation | (0.0 – 6.5) × 10−1 | Day−1 | Assumed for demonstration purpose |
| n | Lysis rate of tumor cells killed by RT | 6.9 × 10⁻¹ | Day−1 | Eftimie31 |
Abbreviation: RT, radiotherapy.
The cytotoxic effect of radiotherapy on cancer cells was simulated using the linear quadratic (LQ) model that is widely used in clinical applications32–34 to approximate the dose-dependent surviving fraction SF(d) of irradiated cancer cells by
| (4) |
where d (Gy) is the radiation dose and α (Gy−1) and β (Gy−2) are cell type–specific radiosensitivity parameters. Compelling evidence demonstrates that hypoxic (poorly oxygenated) cancer cells are growth arrested and estimated to be approximately three times more resistant to radiation than normoxic cycling cells.30,35 We set ξ = 1 or ξ = 1/3 to respectively scale the radiosensitivity of proliferative and quiescent cancer cells as previously demonstrated.30,36 We set radiosensitivity parameters α = 0.3 Gy−1 and β = 0.03 Gy−2 as conventionally assumed and estimated for a variety of tumor types.29 The probabilities of surviving 2 Gy radiation were SF (2 Gy) = 0.49 for proliferating cancer cells (ξ = 1) and SF (2 Gy) = 0.79 for quiescent cancer cells (ξ = 1/3).
Effector T-cell radiosensitivity was estimated on the basis of experimental data of radiotherapy-induced apoptosis in lymphocytes obtained from blood samples.37 Apo-ptosis is considered one of the dominant cell death processes in response to radiotherapy,38 and correlation between the intensity of apoptosis in lymphocytes and radiation dose has been reported.37,39 From dose-response curves of effector CD8+ T cells in vitro after exposure to acute doses of 0 to 8 Gy,37 we derived SFE (2 Gy) = 0.61.
Radiotherapy was simulated with a total dose of 50 Gy delivered in 25 weekday fractions of d = 2 Gy per day. The total dose of 50 Gy was chosen for demonstration purposes in line with the standard dose for breast cancer, the largest patient cohort in the SEER data. Extension of the analysis to other total doses was straightforward and did not alter the results of this study (Appendix Fig A1). After logistic tumor growth and the LQ model in Equation 4,32,40 the fraction of cancer cells (C) sterilized by radiotherapy with dose d at time τi was determined by the loss term TR(τi,d,C) in Equation 1 given by
| (5) |
where the terms and are the number of proliferating and quiescent cancer cells at time τi such that their sum is equal to C(τi). The radiobiologic terms 1 − SFp(d) and 1 − SFq(d) represent respectively the fraction of proliferating and quiescent cancer cell sterilized by radiotherapy with dose d and determined by the LQ model in Equation 4.
The loss term TR(τi,d,E) in Equation 2 simulates the killing effects of radiotherapy on effector T cells (E) at time τi and is given by
| (6) |
Surgical resection was simulated by instantaneously decreasing both cancer and effector cell populations by 99%. At the time of surgery τj, removal of cell populations was incorporated in the model by the following loss terms
| (7) |
| (8) |
where surgical resection was simulated with λC = λE = 0.99. After surgical resection, the dynamics of remaining cell populations, if any, continued to be governed by Equations 1 to 3. Model simulations were initialized with 106 viable cancer cells (or clonogens) and 105 effector T cells in an arbitrary tumor volume. Tumor–immune system interaction dynamics were simulated for different combinations of tumor growth rate (r) and recruitment of effector T cells in response to tumor burden (f). Combinations of parameters r and f that yielded an increase of cancer cells > 108 were considered for treatment simulations. Note that this number represents viable cancer cells in a tumor that may have considerably larger radiographic volumes. Tumor control (TC) was assumed if the number of viable cancer cells dropped below C(t) < 1. The mathematical model was simulated using Matlab (www.mathworks.com).
RESULTS
OS and DFS of RS and SR
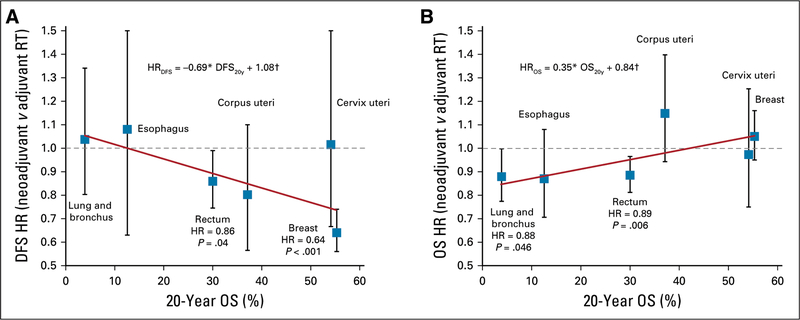
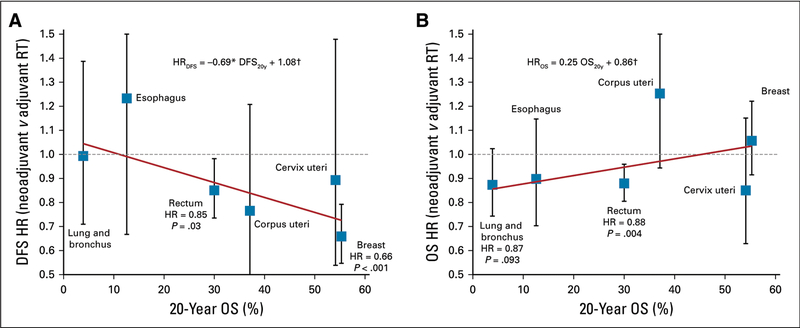
Cancer sites were evaluated for 20-year OS (Fig 1B) and DFS (Appendix Fig A2). A trend of RS benefit versus SR became apparent when cancers were sorted by their 20-year OS (DFS regression coefficient, −0.69; P < .05; OS regression coefficient, +0.35; P < .05; Fig 2). For cancers of the lung and bronchus (n = 2,506), RS yielded significantly improved OS (HR = 0.88; P = .046; 20-year survival, 6.2% v 2.5%; Fig 2B). Although an OS benefit was not observed in breast cancer (n = 203,151) with high baseline 20-year OS rates, RS yielded a significant improvement in DFS (HR = 0.64; P < .001; Fig 2A). Interestingly, patients with rectal cancer (n = 8,136) with an intermediate 20-year survival rate of 30% may benefit from RS, with both increased OS (HR = 0.89; P = .006) and DFS (HR = 0.86; P = .04). Crucially, RS was not found to be significantly inferior to SR in any of the multivariable Cox proportional model analyses (Data Supplement). Analysis of propensity score–matched cohorts is shown in Appendix Figure A3.
FIG 2.
Hazard ratios (HRs; with 95% CIs, P values, and linear least squares regression lines weighted by the inverses of site-specific CIs) for (A) disease-free survival (DFS) and (B) overall survival (OS) after preoperative (neoadjuvant) RT (RS) compared with postoperative (adjuvant) RT (SR). HRs were adjusted for age, sex, year of diagnosis, histology, type of surgery, type of applied radiation, and tumor size. Equation describes the trend line, and coefficients were tested for significant difference from 0 using t test. (*) P < .05. (†) P < .001. RT, radiotherapy
Effects of Treatment Order Negligible Without Simulated Radiotherapy-Induced Immunity
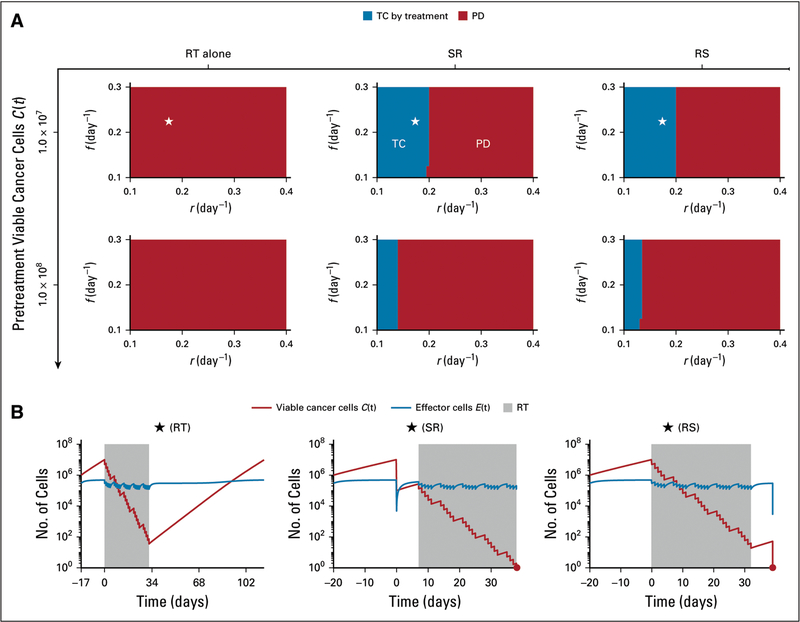
The effectiveness of radiotherapy in eliminating cancer may result from a combination of the lethal effect of radiotherapy and stimulation of antitumor immunity. We first simulated treatments without additional radiotherapy-induced immunity (q = 0 day−1 in Equation 2). Simulations of SR and RS yielded similar outcomes, with tumor control (TC) being dependent on tumor growth rate and pretreatment tumor size. Interestingly, radiotherapy alone could not eliminate tumors with as few as 107 pretreatment viable cancer cells (Fig 3).
FIG 3.
(A) Model-predicted treatment outcomes of radiotherapy (RT) alone, RT after surgical resection (SR), and RT before surgical resection (RS) without RT-induced immunity (ie, q = 0.0 day−1 in Equation 2) in a cohort of virtual patients with different combinations of pretreatment tumor size, tumor growth rate (r), and immune recruitment rate (f) in response to tumor burden. Radiation is delivered to a total dose of 50 Gy in 25 daily fractions at 2 Gy per day, 5 days per week. Tumor control (TC) by treatment (blue) and progressive disease (PD; red) refer to tumor eradication and escape after treatment, respectively. (B) Time evolution of tumor and effector T cells corresponding to the location marked by stars in panel A.
RS Improves Outcomes With Radiotherapy-Induced Immunity
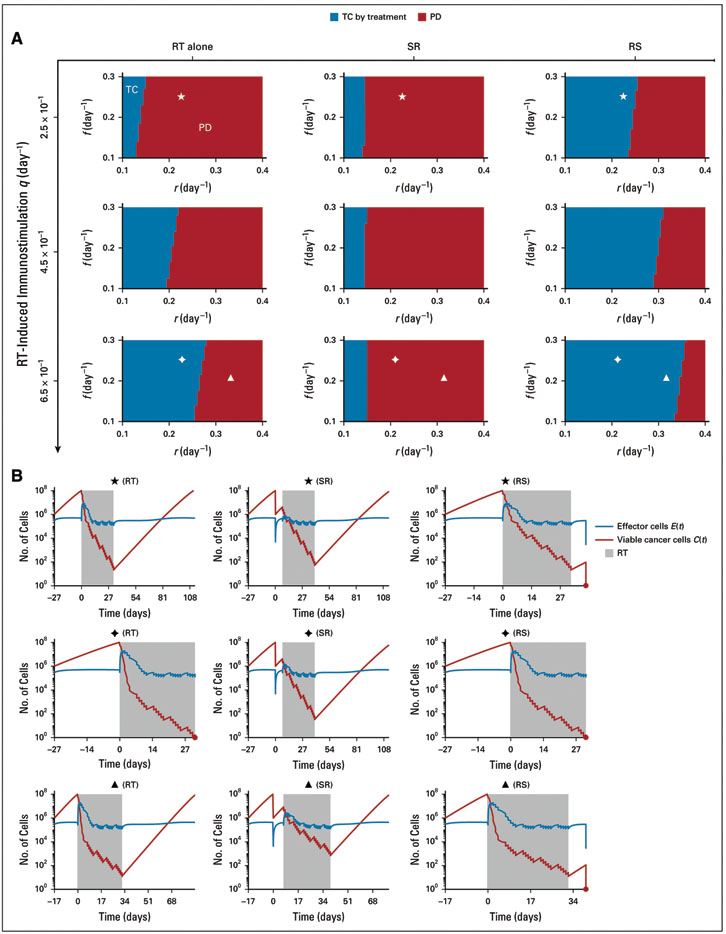
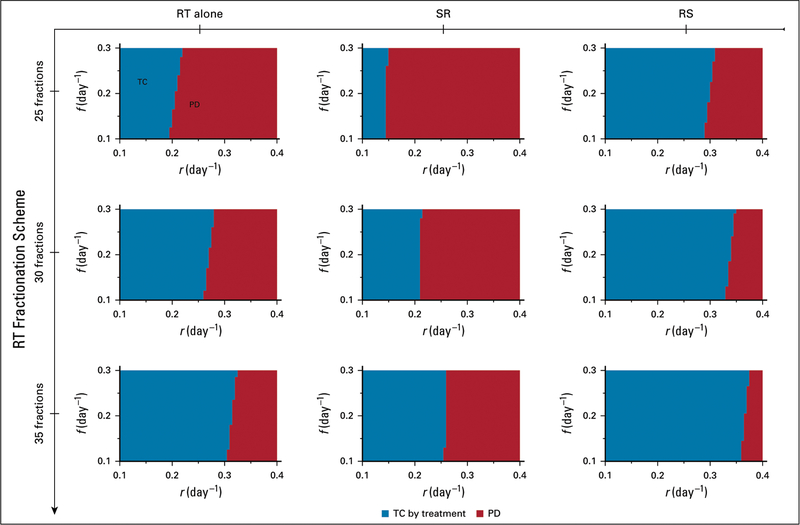
Because radiotherapy-induced cytotoxicity alone was unlikely to eradicate all cancer cells with the chosen radio-sensitivity parameters, but radiotherapy often sterilized large tumors with presumably > 107 viable cancer cells, clinically observed complete tumor eradication may depend on the strength of radiotherapy-induced antitumor immunity activation (q, day−1 in Equation 2). The efficacy of radiotherapy alone and RS but not SR increased with increased radiotherapy-induced immunity (q = 0.25 to 0.65 day−1). In addition, for strong radiotherapy-induced antitumor immunity, radiotherapy alone resulted in better outcomes than SR. RS yielded TC for more model parameter combinations than radiotherapy alone and SR (Fig 4). For SR, increased radiotherapy-induced immunostimulation had no notable impact on outcomes, because a majority of tumor cells were removed preirradiation, and radiotherapy-induced antitumor immunity was not sufficiently achieved. The benefit of radiotherapy alone and RS over SR was independent of the total number of radiation fractions (Appendix Fig A1) and insensitive to changes in other model parameters (Appendix Figs A4 to A6).
FIG 4.
(A) Model-predicted treatment outcomes of radiotherapy (RT) alone, RT after surgical resection (SR), and RT before surgical resection (RS) for tumors of 108 viable cancer cells pretreatment and increasing strength of RT-induced immunostimulation (q, day−1 in Equation 2) in a cohort of virtual patients with different combinations of tumor growth rate (r) and immune recruitment rate (f) in response to tumor burden. Radiation is delivered to a total dose of 50 Gy in 25 daily fractions at 2 Gy per day, 5 days per week. Tumor control (TC) by treatment (blue) and progressive disease (PD; red) refer to tumor eradication and escape after treatment, respectively. (B) Time evolution of tumor and effector T cells corresponding to the locations marked by diamonds, triangles, and stars in panel A.
RS Induces Stronger Antitumor Immunity Than SR
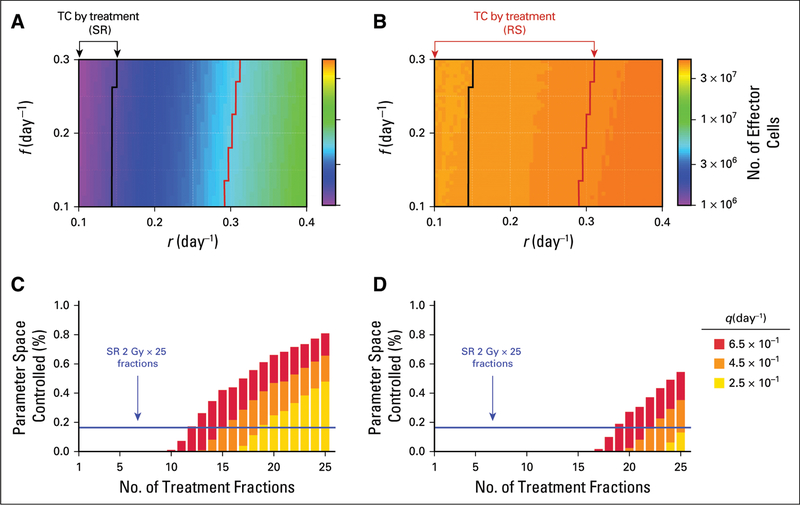
After surgery, radiation is delivered with the intent to eradicate residual cancer cells or microscopic tumors in the tumor bed beyond the surgical margins. Compared with RS, SR implied a significantly smaller number of cancer cells for radiotherapy-induced immune activation. The integral of the term qD in Equation 2 simulated the number of effector cells recruited to the tumor. Simulation analysis confirmed that the strength of tumor-specific immunity induced by RS was significantly higher than that induced by SR (Figs 5A and 5B). This may contribute to both increased OS rates and increased antitumor immunity, which may surveil metastatic deposits outside the irradiation field (abscopal response) to increase DFS (compare with Fig 2).
FIG 5.
Comparison of immune recruitment and treatment outcomes for tumors of 108 viable cancer cells pretreatment with tumor growth rate (r) between 0.1 and 0.4 day−1 and immune recruitment rate (f) in response to tumor burden between 0.1 and 0.3 day−1. (A) Recruitment of effector T cells to the tumor bed as a result of radiotherapy (RT) –induced immune responses by surgery followed by RT (SR). (B) Recruitment of effector T cells to the tumor bed as a result of RT-induced immune responses by RT followed by surgery (RS). Recruitment of effector T cells after both SR and RS is estimated by the integral of the term qD in Equation 2, with q = 4.5 × 10⁻¹ day−1. Arrows point to the parameter combinations that yield tumor control (TC) by SR and RS (c.f. Fig 4A). (C) Proportion of parameter space controlled for SR (25 daily fractions at 2 Gy per day, 5 days per week; blue line) compared with RS with gradually increasing number of fractionations. (D) Proportion of parameter space controlled for SR (25 daily fractions at 2 Gy per day, 5 days per week; blue line) compared with RT alone with increasing number of fractionations. Parameters are 0.1 ≤ r ≤ 0.4 day−1 and 0.1 ≤ f ≤ 0.3 day−1. Different strengths of RT-induced immunostimulation are color coded (q, day−1 in Equation 2).
Radiotherapy-Induced Immunity Suggests Plausibility of RS Dose De-escalation
Normal tissue toxicity remained a limiting factor in radiotherapy, with acute and late toxicities largely being attributable to total radiation dose and dose per fraction. Model simulations suggested that for high rates of radiotherapy-induced immunity, RS with 2 Gy per fraction may be reduced to as low as half the number of RS fractions for outcomes comparable to the full course of SR (12-fraction RS v 25-fraction SR; Fig 5C). Lower immunogenicity may require > 13 fractions but potentially provides TC probability with fewer fractions than SR. For high rates of radiotherapy-induced immunity, radiotherapy alone may be a potential alternative to SR, with comparable TC rates (Fig 5D).
DISCUSSION
Accumulating evidence supports the notion that radiotherapy-induced antitumor immunity, especially when promoted with concurrent immunotherapy, could result in long-term memory41,42 and may yield robust systemic immune responses against metastatic reservoirs outside the irradiation field, a phenomenon termed the abscopal effect.43–45 Radiotherapy may no longer be considered a purely cytotoxic treatment; rather, it has biologic properties to transform the tumor into an in situ vaccine.46 The clinical promise of the complex but promising immuneradiation synergy is reflected in > 100 active clinical trials testing the combination of radiotherapy with immunotherapy, mostly for metastatic cancer.47 A robust immune response after focal irradiation may require a sufficiently large population of cancer cells to activate immune cells in numbers large enough to disseminate systematically and establish an immunologic memory. The herein presented model simulations suggest a positive correlation between radiotherapy-induced antitumor immunity and tumor size at time of irradiation and may explain the poorer local outcomes achieved with SR compared with RS. After surgical resection with clean margins, radiotherapy will, at best, act upon microscopic tumor clusters in the tumor bed, which may be insufficient to elicit a robust immune response.
For cancers with poor OS rates even when detected early (cancers of lung and bronchus, esophagus, rectum), RS may increase OS compared with SR because of additional cytotoxicity resulting from the increased immune activation. For tumors with higher OS rates (breast, rectum), benefits of RS can be seen in DFS, arguably because of higher antitumor immunity that may also act systemically against tumors outside the irradiation field and future disease.22 For some tumors, no significant outcome benefits were observable for either sequencing of radiotherapy and surgery. However, trends toward increased OS for cancers with low survival rates (regression coefficient, −0.65; P < .05) as well as increased DFS for cancers with high survival rates (regression coefficient, 0.35; P < .05) were noted.
One inherent limitation of SEER data analysis is composed of the potentially confounding factors that are not recorded, including patient selection criteria. Patients eligible for RS may be disproportionally treated in clinical trials and thus could represent a substantially different population than patients undergoing SR. Moreover, RS may be preferentially performed by academic, high-volume centers that often provide better outcomes in general. To address the issue of unbalanced arms, we performed multivariate Cox proportional hazards model analysis after preprocessing the data with propensity score matching on the basis of all considered covariates.48 These data are comparable to the results obtained for the whole cohorts (Appendix Fig A3).
Different mathematical models have been proposed to simulate tumor–immune system interactions21,22,49–59 and the synergistic effects of radiotherapy with the immune system and immunotherapy.22,60–63 To demonstrate immunologic consequences of sequencing radiotherapy and surgery, we extended the established Kuznetsov model and its parameterization as previously discussed.21,22 Model simulations revealed that observable clinical responses may be parameter dependent, and as such, the model needs to be rigorously calibrated for individual cancers before definite conclusions can be drawn.
Taken together, the statistical analysis of historical outcome data and the mathematical model combine to further add to the growing interest in understanding the biologic and immunologic consequences of radiotherapy. This study provides rationale and motivation for additional investigating and understanding the effects of radiotherapy on the immune system of patients with cancer to guide appropriate prospective validation of radiotherapy and surgery sequencing. This should include immune panels on longitudinal blood draws during radiotherapy as well as analysis of immune infiltration in preirradiation biopsies and surgically resected tissues.
Supplementary Material
SUPPORT
Supported in part by Institutional Research Grant No. 14-189-19 from the American Cancer Society (H.E.), by the German Federal Ministry of Education and Research funding of the eMED project SYSIMIT (Grant No. 01ZX1308D; J.C.L.A.), and by the Helmholtz Association of German Research Centers Initiative and Networking Fund for the project on reduced complexity models (Grant No. ZT-I-0010; J.C.L.A.).
APPENDIX
FIG A1.
Model-predicted treatment outcomes of radiotherapy (RT) alone, RT after surgical resection (SR), and RT before surgical resection (RS) for tumors of 108 viable cancer cells pretreatment and increasing number of treatment fractions in a cohort of virtual patients with different combinations of tumor growth rate (r) and immune recruitment rate (f) in response to tumor burden. Radiation is delivered to total doses of 50, 60, and 70 Gy in 25, 30, and 35 daily fractions at 2 Gy per day, 5 days per week. Tumor control (TC) by treatment (blue) and progressive disease (PD; red) refer to tumor eradication and escape after treatment, respectively. For all simulations, we set RT-induced antitumor immunity to q = 4.5 × 10⁻¹ day−1.
FIG A2.
Kaplan-Meier 20-year disease-free survival (DFS) curves for each of the considered cancer sites, with 95% Cis.
FIG A3.
Results of analysis using multivariable Cox proportional hazard model performed after propensity score matching of the adjuvant and neoadjuvant radiotherapy (RT) cohorts for each cancer site separately. Hazard ratios (HRs; with 95% CIs, P values, and trend lines obtained using linear least squares weighted by the inverses of site-specific CI lengths) for (A) disease-free survival (DFS) and (B) overall survival (OS) after preoperative (neoadjuvant) radiation (RS) compared with postoperative adjuvant radiation (SR). HRs were adjusted for age, sex, year of diagnosis, histology, type of surgery, type of applied radiation, and tumor size. Equation describes the trend line, and coefficients were tested for significant difference from 0 using t test. (*) P<.05. (†) P < .001.
FIG A4.
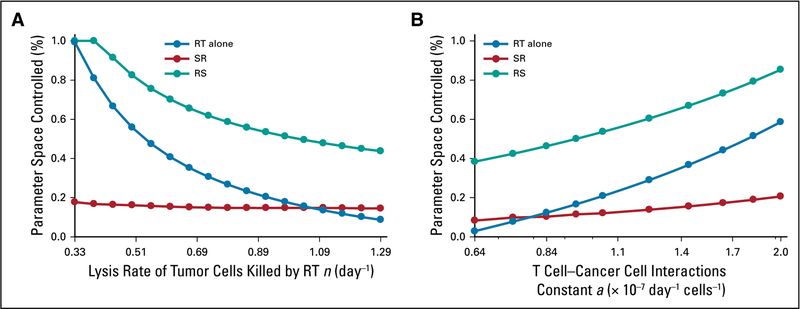
Proportion of parameter space controlled by radiotherapy (RT) alone, RT after surgical resection (SR), and RT before surgical resection (RS) for different values of (A) the lysis rate of tumor cells killed by RT (n) and (B) the T cell–cancer interactions constant (a; Equations 1 to 3). Radiation is delivered to a total dose of 50 Gy in 25 daily fractions at 2 Gy per day, 5 days per week. For all simulations, we set RT-induced antitumor immunity to q = 4.5 × 10⁻¹ day−1 and tumors of 108 viable cancer cells pretreatment.
FIG A5.
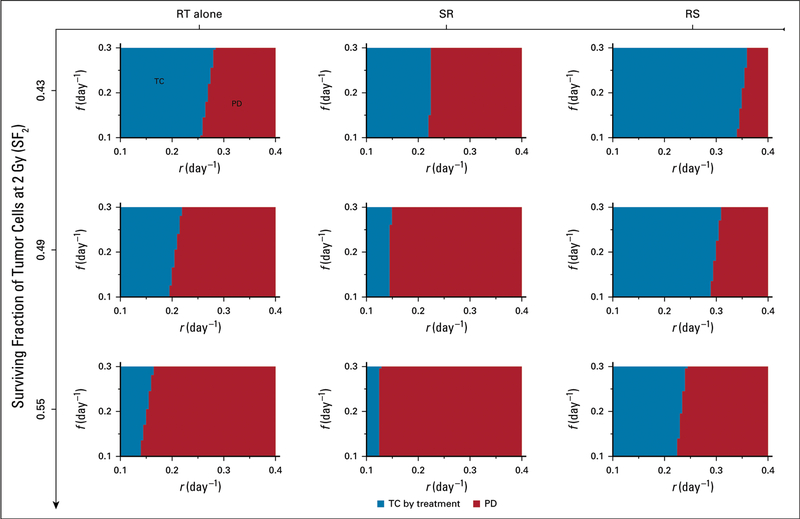
Model-predicted treatment outcomes of radiotherapy (RT) alone, RT after surgical resection (SR), and RT before surgical resection (RS) for tumors of 108 viable cancer cells pretreatment and increasing surviving fractions of tumor cells at 2 Gy (SF2) in a cohort of virtual patients with different combinations of tumor growth rate (r) and immune recruitment rate (f) in response to tumor burden. Radiation is delivered to a total dose of 50 Gy in 25 daily fractions at 2 Gy per day, 5 days per week. Tumor control (TC) by treatment (blue) and progressive disease (PD; red) refer to tumor eradication and escape after treatment, respectively. For all simulations, we set RT-induced antitumor immunity to q = 4.5 × 10⁻¹ day−1.
FIG A6.
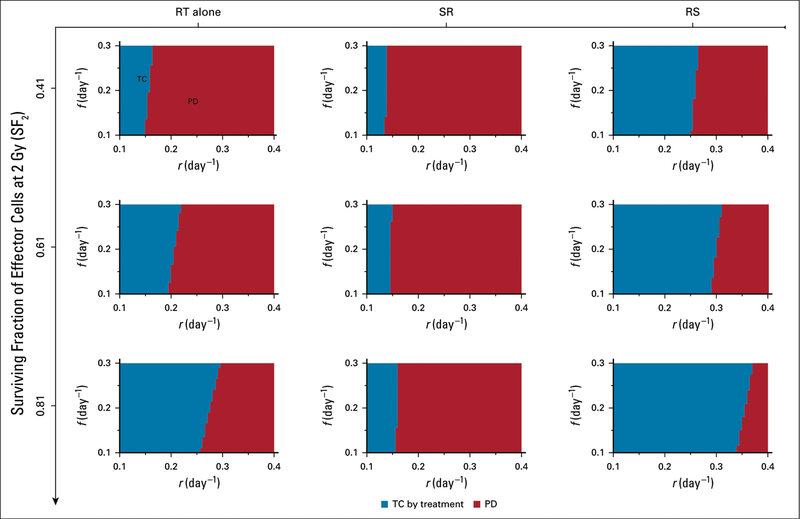
Model-predicted treatment outcomes of radiotherapy (RT) alone, RT after surgical resection (SR), and RT before surgical resection (RS) for tumors of 108 viable cancer cells pretreatment and increasing surviving fractions of effector cells at 2 Gy (SF2) in a cohort of virtual patients with different combinations of tumor growth rate (r) and immune recruitment rate (f) in response to tumor burden. Radiation is delivered to a total dose of 50 Gy in 25 daily fractions at 2 Gy per day, 5 days per week. Tumor control (TC) by treatment (blue) and progressive disease (PD; red) refer to tumor eradication and escape after treatment, respectively. For all simulations, we set RT-induced antitumor immunity to q = 4.5 × 10⁻¹ day−1.
Footnotes
Appendix Data Supplement Author affiliations and support information (if applicable) appear at the end of this article.
AUTHORS’ DISCLOSURES OF POTENTIAL CONFLICTS OF INTEREST AND DATA AVAILABILITY STATEMENT
The following represents disclosure information provided by authors of this manuscript. All relationships are considered compensated. Relationships are self-held unless noted. I = Immediate Family Member, Inst = My Institution. Relationships may not relate to the subject matter of this manuscript. For more information about ASCO’s conflict of interest policy, please refer to www.asco.org/rwc or ascopubs.org/po/author-center.
No other potential conflicts of interest were reported.
REFERENCES
- 1.Fisher B, Anderson S, Bryant J, et al. : Twenty-year follow-up of a randomized trial comparing total mastectomy, lumpectomy, and lumpectomy plus irradiation for the treatment of invasive breast cancer. N Engl J Med 347:1233–1241, 2002 [DOI] [PubMed] [Google Scholar]
- 2.Kao J, Lavaf A, Teng MS, et al. : Adjuvant radiotherapy and survival for patients with node-positive head and neck cancer: An analysis by primary site and nodal stage. Int J Radiat Oncol Biol Phys 71:362–370, 2008 [DOI] [PubMed] [Google Scholar]
- 3.Creutzberg CL, van Putten WLJ, Wárlám-Rodenhuis CC, et al. : Outcome of high-risk stage IC, grade 3, compared with stage I endometrial carcinoma patients: The Postoperative Radiation Therapy in Endometrial Carcinoma trial. J Clin Oncol 22:1234–1241, 2004 [DOI] [PubMed] [Google Scholar]
- 4.Bui DL, Yu JB: Trends in adjuvant and neoadjuvant radiotherapy for cancer treatment from 1973 to 2011. Cancer J 21:147–149, 2015 [DOI] [PubMed] [Google Scholar]
- 5.Frykholm GJ, Glimelius B, Påhlman L: Preoperative or postoperative irradiation in adenocarcinoma of the rectum: Final treatment results of a randomized trial and an evaluation of late secondary effects. Dis Colon Rectum 36:564–572, 1993 [DOI] [PubMed] [Google Scholar]
- 6.Sauer R, Becker H, Hohenberger W, et al. : Preoperative versus postoperative chemoradiotherapy for rectal cancer. N Engl J Med 351:1731–1740, 2004 [DOI] [PubMed] [Google Scholar]
- 7.El-Monim HA, El-Baradie MM, Younis A, et al. : A prospective randomized trial for postoperative vs. preoperative adjuvant radiotherapy for muscle-invasive bladder cancer. Urol Oncol 31:359–365, 2013 [DOI] [PubMed] [Google Scholar]
- 8.O’Sullivan B, Davis AM, Turcotte R, et al. : Preoperative versus postoperative radiotherapy in soft-tissue sarcoma of the limbs: A randomised trial. Lancet 359:2235–2241, 2002 [DOI] [PubMed] [Google Scholar]
- 9.Miccio JA, Oladeru OT, Yang J, et al. : Neoadjuvant vs. adjuvant treatment of Siewert type II gastroesophageal junction cancer: An analysis of data from the Surveillance, Epidemiology, and End Results (SEER) registry. J Gastrointest Oncol 7:403–410, 2016 [DOI] [PMC free article] [PubMed] [Google Scholar]
- 10.Hong JC, Murphy JD, Wang SJ, et al. : Chemoradiotherapy before and after surgery for locally advanced esophageal cancer: A SEER-Medicare analysis. Ann Surg Oncol 20:3999–4007, 2013 [DOI] [PubMed] [Google Scholar]
- 11.Koshy M, Goloubeva O, Suntharalingam M: Impact of neoadjuvant radiation on survival in stage III non-small-cell lung cancer. Int J Radiat Oncol Biol Phys 79:1388–1394, 2011 [DOI] [PubMed] [Google Scholar]
- 12.Roth SL, Audretsch W, Bojar H, et al. : Retrospective study of neoadjuvant versus adjuvant radiochemotherapy in locally advanced noninflammatory breast cancer: Survival advantage in cT2 category by neoadjuvant radiochemotherapy. Strahlenther Onkol 186:299–306, 2010 [DOI] [PubMed] [Google Scholar]
- 13.Al-Absi E, Farrokhyar F, Sharma R, et al. : A systematic review and meta-analysis of oncologic outcomes of preversus postoperative radiation in localized resectable soft-tissue sarcoma. Ann Surg Oncol 17:1367–1374, 2010 [DOI] [PubMed] [Google Scholar]
- 14.Formenti SC, Demaria S: Radiotherapy effects on anti-tumor immunity: Implications for cancer treatment. Front Oncol 3:128, 2013 [DOI] [PMC free article] [PubMed] [Google Scholar]
- 15.Formenti SC, Demaria S: Combining radiotherapy and cancer immunotherapy: A paradigm shift. J Natl Cancer Inst 105:256–265, 2013 [DOI] [PMC free article] [PubMed] [Google Scholar]
- 16.Reits EA, Hodge JW, Herberts CA, et al. : Radiation modulates the peptide repertoire, enhances MHC class I expression, and induces successful antitumor immunotherapy. J Exp Med 203:1259–1271, 2006 [DOI] [PMC free article] [PubMed] [Google Scholar]
- 17.Ciernik IF, Romero P, Berzofsky JA, et al. : Ionizing radiation enhances immunogenicity of cells expressing a tumor-specific T-cell epitope. Int J Radiat Oncol Biol Phys 45:735–741, 1999 [DOI] [PubMed] [Google Scholar]
- 18.Vatner RE, Cooper BT, Vanpouille-Box C, et al. : Combinations of immunotherapy and radiation in cancer therapy. Front Oncol 4:325, 2014 [DOI] [PMC free article] [PubMed] [Google Scholar]
- 19.Teng F, Mu D, Meng X, et al. : Tumor infiltrating lymphocytes (TILs) before and after neoadjuvant chemoradiotherapy and its clinical utility for rectal cancer. Am J Cancer Res 5:2064–2074, 2015 [PMC free article] [PubMed] [Google Scholar]; 19a. Poleszczuk JT, Luddy K, Chen L, et al. : Neoadjuvant radiotherapy of early-stage breast cancer and long-term disease-free survival. Breast Cancer Res 19:75, 2017 [DOI] [PMC free article] [PubMed] [Google Scholar]
- 20.Cox DR: Regression models and life-tables. J R Stat Soc B 34:187–220, 1972 [Google Scholar]
- 21.Kuznetsov VA, Knott GD: Modeling tumor regrowth and immunotherapy. Math Comput Model 33:1275–1287, 2001 [Google Scholar]
- 22.Poleszczuk JT, Luddy KA, Prokopiou S, et al. : Abscopal benefits of localized radiotherapy depend on activated T-cell trafficking and distribution between metastatic lesions. Cancer Res 76:1009–1018, 2016 [DOI] [PubMed] [Google Scholar]
- 23.Belka C, Marini P, Budach W, et al. : Radiation-induced apoptosis in human lymphocytes and lymphoma cells critically relies on the up-regulation of CD95/Fas/APO-1 ligand. Radiat Res 149:588–595, 1998 [PubMed] [Google Scholar]
- 24.Prise KM, O’Sullivan JM: Radiation-induced bystander signalling in cancer therapy. Nat Rev Cancer 9:351–360, 2009 [DOI] [PMC free article] [PubMed] [Google Scholar]
- 25.Formenti SC, Demaria S: Systemic effects of local radiotherapy. Lancet Oncol 10:718–726, 2009 [DOI] [PMC free article] [PubMed] [Google Scholar]
- 26.Kaur P, Asea A: Radiation-induced effects and the immune system in cancer. Front Oncol 2:191, 2012 [DOI] [PMC free article] [PubMed] [Google Scholar]
- 27.Weichselbaum RR, Liang H, Deng L, et al. : Radiotherapy and immunotherapy: A beneficial liaison? Nat Rev Clin Oncol 14:365–379, 2017 [DOI] [PubMed] [Google Scholar]
- 28.Golden EB, Apetoh L: Radiotherapy and immunogenic cell death. Semin Radiat Oncol 25:11–17, 2015 [DOI] [PubMed] [Google Scholar]
- 29.Guerrero M, Li XA: Analysis of a large number of clinical studies for breast cancer radiotherapy: Estimation of radiobiological parameters for treatment planning. Phys Med Biol 48:3307–3326, 2003 [DOI] [PubMed] [Google Scholar]
- 30.Enderling H, Park D, Hlatky L, et al. : The importance of spatial distribution of stemness and proliferation state in determining tumor radioresponse. Math Model Nat Phenom 4:117–133, 2009 [Google Scholar]
- 31.Eftimie R, Macnamara CK, Dushoff J, et al. : Bifurcations and chaotic dynamics in a tumour-immune-virus system. Math Model Nat Phenom 11:65–85, 2016 [Google Scholar]
- 32.Fowler JF: The linear-quadratic formula and progress in fractionated radiotherapy. Br J Radiol 62:679–694, 1989 [DOI] [PubMed] [Google Scholar]
- 33.Lee SP, Leu MY, Smathers JB, et al. : Biologically effective dose distribution based on the linear quadratic model and its clinical relevance. Int J Radiat Oncol Biol Phys 33:375–389, 1995 [DOI] [PubMed] [Google Scholar]
- 34.Sachs RK, Hahnfeld P, Brenner DJ: The link between low-LET dose-response relations and the underlying kinetics of damage production/repair/misrepair. Int J Radiat Biol 72:351–374, 1997 [DOI] [PubMed] [Google Scholar]
- 35.Rockwell S, Dobrucki IT, Kim EY, et al. : Hypoxia and radiation therapy: Past history, ongoing research, and future promise. Curr Mol Med 9:442–458, 2009 [DOI] [PMC free article] [PubMed] [Google Scholar]
- 36.Alfonso JC, Jagiella N, Núñez L, et al. : Estimating dose painting effects in radiotherapy: A mathematical model. PLoS One 9:e89380, 2014 [DOI] [PMC free article] [PubMed] [Google Scholar]
- 37.Schnarr K, Dayes I, Sathya J, et al. : Individual radiosensitivity and its relevance to health physics. Dose Response 5:333–348, 2007 [DOI] [PMC free article] [PubMed] [Google Scholar]
- 38.Dewey WC, Ling CC, Meyn RE: Radiation-induced apoptosis: Relevance to radiotherapy. Int J Radiat Oncol Biol Phys 33:781–796, 1995 [DOI] [PubMed] [Google Scholar]
- 39.Cui YF, Gao YB, Yang H, et al. : Apoptosis of circulating lymphocytes induced by whole body gamma-irradiation and its mechanism. J Environ Pathol Toxicol Oncol 18:185–189, 1999 [PubMed] [Google Scholar]
- 40.Prokopiou S, Moros EG, Poleszczuk J, et al. : A proliferation saturation index to predict radiation response and personalize radiotherapy fractionation. Radiat Oncol 10:159, 2015 [DOI] [PMC free article] [PubMed] [Google Scholar]
- 41.Gameiro SR, Jammeh ML, Wattenberg MM, et al. : Radiation-induced immunogenic modulation of tumor enhances antigen processing and calreticulin exposure, resulting in enhanced T-cell killing. Oncotarget 5:403–416, 2014 [DOI] [PMC free article] [PubMed] [Google Scholar]
- 42.Lanzavecchia A, Sallusto F: Dynamics of T lymphocyte responses: Intermediates, effectors, and memory cells. Science 290:92–97, 2000 [DOI] [PubMed] [Google Scholar]
- 43.Lugade AA, Moran JP, Gerber SA, et al. : Local radiation therapy of B16 melanoma tumors increases the generation of tumor antigen-specific effector cells that traffic to the tumor. J Immunol 174:7516–7523, 2005 [DOI] [PubMed] [Google Scholar]
- 44.Dewan MZ, Galloway AE, Kawashima N, et al. : Fractionated but not single-dose radiotherapy induces an immune-mediated abscopal effect when combined with anti-CTLA-4 antibody. Clin Cancer Res 15:5379–5388, 2009 [DOI] [PMC free article] [PubMed] [Google Scholar]
- 45.Leroi N, Sounni NE, Van Overmeire E, et al. : The timing of surgery after neoadjuvant radiotherapy influences tumor dissemination in a preclinical model. Oncotarget 6:36825–36837, 2015 [DOI] [PMC free article] [PubMed] [Google Scholar]
- 46.Formenti SC, Demaria S: Radiation therapy to convert the tumor into an in situ vaccine. Int J Radiat Oncol Biol Phys 84:879–880, 2012 [DOI] [PMC free article] [PubMed] [Google Scholar]
- 47.Demaria S, Formenti SC: Can abscopal effects of local radiotherapy be predicted by modeling T cell trafficking? J Immunother Cancer 4:29, 2016 [DOI] [PMC free article] [PubMed] [Google Scholar]
- 48.Ho DE, Imai K, King G, et al. : MatchIt: Nonparametric preprocessing for parametric causal inference. J Stat Softw 42:1–28, 2011 [Google Scholar]
- 49.Matzavinos A, Chaplain MA, Kuznetsov VA: Mathematical modelling of the spatio-temporal response of cytotoxic T-lymphocytes to a solid tumour. Math Med Biol 21:1–34, 2004 [DOI] [PubMed] [Google Scholar]
- 50.de Pillis LG, Radunskaya AE, Wiseman CL: A validated mathematical model of cell-mediated immune response to tumor growth. Cancer Res 65:7950–7958, 2005 [DOI] [PubMed] [Google Scholar]
- 51.d’Onofrio A: A general framework for modeling tumor-immune system competition and immunotherapy: Mathematical analysis and biomedical inferences. Physica D 208:220–235, 2005 [Google Scholar]
- 52.Eftimie R, Bramson JL, Earn DJ: Interactions between the immune system and cancer: A brief review of non-spatial mathematical models. Bull Math Biol 73:2–32, 2011 [DOI] [PubMed] [Google Scholar]
- 53.Reppas AI, Alfonso JC, Hatzikirou H: In silico tumor control induced via alternating immunostimulating and immunosuppressive phases. Virulence 7:174–186, 2016 [DOI] [PMC free article] [PubMed] [Google Scholar]
- 54.Robertson-Tessi M, El-Kareh A, Goriely A: A mathematical model of tumor-immune interactions. J Theor Biol 294:56–73, 2012 [DOI] [PubMed] [Google Scholar]
- 55.Wilkie KP: A review of mathematical models of cancer-immune interactions in the context of tumor dormancy. Adv Exp Med Biol 734:201–234, 2013 [DOI] [PubMed] [Google Scholar]
- 56.Hatzikirou H, Alfonso JC, Mühle S, et al. : Cancer therapeutic potential of combinatorial immuno- and vasomodulatory interventions. J R Soc Interface 12:20150439, 2015 [DOI] [PMC free article] [PubMed] [Google Scholar]
- 57.Hatzikirou H, López Alfonso JC, Leschner S, et al. : Therapeutic potential of bacteria against solid tumors. Cancer Res 77:1553–1563, 2017 [DOI] [PubMed] [Google Scholar]
- 58.Walker R, Enderling H: From concept to clinic: Mathematically informed immunotherapy. Curr Probl Cancer 40:68–83, 2016 [DOI] [PubMed] [Google Scholar]
- 59.Benzekry S, Lamont C, Barbolosi D, et al. : Mathematical modeling of tumor-tumor distant interactions supports a systemic control of tumor growth. Cancer Res 77:5183–5193, 2017 [DOI] [PMC free article] [PubMed] [Google Scholar]
- 60.Serre R, Benzekry S, Padovani L, et al. : Mathematical modeling of cancer immunotherapy and its synergy with radiotherapy. Cancer Res 76:4931–4940, 2016 [DOI] [PubMed] [Google Scholar]
- 61.Walker R, Poleszczuk J, Pilon-Thomas S, et al. : Immune interconnectivity of anatomically distant tumors as a potential mediator of systemic responses to local therapy. Sci Rep 8:9474, 2018 [DOI] [PMC free article] [PubMed] [Google Scholar]
- 62.Serre R, Barlesi F, Muracciole X, et al. : Immunologically effective dose: A practical model for immuno-radiotherapy. Oncotarget 9:31812–31819, 2018 [DOI] [PMC free article] [PubMed] [Google Scholar]
- 63.Poleszczuk J, Enderling H: The optimal radiation dose to induce robust systemic anti-tumor immunity. Int J Mol Sci 19:E3377, 2018 [DOI] [PMC free article] [PubMed] [Google Scholar]
Associated Data
This section collects any data citations, data availability statements, or supplementary materials included in this article.


