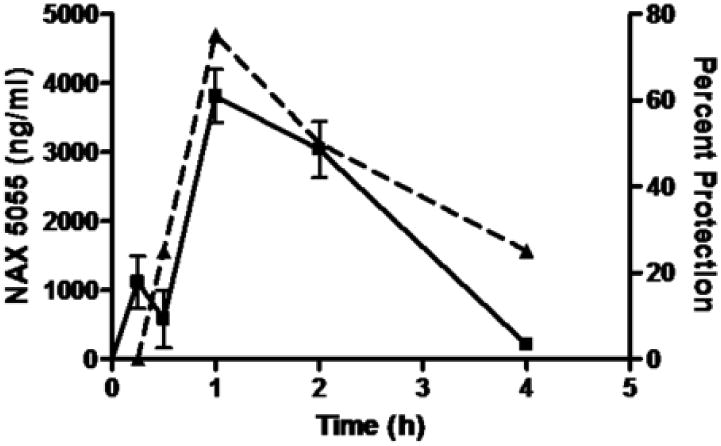
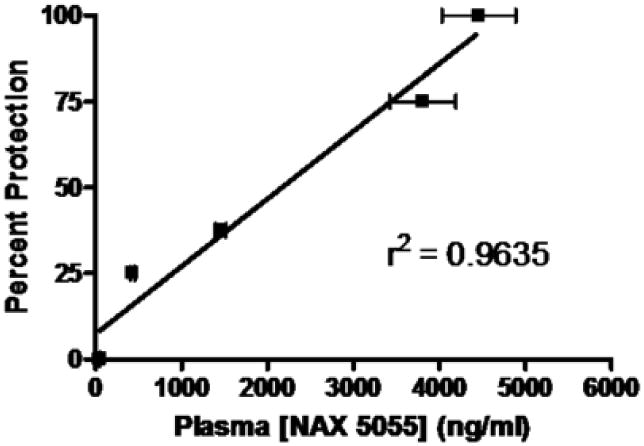
Figure 4.


Pharmacokinetic analysis of NAX 5055 in CF-1 mice. A) time-dependent changes of NAX 5055 (solid line) following a bolus intraperitoneal administration of 2 mg/kg dose. Dash line represents a time-response of NAX 5055 at the same dose in protecting mice from seizures in the 6 Hz (32 mA) seizure model. B) a linear correlation between plasma levels of NAX 5055 and percent of seizure protection at doses 0.1, 0.25, 0.5, 2 and 4 mg/kg. Plasma levels were determined at 1 h after the administration of NAX 5055.
