Abstract
Objective
Studies showing improved outcomes with tight glycemic control in the intensive care unit (ICU) have resulted in a substantial number of new insulin delivery algorithms being proposed. The present study highlights mechanisms used in the better-known approaches, examines what might be critical differences among them, and uses systems theory to characterize the conditions under which each can be expected to perform best.
Methods
Algorithm dose (ΔI/ΔG) and step (response to a persistent elevation in glucose) response curves were calculated for written instruction algorithms, developed at the Providence Heart and Vascular Institute (Portland [P] protocol), the University of Washington (UW), and Yale University (Y), together with similar curves for the Glucommander (GM) and proportional integral derivative (PID) computer algorithms. From the simulated curves, different mechanisms used to adjust insulin delivery were identified.
Results
All algorithms increased insulin delivery in response to persistent hyperglycemia, but the mechanism used altered the algorithm’s sensitivity to glucose, or gain, in the GM, UW, and Y protocols, while leaving it unchanged for the P protocol and PID algorithm.
Conclusions
The increase in insulin delivery in response to persistent hyperglycemia observed with all the algorithms can be expected to bring subjects who respond to insulin to targeted glucose ranges. However, because the PID and P protocols did not alter the insulin delivery response curves, these algorithms can be expected to take longer to achieve target glucose levels in individuals who are insulin resistant and/or are exposed to increased carbohydrate loads (e.g., glucose infusions). By contrast, the GM, UW, and Y algorithms can be expected to adapt to the insulin resistance such that the time to achieve target levels is unchanged if the time for insulin to act does not change. If the insulin resistance is accompanied by a longer time for insulin to act, the UW, Y, and GM algorithms may increase the risk of hypoglycemia. Under these conditions, the longer time required for the PID and P protocols to achieve a target glucose level may be a reasonable trade-off for no increase in the risk of hypoglycemia.
Keywords: cardiac surgery, closed-loop insulin delivery, continuous glucose monitoring, tight glycemic control
Introduction
The importance of tight glycemic control in the intensive care unit (ICU) has resulted in numerous protocols and algorithms for adjusting intravenous insulin delivery. The algorithms are typically implemented as written instructions, with calculations performed bedside by ICU staff whenever a new glucose value is available—typically every 1 to 4 h. Of the algorithms routinely used, the majority have been developed and tested based on the experiences of nurses and doctors at different institutions. Well-established examples include the Portland (P) protocol1 designed for a surgical cardiac ICU, an algorithm developed at the University of Washington (UW)2 used for any hyperglycemic ICU patient, and another developed at Yale University (Y)3 and implemented in the medical ICU. However, these represent only a sampling of algorithms in use.4–6
An alternative to the “written instruction with bedside calculation” approach is to use a computer. The Glucommander (GM) algorithm, developed by Davidson and colleagues was the first such algorithm to be widely studied.7 Since its appearance, other more computationally intensive algorithms derived from control theory have been clinically evaluated. These include the proportional integral derivative (PID) algorithm evaluated at Stanford,8 a model predictive control (MPC) algorithm developed by Hovorka et al.,9,10 and an algorithm described only as utilizing “engineering control math.”11 Control theory/mathematics has long been advocated for managing blood glucose,12 and recent computer simulations have highlighted the potential benefit of the approach.13
While computerized algorithms utilizing advanced control theory have the potential to aid in achieving tight glycemic control, it is possible that experience gained at the medical institutions using the more intuitive “written instruction” algorithms may be undervalued. Solutions to problems encountered while developing the written protocols may provide critical insight into how more advanced engineering control algorithms might be best implemented in the clinic. It is also fair to ask, why so many different algorithms? Theoretically, an algorithm used at one institution should work at a different institution with only minor adjustments needed for different blood glucose targets, use of pressors or intravenous dextrose infusion, and differences in patient population. However, at present, no single protocol or algorithm has been established as the most effective or most adaptable for maintaining tight glycemic control across varying medical contexts. The objective of the present study was to review some of the underlying mechanisms used in existing algorithms, highlight what might be common and/or critical differences among them, and establish “intuitive” control-theory arguments for why one approach would be expected to perform better than another under different physiologic conditions.
Methods
Three written instruction algorithms—P,1 UW,2 and Y3— were chosen as representative examples of common mechanisms (see Appendices A–E for a description of each). Initial recommendations were analyzed for glucose levels between 100 and 400 mg/dl, creating the equivalent of an “algorithm dose response” curve that reflects each algorithm’s insulin dose assignment in response to a given glucose value (as opposed to a “subject dose response” curve, which is usually defined as the glucose response to a given dose of insulin). The primary objective here was to determine if there were significant differences in the shape of the curves. Although the absolute insulin delivery rate was considered important, absolute delivery rate can be varied using a single scaling parameter (gain) and was, therefore, considered to be of secondary importance.
Initial Insulin Recommendation
To assess the shape of each curve, the initial insulin recommendations (represented by IR) for varying glucose (represented by G) levels were fitted to first- (IR=b•G+a) and second- (IR=c•G2+b•G+a) order polynomials with parameters a, b, and c obtained by least squares (GraphPad Software Version 5, San Diego, CA). In each case, delivery for a change in glucose (ΔI/ΔG), was obtained from the fitted equations as the first derivative (b for the first-order equation and 2c•G + b for the second-order equation).
Algorithm Responses to a Fall in Glucose
Each algorithm’s response to a fall in glucose (ΔI/ΔG) was obtained assuming an initial blood glucose level of 180 mg/dl and a decrease in blood glucose on the subsequent blood sample. A response curve was also obtained for a subject whose glucose was assumed to be persistently elevated at 180 mg/dl (analogous to performing a hyperglycemic clamp14). Similar analyses were performed for GM7 and PID8 computer algorithms.
Results
Initial Insulin Recommendations
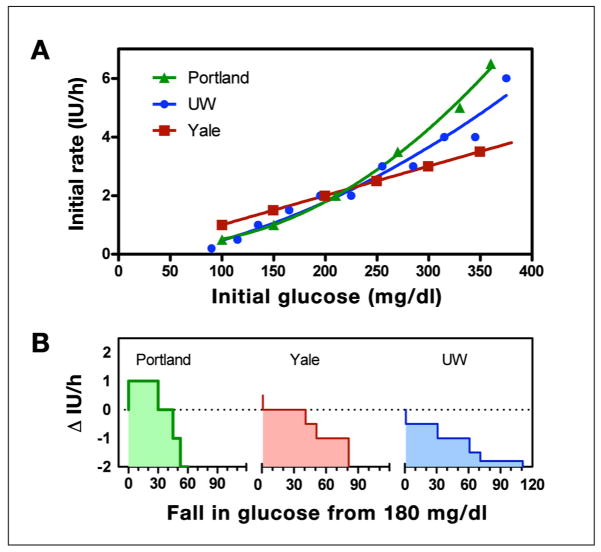
All three written instruction algorithms increased the initial insulin rate as the starting glucose level increased (Figure 1A). However, the UW and P protocol increases were curvilinear (−0.2827 + 0.004799 G + 2.772 × 10⁻⁵ G2, r2 = 0.9597 and 0.4454 − 0.005362 G + 6.042 × 10⁻⁵ G2, r2 = 0.9964, respectively) whereas the Y protocol was, by definition, a straight line [glucose in mg/dl divided by 100 and rounded to the nearest 0.5 international unit (of insulin) IU/h].
Figure 1.
(A) Insulin delivery rate (initial recommendation) for the UW (blue), P (green), and Y (red) protocols at varying initial glucose values. The P and UW protocols curve upward with increasing glucose level (solid curves show polynomial fits), whereas the Y protocol increases linearly (straight line fit). (B) (Recommended change in infusion rate for each protocols, assuming that the subject begins therapy at 180 mg/dl but with a subsequent blood glucose reading the same or decreased. Dotted line corresponds to a starting rate of 2 IU/h.
Algorithm Responses to a Fall in Glucose
For an initial glucose of 180 mg/dl, each algorithm provided the same initial recommendation (2 IU/h, indicated by the dashed line in Figure 1B); however, when the subject’s glucose level was hypothesized to decrease on the subsequent sample, each algorithm suggested changes that differed both in magnitude and direction. The P protocol recommended an increase in the insulin rate for decreases in glucose less than 30 mg/dl, the Y algorithm recommended the insulin delivery rate not be changed for a decrease in glucose less than 40 mg/dl, and the UW protocol recommended a decrease for any fall in glucose. To understand the logic underlying the different recommendations, despite identical conditions, a more detailed analysis of each algorithm was performed.
University of Washington Algorithm
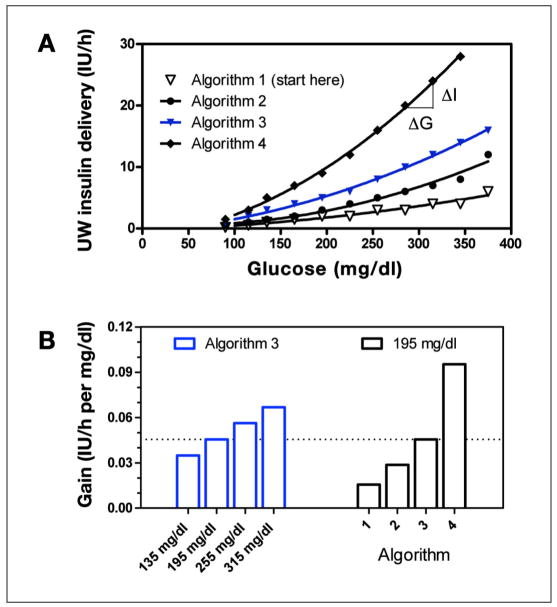
The recommendation to decrease insulin delivery made by the UW algorithm was based on the Algorithm 1 curve shown in Figure 2A. The UW algorithm initializes therapy on this curve but switches to more aggressive curves, depending on the past history of hyperglycemia. However, while operating on an individual curve, any decrease in the glucose leads to a decrease in the recommended insulin rate. The relative magnitude of decrease—defined here as gain or ΔI/ΔG—increased at high glucose concentrations for all curves (for Algorithms 2–4 in Figure 2A, fitted curves 0.6960 + −0.007650 G + 9.306 × 10⁻⁵ G2 with r2 = 0.9753; −0.4630 + 0.01100 G + 8.871 × 10⁻⁵ G2 with r2 = 0.9977; and −1.482 + 0.01686 G + 0.0002010 G2 with r2 =0.9986, respectively). The curvilinear relation results, for the case of Curve 3, in an increase in a gain increase from ~0.03 to 0.06 IU/h per mg/dl as glucose increases from 135 to 315 mg/dl (Figure 2B, left bars). The ability to switch between curves in response to persistent hyper- glycemia—defined as glucose above the range of 80–180 without a 60 mg/dl decrease in glucose over 1 h—also leads to an increase in gain over time. For example, at a glucose level of 195 mg/dl, gain increases from ~0.015 to 0.09 IU/h per mg/dl (Figure 2B, right bars) as the curve is incremented from Algorithm 1 to Algorithm 4. This mechanism is sometimes referred to as “winding up” the gain in control systems literature. Decreases in gain, or winding down, occur in response to repeat occurrences of glucose less than 70 mg/dl.
Figure 2.
(A) Graphical representation of the different sliding scales used in the UW protocol. Solid curves indicate polynomial fits. (B) Algorithm gain (ΔI/ΔG) as glucose increases from 135 to 315 mg/dl along the Algorithm 3 curve (left bars, blue) and as glucose remains fixed at 195 mg/dl, but the curve changes from Algorithm 1 to Algorithm 4 (right bars).
Portland Protocol
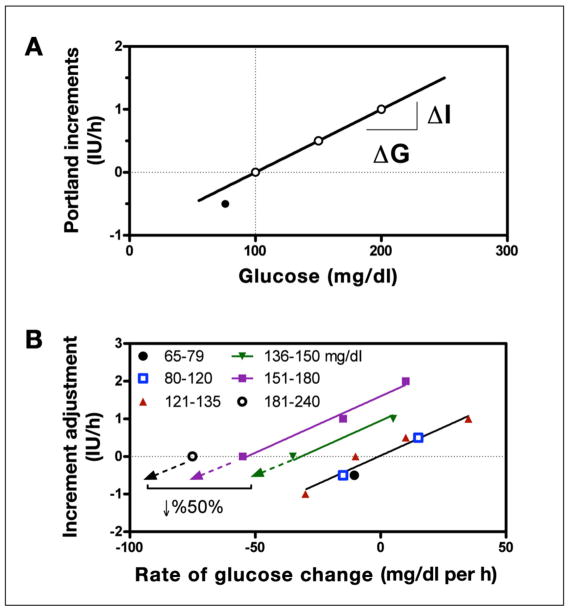
Contrasting the decrease in insulin recommended by the UW algorithm, the P protocol recommended an increase in the insulin rate for any decrease in glucose less than 30 mg/dl (Figure 1B). Above the target range, the algorithm recommends incrementing the delivery upward in proportion to glucose [at an increment of 0.001 IU/h per mg/dl above target with r2 = 1 (Figure 3A)]. Thus, as glucose falls to target, the recommended increment may become smaller, but if the glucose is elevated and not falling, the increment is still positive. For glucose below target, the decrement is greater than that which would occur for an equivalent amount of glucose above target (Figure 3A, closed circle). Increments are also modified in proportion to the prevailing glucose “rate of change” (0.03 IU/h per mg/dl per h (Figure 3B) irrespective of the glucose level (common slope for all glucose ranges, with r2 = 0.97). The use of two incremental components, one proportional to glucose and one proportional to its rate of change, results in an implicit “desired rate of fall” that increases at higher glucose values (regression lines for rate-adjusted delivery have common slope but cross the x axis at different desired rates of fall, with desired rate occurring when the two components are equal). However, the desired rate of fall is itself proportional to the glucose range. This can be verified from the written instructions (Appendix A) by observing that at glucose values of 136, 150, 181, and 240 mg/dl, no change in delivery is made when glucose is falling 21, 30, 50, and 101 mg/dl per h. The relationship, although only four points, effectively follows a straight line (r2 = 0.996, with regression not shown).
Figure 3.
(A) Incremental changes in insulin used by the P protocol in response to the prevailing glucose. For glucose above target (dashed vertical line) the change is proportional to glucose (solid line, 0.01 IU/h per mg/dl with r2 = 1) but double that when glucose is below target (solid circle, −0.5 IU/h for a drop or 25 mg/dl = 0.02 IU/h per mg/dl). (B) Adjustments in the increment based on the rate of change of glucose calculated for different glucose ranges (symbols). Within each range, the adjustment is approximately proportional to rate of change (0.03 IU/h per mg/dl per h with slope common to all lines and r2 = 0.97) but with the target rate of change (X-intercept) increasing from 0 in the glucose range of 65 and 120 to 75 mg/dl per h in the range of 181 and 240 mg/dl.
Yale Protocol
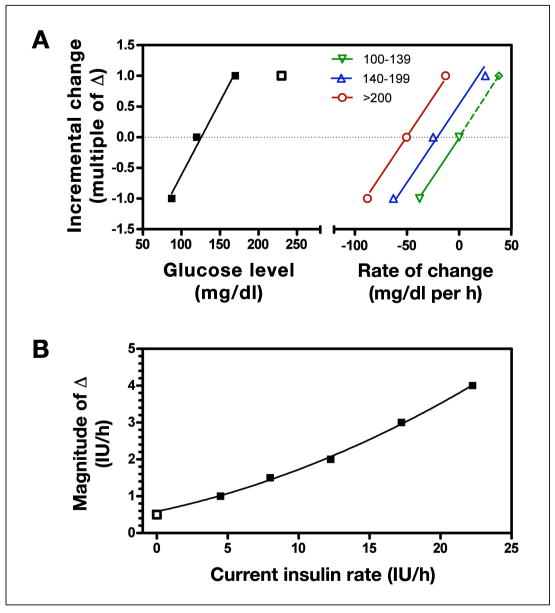
The Y protocol does not recommend decreasing the insulin delivery rate until glucose decreases by more than 40 mg/dl (Figure 1B); however, any change made thereafter is incremental, with the increment being proportional to glucose under all conditions other than the highest glucose value (Figure 4A, left of broken axis, closed squares) but saturating at higher values (Figure 4A, left of broken axis, open square). Like the P protocol, the Y algorithm adjusts the increment size based on the rate of change of glucose (Figure 4A, right of broken axis). However, unlike the P protocol, the Y algorithm adjusts the incremental gain in relation to the prevailing insulin delivery rate (Figure 4B). For example, if the glucose level increases from 100 to 140 mg/dl, the algorithm gain could be as low as 0.0125 IU/h per mg/dl (0.5 IU/h per 40 mg/dl) or as high as 0.125 IU/h per mg/dl (5 IU/h per 40 mg/dl), depending on the prevailing insulin rate.
Figure 4.
(A) Incremental changes in insulin for the Y protocol (data to left of split axis). Solid line indicates that the change is approximately proportional to glucose for values up to ~150 mg/dl, but values higher than 150 mg/dl (open squares) produces the same incremental change (1Δ). Curves to the right of the split axis show adjustments made based on the rate of change of glucose (0.025Δ per mg/dl per h, with slope common to all glucose ranges). (B) Change in magnitude of the increment (Δ) based on current insulin delivery rate (symbols) with corresponding quadratic polynomial fit (solid curve).
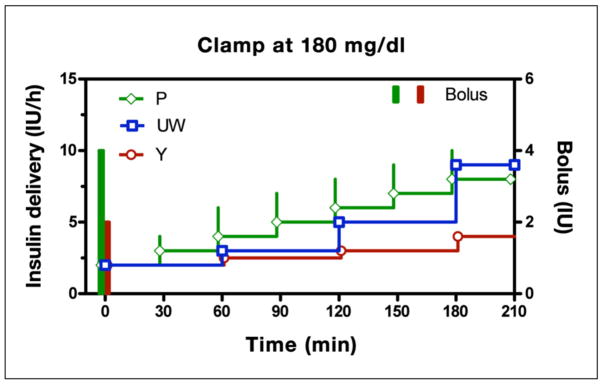
Despite differences in their underlying logic, all three written-instruction protocols effect slow increases in insulin delivery in response to persistent hyperglycemia (Figure 5, glucose clamped at 180 mg/dl). In the P Protocol, the initial infusion (2 IU/h) is started concomitantly with a 4 IU bolus, equivalent to a priming ratio of 2 h (priming ratio = initial bolus/initial infusion rate) and is thereafter increased 1 IU/h each 0.5 h (increment size remains unchanged over time). Although the Y and UW algorithms also increase slowly over time, important differences can be observed. First, the priming ratio is fixed at 1 h in the Y protocol but is varied in the P protocol in relation to the prevailing glucose level (1.71 h for glucose 181–240 mg/dl, 1.6 h for glucose 241–300 mg/dl, 1.85 h for glucose 301–360 mg/dl, and 2 h for all glucose levels above 360 mg/dl; see Appendix C); the UW protocol does not initiate therapy with a priming bolus. Second, adjunctive insulin boluses are only recommended at the initiation of insulin therapy (bolus + initial infusion rate) in the Y protocol but may be recommended for all subsequent incremental changes in the P protocol. Third, in the UW and Y protocols, the incremental steps increase with time, whereas each step has the same magnitude in the P Protocol. In the UW protocol, the relative increase in insulin size is due to larger step sizes between successive changes in algorithm curves (Figure 2B), whereas for the Y protocol, the increase is related to the insulin infusion rate (higher insulin rates lead to increase increment size; see Figure 4B).
Figure 5.
Recommended insulin delivery rates for the P, UW, and Y algorithms assuming a subject initiates therapy at 180 mg/dl and does not respond to insulin (analogous to a hyperglycemic clamp). Portland protocol is shifted back in time by 2 min and the Y protocol forward by 2 min to prevent overlap of symbols. All algorithms effect a continuous rise in delivery. The Y and P algorithms initiate therapy with a concomitant bolus. The P protocol continues with adjunctive boluses on each incremental step.
Glucommander and Proportional Integral Derivative Algorithms
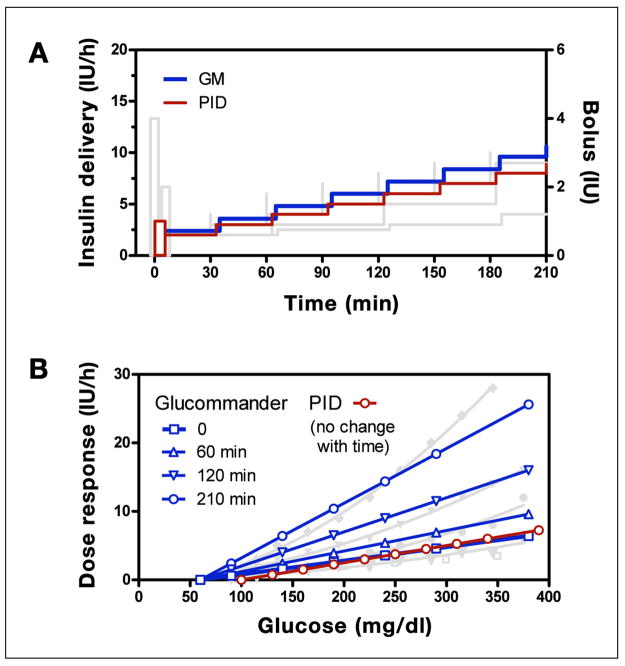
Recommendations obtained with the GM and PID computer algorithms were similar to those obtained with the written instruction algorithms (Figure 6A shows persistent hyperglycemia). However, as with the written instructions, differences were observed in the mechanism used to effect the increase in insulin and in how the infusion was initiated. For the PID algorithm, the derivative component generated a priming bolus when initiating the infusion (ratio of bolus to infusion rate = 0.5 h, adjustable by parameter TD in Appendix E), and the integral component increased delivery in equal increments (2 IU/h every TI min, with TI = 60 min). In contrast, the GM algorithm did not initiate the infusion with a bolus, and the magnitude of the increments increased over time. The increase in increment size resulted in changes in dose response characteristics at 60, 120, and 210 min approximating (linear) those observed with the UW protocol (Figure 6B). As shown, the starting GM curve (open square) approximately overlaps the PID curve (open circle), and both curves overlap with the P curve and initial UW curve. The PID curve, like the P curve, does not change over time.
Figure 6.
(A) GM (blue) and PID (red) algorithm responses for a subject initiating therapy at 180 mg/dl with no subsequent change in glucose superimposed with curves for the written instruction algorithms shown in Figure 5 (shaded curves). (B) Glucommander glucose response curves superimposed with similar curves for the UW algorithm shown in Figure 2 together with PID curve.
Discussion
Results from the present study highlight two broad classes of ICU insulin delivery algorithms—those that increase insulin delivery in response to hyperglycemia by increasing the algorithm’s sensitivity to glucose and those that increase insulin delivery by incrementing the rate directly. Algorithms in the first category typically employ multiple sliding scales (UW algorithm) but can be approximated by equations using fewer parameters (GM). Algorithms in the second category typically have written rules for making the incremental adjustments (P protocol), but these too can be approximated with equations (PID). The Y protocol is an example of an algorithm utilizing both mechanisms.
The multiple sliding scale approach used in the UW protocol is representative of a large class of algorithms.15–17 The dose response curves associated with most of the algorithms tend to curve upward at higher glucose levels but can generally be approximated by straight lines (analysis not shown). The essential feature is not that the curves become more aggressive at high glucose levels, rather it is that the algorithms can change curves at the same glucose level—a characteristic that is well-captured by the GM algorithm7 (see Figure 6). This feature ensures the algorithm will achieve target glucose levels irrespective of any underlying steady-state basal insulin requirement.
In contrast to the UW protocol, the P protocol is representative of a separate class of algorithms that utilize direct incremental changes in the form of new rate = old rate + increment; these are often referred to as learning algorithms and are equally capable of effecting different insulin recommendations at a fixed glucose level(Figure 6). Examples of algorithms utilizing the direct increment mechanism include those implemented in Leuven18 and Northwestern.19 Generally, the increment is proportional to the glucose level, but the proportional relationship does not change over time (with the Y algorithm being an exception). The algorithms often take into account the rate of change of glucose, creating an implicit desired rate at which glucose is to be brought to target.
Ultimately, effecting an increase in insulin delivery through a change in sensitivity (UW protocol and GM), via a direct increment in the rate (P Protocol and PID) or both (Y protocol), leads to an increased insulin delivery in response to a fixed level of hyperglycemia (Figure 6). Algorithms that have this characteristic can be expected to bring all insulin-responsive subjects to target glucose levels. This intuitive observation is true no matter how large or small the increments are, how insulin resistant the subject is, or if the patient is receiving intravenous glucose at levels below maximally stimulated glucose uptake. Insulin-resistant individuals, or algorithms with small increments, can be expected to take longer to achieve target, but the steady-state glucose level cannot be different from target. Generally, if the rise is very steep, the algorithm will achieve target very rapidly, but increasing insulin too quickly will increase the risk of “overshooting” the target range, that is, increase the risk of hypoglycemia. Algorithms that exhibit a slower increase will still bring subjects to target and are likely to have less risk of hypoglycemia but will necessarily have more overall hyperglycemia.
The ability to provide different insulin recommendations for a fixed glucose level is an essential feature for any algorithm being considered for use in individuals with diabetes, since the underlying basal requirement is generally not known. Effectively, all the algorithms considered here have the ability to establish the required basal rate, as can be inferred from the steady increase in delivery observed under simulated clamp conditions (Figure 6). The feature can also be expected to establish the required basal rate in subjects without diabetes whose therapy, or underlying condition, creates sufficient insulin resistance to overwhelm the body’s endogenous insulin response. For these latter cases (nondiabetes), careful consideration of how each individual algorithm “unwinds” its incremental component (required for P and PID algorithms), its sensitivity to glucose (required for UW and GM algorithms), or both (Y algorithm) is required, as the basal requirement can be expected to go to zero as the patients recovers from their underlying conditions. This issue is likely to be better evaluated using simulation involving different models of insulin action20 (a subsequent article is planned, where different models are introduced, and the intuitive/theoretical arguments presented here are revisited).
Of the two algorithms evaluated here that have found application as computer programs, GM captures much of the behavior inherent in the multiple sliding-scale approaches, and PID captures much of the behavior in the fixed-gain incremental approaches. In the present study, GM was able to emulate response curves inherent in the UW protocol with the only substantive difference being that the GM dose response was linear with glucose (straight), and the UW scales curved upward (Figure 6B). Glucommander, which was derived from curves that were effectively linear,15 could be adapted to be curvilinear by utilizing second-order polynomial fits as shown in Figure 2, but it is not clear that this is justifiable based on existing data.
That the P protocol was well fit using incremental components proportional to glucose (Figure 3A with r2 = 1 for glucose in the range of 65–135 mg/dl) and its rate of change (Figure 3B with r2 = 0.97 for glucose in the range of 65–135 mg/dl) suggests that the algorithm’s behavior can be captured by the proportional and integral components of a PID algorithm. Here it is important to note that an incremental change made in proportion to glucose rate of change generates the “proportional component” of a PID controller, not the derivative component. The increase in target rate-of-change at higher glucose levels (Figure 3B) is inherent to any algorithm that gives insulin in response to hyperglycemia and takes insulin away in response to a fall in glucose (effectively the proportional and integral components of a PID algorithm). Aspects of the P protocol not captured by the proportional and integral components of a standard PID algorithm would include the adjunctive boluses given with incremental changes after initiating the algorithm, the larger incremental change when glucose level is below target (solid circle in Figure 3A), and the 50% decrease in insulin when the glucose is falling faster than 50 mg/dl per h (Figure 3B). However, analogous mechanisms to the latter two are present in virtually all PID-like algorithms (often being referred to as “wind-up” protection [see rules described in Reference 8]). Adjunctive boluses with each incremental change may benefit a standard proportional integral algorithm by allowing glucose to be more rapidly brought to target; however, the faster response may increase the risk of hypoglycemic excursions.
In the present examination of algorithms, considerable focus has been placed on determining if an algorithm’s sensitivity to glucose changes over time Intuitively, increasing the algorithm’s sensitivity to glucose is attractive if the increase is can be made proportional to any decrease in the patient’s insulin sensitivity. The rationale for this has previously been put forward by Trence et al.,2 and there is evidence that the pancreatic β cell uses such strategy both acutely21,22 and over longer periods of time.23 From a control-theory perspective, keeping the product of the patient’s “insulin sensitivity” and the algorithm’s “gain” constant should result in identical glucose control in subjects with different insulin sensitivity or whose insulin sensitivity changes over time. While this argument is attractive, it requires that the change in insulin sensitivity not be accompanied by a change in the time for insulin to act. For example, if a 1 IU/h increase in insulin is expected to decrease glucose concentration by 50 mg/dl in 1 h and is later found to only decrease it by 25 mg/dl in 1 h, doubling the algorithm gain should yield identical glucose control (algorithm + patient). However, if the decrease in sensitivity is accompanied by a slower response time, say, a decrease of 25 mg/dl in 3 h, doubling the algorithm gain cannot be assumed to yield an identical patient–algorithm response. From a control-theory perspective, increasing the gain under the latter condition can theoretically lead to lower overall control stability. Although a complete discussion of the interaction between gain, time for action, and control stability requires formal systems analysis (e.g., root locus24), three of the underlying arguments are relatively intuitive: (1) increasing a delay results in less stable control; (2) increasing the product of algorithm gain and subject insulin sensitivity leads to less stable control; and (3) increasing the time between blood samples results in less stable control. It can, therefore, be argued that if an algorithm is used under conditions where the time for insulin to act becomes longer, a fixed gain algorithm such as PID or P may be preferable to algorithms that rely on increasing the gain (e.g., GM or UW). The disadvantage of the fixed-gain approach is that patients with severe insulin resistance will require a longer period to achieve target blood glucose levels.
The PID and GM computer algorithms use mathematical equations that capture the behavior of different written instruction algorithms. The ability to cast an algorithm in “equation form” has several benefits. First, equations reduce the number of parameters needed to describe the algorithm. For example, GM has only five parameters (initial multiplier, multiplier increment, high target, and low target) and, with minor modifications, could behave substantially like any of the multiple sliding-scale algorithms. This can be compared with the UW algorithm that has 47 parameters plus additional rules to move up or down the different scales. Similarly, the PID algorithm has only four parameters to define its basic response (see Appendix E for details). This can be compared to the P protocol, which incorporates 9 glucose ranges, with up to 6 derivative correction parameters in each range, leading to greater than 54 parameters. Reducing the number of parameters, without changing algorithm behavior, can potentially make a single algorithm more adaptable to different ICU environments. Conversely, in attempting to fine-tune an algorithm with 54 an enormous range of adjustments are possible.
The question as to which algorithm type is “best” is unlikely to be answered without a large prospective randomized clinical trial with clear criteria defining the objective. Absent such a study, the question of how to choose an algorithm remains difficult to address. All the algorithms examined in the present study can reasonably be expected to bring subjects to targeted glycemic ranges. The algorithms may achieve target at different times, but the mean time to target could be adjusted by scaling the recommendations up or down with a single gain adjustment. If each algorithm were adjusted to achieve target over the same period of time, the questions would be, which is least likely to result in a hypoglycemic excursion, and which requires the fewest number of staff interventions (timing between blood samples). None of the results or considerations put forth in the present study informs these questions nor is there likely to be a simple or intuitive answer. Similarly, the present examination of algorithms does not address the underlying question of the most appropriate “target range”—a topic for which there remains no definitive guidelines.
Nonetheless, the results presented here do provide a means to make an informed choice of algorithm. Effectively, any algorithm that incrementally increases insulin in response to glucose above target can be expected to normalize subjects to target glucose levels. Algorithms that do so without changing gain (e.g., P protocol and PID) can be expected to bring subjects to target glucose with the lowest risk of hypoglycemia but will take longer to achieve target levels in subjects who are, or who become, insulin resistant. Algorithms that increment insulin by increasing the gain (UW, Y, and GM) can be expected to adapt to the insulin resistance such that the time to achieve target is unchanged, provided that the insulin resistance is not associated with any delay in insulin action. If the delay in insulin action is increased, these algorithms can be expected to have a higher risk of hypoglycemia. Thus, if time for insulin to act is known not to change, algorithms using adaptive gain mechanisms (e.g., UW, Y, and GW) may be preferred, and if it is unknown whether the time of action could change, a fixed-gain approach may be preferable.
While not explicitly considered in the present study, this same reasoning can be used when considering more advanced control algorithms such as MPC.10 An MPC algorithm should be expected to outperform all the algorithms considered here if the model used in the algorithm accurately predicts future glucose excursions (correlation of future prediction with measured glucose equal to 1). This statement is true irrespective of the performance metric used, as the desired metric is typically if the model prediction is less than perfect, i.e., has a correlation with future glucose less than one, improved performance cannot be guaranteed. Model predictive-control algorithms might also be expected to perform well during meals, depending again on how well the model used in the MPC algorithm predicts future glucose values in response to a meal.
The final conclusion that that can be drawn from results presented here is that written instruction algorithms can often be reduced to equations with a smaller number of parameters. Reducing the number of parameters is likely to make any written instruction algorithms more easily adaptable to different ICUs. Equations also increase the resolution of insulin delivery changes and are likely to be more readily interfaced with continuous glucose monitors. Given the increased awareness of the hypoglycemia risk and the added workload required to maintain tight glycemic control, the ability to combine an algorithm with a continuous glucose monitor may play a larger role than choosing, or optimizing, the algorithm itself. Future clinical studies are needed to fully address this point.
Acknowledgments
Funding: Work for the present article was supported by a grant from the National Heart, Lung, and Blood Institute via R01HL88448 (MA).
Abbreviations
- GM
Glucommander
- ICU
intensive care unit
- IU
international unit [of insulin]
- MPC
model predictive control
- P
Portland
- PID
proportional integral derivative
- UW
University of Washington
- Y
Yale
Appendix A Portland Protocol
The P protocol can be accessed from the Portland Diabetic Project website. We have reproduced Version 2007.3, which has been abbreviated (full details with possible updates are available at: http://www.providence.org/Oregon/Programs_and_Services/Heart/portlandprotocol/default.htm
Initial start
| Blood Glucose (BG) | Bolus | |
|---|---|---|
| 110 to 124 mg/dl | 0 | 0 |
| 125 to 150 mg/dl | 2 (for diabetes mellitus patients only) | 1 IU/h |
| 151 to 180 mg/dl | 4 IU | 2 IU/h |
| 181 to 240 mg/dl | 6 IU | 3.5 IU/h |
| 241 to 300 mg/dl | 8 IU | 5 IU/h |
| 301 to 360 mg/dl | 12 IU | 6.5 IU/h |
| Greater than 360 mg/dl | 16 IU | 8 IU/h |
Incremental Changes
Target blood glucose (BG) is 80 to 120 mg/dl.
Check BG every 30 min when BG greater than 150 mg/dl, less than 80 mg/dl, after insulin drip is stopped, or after insulin drip is decreased more than 50%.
Check BG every hour when BG is 80–150 mg/dl.
Check BG every 2 h when BG is 80–120 mg/dl and there is less than 15 mg/dl BG variation over 4 h and insulin rate remains unchanged for 4 h.
| Blood Glucose (mg/dl) | Action |
|---|---|
| Less than 50 |
Stop Insulin
|
| 50 to 64 |
Stop Insulin
|
| 65 to 79 |
|
| 80 to 120 Target range may titrate drip in ICU to maintain this range. |
|
| 121 to 135 |
|
| 136 to 150 |
|
| 151 to 180 |
|
| 181 to 240 |
|
| Greater than 240 |
|
| If BG is greater than 300 for 4 consecutive readings, call MD for additional IV bolus orders. | |
Appendix B University of Washington Protocol
The following is taken from the Society of Hospital Medicine Workbook.4,5
Appendix C Yale Protocol
Yale Insulin Infusion Protocol (abbreviated; adapted from Goldberg PA et al.3)
The Yale protocol targets blood glucose to between 100 and 139 mg/dl. The program is initiated by dividing the initial blood glucose by 100, and then rounding to nearest 0.5 IU for both bolus and infusion. Thereafter, changes are made incrementally based on the glucose range and rate-of-change (Table A1), with the increment size depending on the most recent insulin infusion rate (Table A2).
Table A1.
| BG 75–99 mg/dl | BG 100–139 | BG 140–199 | BG ≥ 200 | Instructions |
|---|---|---|---|---|
| BG ↑ > 50 mg/dl | BG ↑ | ↑ infusion 2Δ | ||
| BG ↑ 1–50 mg/dl or BG unchanged | BG unchanged or BG ↓ 1–25 mg/dl | ↑ infusion Δ | ||
| BG ↑ | BG ↑ 1–50 mg/dl or BG unchanged or BG ↓ 1–50 mg/dl | BG ↓ 1–50 mg/dl | BG ↓ 25–75 mg/dl | No change |
| BG unchanged or BG ↓ by 1–25 mg/dl | BG ↓ 26–50 mg/dl | BG ↓ 51–75 mg/dl | BG ↓ 76–100 mg/dl | ↓ infusion Δ |
| BG ↓ > 25 mg/dl | BG ↓ > 50 mg/dl | BG ↓ > 75 mg/dl | BG ↓ > 100 mg/dl | ↓ infusion 2Δ |
Where Δ is based on the most current rate of infusion:
Table A2.
| Current Rate (IU/h) | Δ = Rate Change (IU/h) | 2Δ = 2 × Rate Change (IU/h) |
|---|---|---|
| <3.0 | 0.5 | 1 |
| 3.0–6.0 | 1.0 | 2 |
| 6.5–9.5 | 1.5 | 3 |
| 10–14.5 | 2 | 4 |
| 15–19.5 | 3 | 6 |
| 20–24.5 | 4 | 8 |
| ≥25 | ≥5 | 10 (consult MD) |
Appendix D Glucommander Protocol
The GM protocol is both published7 and described on the GM website, http://www.glucommander.com/. The following equation is derived from those descriptions with minor modifications to notation (intercept = glucose value at which insulin delivery is zero; K(n) = the multiplier at time n (time of blood sample); and low target and high target bound the desired glucose range.
Appendix E Proportional Integral Derivative Protocol
The PID protocol is described in Reference 8. For the notation below, P(n), I(n), and D(n) refer to the proportional, incremental, and rate of change (derivative) components at time n (n − 1 refers to the previous value). T(n) and T(n − 1) refer to the times at which the current and previous samples are drawn. dBGdt(n) is the estimated rate of change of glucose at time n, and KP, TI, and TD are parameters defining the relative magnitude if each component—referred to as gain, integration time, and derivative time, respectively.24 A forth parameter, target, also needs to be set.
References
- 1.Furnary AP, Wu Y, Bookin SO. Effect of hyperglycemia and continuous intravenous insulin infusions on outcomes of cardiac surgical procedures: the Portland Diabetic Project. Endocr Pract. 2004;10 (Suppl 2):21–33. doi: 10.4158/EP.10.S2.21. [DOI] [PubMed] [Google Scholar]
- 2.Trence DL, Kelly JL, Hirsch IB. The rationale and management of hyperglycemia for in-patients with cardiovascular disease: time for change. J Clin Endocrinol Metab. 2003;88(6):2430–7. doi: 10.1210/jc.2003-030347. [DOI] [PubMed] [Google Scholar]
- 3.Goldberg PA, Siegel MD, Sherwin RS, Halickman JI, Lee M, Bailey VA, Lee SL, Dziura JD, Inzucci SE. Implementation of a safe and effective insulin infusion protocol in a medical intensive care unit. Diabetes Care. 2004;27:461–7. doi: 10.2337/diacare.27.2.461. [DOI] [PubMed] [Google Scholar]
- 4.Wilson M, Weinreb J, Hoo GW. Intensive insulin therapy in critical care: a review of 12 protocols. Diabetes Care. 2007;30(4):1005–11. doi: 10.2337/dc06-1964. [DOI] [PubMed] [Google Scholar]
- 5.Workbook for Improvement: Improving Glycemic Control. Preventing Hypoglycemia, and Optimizing Care of vthe Inpatient with Hyperglycemia and Diabetes. [Accessed March 10, 2008];Society of Hospital Medicine. http://www.hospitalmedicine.org/
- 6.Meijering S, Corstjens AM, Tulleken JE, Meertens JH, Zijlstra JG, Ligtenberg JJ. Towards a feasible algorithm for tight glycaemic control in critically ill patients: a systematic review of the literature. Crit Care. 2006;10(1):R19. doi: 10.1186/cc3981. [DOI] [PMC free article] [PubMed] [Google Scholar]
- 7.Davidson PC, Steed RD, Bode BW. Glucommander: a computer-directed intravenous insulin system shown to be safe, simple, and effective in 120,618 h of operation. Diabetes Care. 2005;28(10):2418–23. doi: 10.2337/diacare.28.10.2418. [DOI] [PubMed] [Google Scholar]
- 8.Wintergerst KA, Deiss D, Buckingham B, Cantwell M, Kache S, Agarwal S, Wilson DM, Steil G. Glucose control in pediatric intensive care unit patients using an insulin-glucose algorithm. Diabetes Technol Ther. 2007;9(3):211–22. doi: 10.1089/dia.2006.0031. [DOI] [PubMed] [Google Scholar]
- 9.Pachler C, Plank J, Weinhandl H, Chassin LJ, Wilinska ME, Kulnik R, Kaufmann P, Smolle KH, Pilger E, Pieber TR, Ellmerer M, Hovorka R. Tight glycaemic control by an automated algorithm with time-variant sampling in medical ICU patients. Intensive Care Med. 2008;34(7):1224–30. doi: 10.1007/s00134-008-1033-8. [DOI] [PubMed] [Google Scholar]
- 10.Cordingley JJ, Vlasselaers D, Dormand NC, Wouters PJ, Squire SD, Chassin LJ, Wilinska ME, Morgan CJ, Hovorka R, Van den Berghe G. Intensive insulin therapy: enhanced Model Predictive Control algorithm versus standard care. Intensive Care Med. 2008 doi: 10.1007/s00134-008-1236-z. [Epub ahead of print.] [DOI] [PubMed] [Google Scholar]
- 11.Saager L, Collins GL, Burnside B, Tymkew H, Zhang L, Jacobsohn E, Avidan M. A randomized study in diabetic patients undergoing cardiac surgery comparing computer-guided glucose management with a standard sliding scale protocol. J Cardiothorac Vasc Anesth. 2008;22(3):377–82. doi: 10.1053/j.jvca.2007.09.013. [DOI] [PubMed] [Google Scholar]
- 12.Parker RS, Doyle FJ, III, Peppas NA. The intravenous route to blood glucose control. IEEE Eng Med Biol Mag. 2001;20:65–73. doi: 10.1109/51.897829. [DOI] [PubMed] [Google Scholar]
- 13.Bequette BW. Analysis of algorithms for intensive care unit blood glucose control. J Diabetes Sci Technol. 2007;1(6):813–24. doi: 10.1177/193229680700100604. [DOI] [PMC free article] [PubMed] [Google Scholar]
- 14.Elahi D. In praise of the hyperglycemic clamp. A method for assessment of B-cell sensitivity and insulin resistance. Diabetes Care. 1996;19:278–86. doi: 10.2337/diacare.19.3.278. [DOI] [PubMed] [Google Scholar]
- 15.Markovitz LJ, Wiechmann RJ, Harris N, Hayden V, Cooper J, Johnson G, Harelstad R, Calkins L, Braithwaite SS. Description and evaluation of a glycemic management protocol for patients with diabetes undergoing heart surgery. Endocr Pract. 2002;8(1):10–8. doi: 10.4158/EP.8.1.10. [DOI] [PubMed] [Google Scholar]
- 16.Osburne RC, Cook CB, Stockton L, Baird M, Harmon V, Keddo A, Pounds T, Lowey L, Reid J, McGowan KA, Davidson PC. Improving hyperglycemia management in the intensive care unit: preliminary report of a nurse-driven quality improvement project using a redesigned insulin infusion algorithm. Diabetes Educ. 2006;32(3):394–403. doi: 10.1177/0145721706288072. [DOI] [PubMed] [Google Scholar]
- 17.Braithwaite SS, Edkins R, Macgregor KL, Sredzienski ES, Houston M, Zarzaur B, Rich PB, Benedetto B, Rutherford EJ. Performance of a dose-defining insulin infusion protocol among trauma service intensive care unit admissions. Diabetes Technol Ther. 2006;8(4):476–88. doi: 10.1089/dia.2006.8.476. [DOI] [PubMed] [Google Scholar]
- 18.Van den Berghe G, Wouters P, Weekers F, Verwaest C, Bruyninckx F, Schetz M, Vlasselaers D, Ferdinande P, Lauwers P, Bouillon R. Intensive insulin therapy in the critically ill patients. N Engl J Med. 2001;345(19):1359–67. doi: 10.1056/NEJMoa011300. [DOI] [PubMed] [Google Scholar]
- 19.DeSantis AJ, Schmeltz LR, Schmidt K, O’Shea-Mahler E, Rhee C, Wells A, Brandt S, Peterson S, Molitch ME. Inpatient management of hyperglycemia: the Northwestern experience. Endocr Pract. 2006;12(5):491–505. doi: 10.4158/EP.12.5.491. [DOI] [PubMed] [Google Scholar]
- 20.Steil GM, Clark B, Kanderian S, Rebrin K. Modeling insulin action for development of a closed-loop artificial pancreas. Diabetes Technol Ther. 2005;7(1):94–108. doi: 10.1089/dia.2005.7.94. [DOI] [PubMed] [Google Scholar]
- 21.Halter JB, Graf RJ, Porte D., Jr Potentiation of insulin secretory responses by plasma glucose levels in man: evidence that hyperglycemia in diabetes compensates for imparied glucose potentiation. J Clin Endocrinol Metab. 1979;48(6):946–54. doi: 10.1210/jcem-48-6-946. [DOI] [PubMed] [Google Scholar]
- 22.Mari A, Tura A, Gastaldelli A, Ferrannini E. Assessing insulin secretion by modeling in multiple-meal tests: role of potentiation. Diabetes. 2002;51 (Suppl 1):S221–6. doi: 10.2337/diabetes.51.2007.s221. [DOI] [PubMed] [Google Scholar]
- 23.Bergman RN, Ader M, Huecking K, Van Citters G. Accurate assessment of beta-cell function: the hyperbolic correction. Diabetes. 2002;51 (Suppl 1):S212–20. doi: 10.2337/diabetes.51.2007.s212. [DOI] [PubMed] [Google Scholar]
- 24.Ogata K. Modern control engineering. 3. Upper Saddle River; Prentice-Hall: 1997. [Google Scholar]


