

Abstract
A purified recombinant spike (S) protein was studied for its effect on stimulating human peripheral blood monocyte macrophages (PBMC). We examined inflammatory gene mRNA abundances found in S protein-treated PBMC using gene arrays. We identified differential mRNA abundances of genes with functional properties associated with antiviral (CXCL10) and inflammatory (IL-6, IL-8) responses. We confirmed cytokine mRNA increases by real time quantitative(q) RT-PCR or ELISA. We further analyzed the sensitivity and specificity of the prominent IL-8 response. By real time qRT-PCR, S protein was shown to stimulate IL-8 mRNA accumulation in a dose dependent manner while treatment with E protein did not. Also, titration of S protein-specific production and secretion of IL-8 by ELISA showed that the dose of 5.6nM of S produced a significant increase in IL-8 (p=0.003) compared to mock-treated controls. The increase in IL-8 stimulated by a concentration of 5.6 nM of S was comparable to concentrations seen for S protein binding to ACE2 or to neutralizing monoclonal antibody suggesting a physiological relevance. An NF-κB inhibitor, TPCK (N-Tosyl-L-Phenylalanine Chloromethyl Ketone) could suppress IL-8 production and secretion in response to S protein in PBMC and THP-1 cells and in HCoV-229E virus-infected PBMC. Activation and translocation of NF-κB was shown to occur rapidly following exposure of PBMC or THP-1 cells to S protein using a highly sensitive assay for active nuclear NF-κB p65 transcription factor. The results further suggested that released or secreted S protein could activate blood monocytes thru recognition by toll-like receptor (TLR)2 ligand.
Keywords: SARS, Spike Protein, Human Monocyte Macrophages, NF-κB activation, innate immunity
1. Introduction
The SARS coronavirus (SARS-CoV) epidemic of 2003 has rekindled an interest in coronavirus interaction with the host innate immune system. The SARS-CoV-induced disease, severe acute respiratory distress syndrome (SARS) is associated with a major inflammatory component. Increased cytokine and chemokine production in response to virus infection has been the focus of several investigations. (Frieman et al. 2008)
Peripheral blood monocyte macrophages (PBMC) are a tool for investigation of host response and mechanism of pathogenesis. PBMC may become activated by encountering SARS-CoV and recruit neutrophils, monocytes and immune responders such as natural killer (NK), T, and B cells to the site to shape early adaptive immunity (He L. et al. 2003, 2006). PBMC may also carry the virus to other sites such as the liver and brain and cause disease or persist for some time (Shao et al. 2006).
PBMC are nonproductively infected by SARS-CoV. Virion minus RNA is synthesized but little or no infectious virus is produced (Li et al. 2003). The major disease syndrome, SARS, is in part due to monocyte macrophage responses (Hsueh et al. 2004 and Li and Verma, 2002). We hypothesized that the spike (S) protein could play a significant role in inducing monocyte activation and that the NF-κB pathway is the mediator of the response.
Previously, it was shown that truncated S protein (aa260-606) induces IL-6 and TNFα but not IL-8 in the murine macrophage cell line, RAW264.7 (Wang et al. 2007). Baculovirus displaying SARS S protein (aa324-688) induces IL-8 in human lung cell lines (Chang et al. 2004). Coronavirus S protein expressed during mouse hepatitis virus (MHV) or SARS-CoV infection causes ER stress and upregulates CXCL2, the mouse counterpart of IL-8 (Versteeg et al. 2007).
SARS-CoV is an enveloped positive-strand RNA virus in the family Coronaviridae, group 2b. The genome encodes a 5’nonstructural gene ORF1ab, structural genes S, E, M, N and accessory genes in ORFs 3, 6, 7, 8, 9 (Frieman et al. 2008). S, M and E are embedded in the envelope. Trimers of the spike (S) protein form large club-shaped protrusions that are responsible for virus adsorption to its receptor and cell fusion. Each 150-180kDa spike monomer has receptor-binding activity in S1, the N-terminal half and fusion activity in S2, the C-terminal half (Li et al. 2006). S1/S2 are not cleaved during maturation. The large external S1 domain binds to angiotensin-converting enzyme 2 (ACE2), the major cellular receptor found on ciliated nasotracheal epithelial cells, lung alveolar cells and intestinal enterocytes but not found on T cells, B cells or macrophages in the spleen and lymphoid organs (Li et al. 2003, Chen and Subbarao 2007). Virions have uncleaved viral spikes and during entry through endocytic vesicles or through fusion at the plasma membrane, viral spikes are cleaved by cathepsin L (Li F. 2006, Bosch et al. 2008). Trypsin cleavage of the spike prior to infection also permits entry through the plasma membrane (Bosch et.al, 2008). Factor Xa, a membrane bound protease, cleaves SARS S protein into functional S1 and S2 subunits and allows viral entry. (Du et al. 2007).
The S2 trimers direct membrane fusion. S2 contains a hydrophobic fusion peptide close to the N-terminus, heptad repeat regions HR1 and HR2, and is followed by the transmembrane domain (TMD) with a (putative palmytoylated) cysteine rich region and by the carboxyterminal cytoplasmic domain (Frieman et al. 2007 and Thorp et al 2006). The HR2 region contains a leucine zipper domain important for oligomerization (Corver et al. 2007 and Luo et al. 1999). There are 65 spike trimers per SARS-CoV virion (Beniac et al. 2006).
We sought to determine the functions that affect inflammatory responses in monocyte macrophages exposed to SARS-CoV spike protein. We focused on interaction of cell membranes with the virion envelope protein responsible for the initiation of infection.
2. Materials and Methods
2.1 SARS-CoV envelope proteins
Purified recombinant truncated Spike(S) protein, SARS-CoV Urbani strain, GenBank accession number AY278741) was obtained from Protein Sciences Corporation, Meriden, CT and used as recommended. S protein was fully glycosylated, partially trimeric and active in binding to ACE2 in an ELISA assay (K. Rizzo, Protein Sciences Corp., personal communication). The purified product contained < 0.15 endotoxin units (EU) per μg of S protein. The recombinant S protein consisted of the spike extracellular domain truncated at amino acid 1190 and was expressed in expressSF+ insect cells from recombinant baculovirus D3252. The truncation removed the C-terminal TMD (Transmembrane domain) and cytoplasmic tail but retained the HR2 region that contains a leucine zipper domain important for oligomerization (Luo et al. 1999). S protein was stored at -80°C and was stable at 4°C for one week (Song et al. 2004).
Purified, recombinant SARS-CoV E protein (E protein) was obtained from Biodefense and Emerging Infections Research Resources Repository (beiresources), Manassas, VA. The purified E Protein we obtained was a bacterially-expressed E Protein that had contained an N-terminal his tag which was removed by proteolysis and was further purified by nickel affinity chromatography. We found that the purified E Protein had endotoxin activity. To remove the contaminating endotoxin we used DetoxiGel endotoxin removing columns. (Pierce Biotechnology) A 1ml column of settled resin was loaded with 10μg/ml E protein dissolved in 0.1M PBS. The eluate fraction containing E protein was collected by gravity flow and stored at -80°C.
2.2 Peripheral blood mononuclear cells (PBMC) isolation and culture
Peripheral blood was obtained from healthy volunteers. Leukocytes were separated by centrifugation through Ficoll-Paque Plus (Amersham Biosciences) (Collins 2002). The PBMC were washed twice and viable cells brought to a final concentration of 1.25×10⁶ mL-1. Monocytes were enriched by adsorption onto 25cm2 culture flasks and incubated 3-4 days at 37°C in RPMI 1640 Supplemented (containing 10mM HEPES, 1mM sodium pyruvate, non-essential amino acids) and 10% autologous serum (decomplemented, clarified).
2.2 Virus, pseudovirus and cell lines
HCoV-229E was obtained from the American Type Culture Collection (ATCC) and was propagated in MRC-5, human fetal lung cells obtained from ViroMed, Minnetonka, MN. MRC-5 cells were grown in minimum essential medium (MEM) supplemented with 10%v/v FBS (Invitrogen). HCoV-229E infections were performed at a MOI of 1 and incubated at 37°C. HCoV-229E infectious virus was quantitated by plaque assay in MRC-5 cells (Collins and Grubb, 1998).
SARS pseudovirus bearing SARS-CoV S protein and a defective HIV-1 genome expressing luciferase as reporter was prepared as previously described (He Y. 2004) In brief, 293 cells were cotransfected with pSARS encoding SARS-CoV S protein and pNL4-3.luc.RE encoding Env-defective, luciferase-expressing HIV-1genome (plasmids obtained from Yuxian He, New York Blood Center, New York, NY) using Fugene 6 reagents (Boeringer-Mannheim). Supernatants containing SARS pseudovirus were harvested 48h post-transfection and used for single cycle infection. To assay for SARS pseudovirus infectivity, hACE2-293 cells were incubated with dilutions of SARS pseudovirus for 48h. The cells were then assayed for luciferase activity expressed as relative light units (RLU) using a luciferase kit (Promega, Madison WI).
HEK293T (293) cells were a gift from M. Garrick, SUNY at Buffalo, Buffalo, NY. hACE2-293 cells were a gift from Y.He, New York Blood Center, New York, NY. Both cell lines were propagated in DMEM supplemented with 10%v/v FBS. hTLR2-293 cells were purchased from InvivoGen, Carlsbad, CA and propagated in DMEM supplemented with 10%v/v FBS and 10μg/ml blasticidin.
The human monocytic cell line THP-1 was obtained from ATCC and cultured in RPMI 1640 Supplemented (containing 10mM HEPES, 1mM sodium pyruvate, non-essential amino acids) plus 10%v/v FBS and 0.05mM 2-mercaptoethanol. Undifferentiated, non-adherent THP-1 cells (1 × 10⁶ cells per 25cm2 flask) became differentiated and adherent after incubating the cultures for 24 h with phorbol myristate acetate (PMA) (Sigma) at a final concentration of 100nM.
2.3 Stimulation of cells with SARS-CoV envelope proteins
SARS-CoV S and E envelope proteins were diluted in RPMI medium to treat in vitro PBMC cultures (2 × 10⁵ cells per flask). To simulate a virus -cell interaction, cultures were washed twice in RPMI 1640, treated with various doses of S protein, (0.28-28nM) or E protein, (0.5-25nM) in 200 μl RPMI 1640 per 25cm2 flask, or mock-treated, then incubated for 30 minutes on ice, then 30 minutes at 37°C. Five ml RPMI 1640 Supplemented was then added and cultures were returned to at 37°C. At 18-24 h, cytoplasmic RNA was extracted from the cells. In some experiments, aliquots of 0.5 ml supernatant medium were collected at 0, 3, 6, 9, 12, 24 h of incubation for subsequent ELISA assay for secreted cytokines. Nuclear cell fractions were assayed for active NK-κB transcription factor (section 2.8)
Stimulation through toll-like receptor 2 (TLR2) in hTLR2-293 cells was performed using as a control, TLR2 agonist, mycobacterial lipomannan (LM-MS from M.smegmatis) (InvivoGen) at 10ug/ml (Elass, 2005).
2.4 Microarray Gene expression Arrays to profile the human inflammatory and the NF-κB pathway responses
mRNA abundance was studied comparing Control and S Protein treated PBMC cultures with GEArray Q series Human Inflammatory Cytokines and Receptors Gene Array, (SuperArray Bioscience Corporation, Bethesda, MD). RNA was extracted using TriReagent following the method for cell lysates. (Molecular Research Center, Inc. Cincinnati, OH) and stored in 90% ethanol at -80°C. 1-5 μg of RNA was amplified and labeled with biotin-16-dUTP to create a cDNA probe using the Ampolabeling LPR Probe Synthesis Kit. (SuperArray Bioscience Corporation, Bethesda, MD). Bound probe was detected with Chemiluminescent Detection Kit (SuperArray Bioscience Corporation, Bethesda, MD). For the NF-κB Pathway responses (Oligo GEArray DNA Microarray, SuperArray Bioscience Corporation) which included IL-8, total RNA was further purified using RNeasy columns according to manufacturers instructions (Qiagen, Valencia, CA) and a biotin-16-UTP cRNA probe was prepared using the RNA TrueLabeling-AMP 2.0 Kit (SuperArray Bioscience Corporation, Bethesda, MD).
Briefly, after 1-2 hours of prehybridization at 60°C the probe was hybridized overnight at 60°C, washed with several low and high stringency washes and the bound probe was then reacted with alkaline phosphatase-conjugated streptavidin and detected on the array with CDP-star chemiluminescent substrate. The chemiluminescent array image was captured using a cooled Fuji Imager CCD camera. The parameters selected used a local background correction subtraction and were normalized to GAPDH as a control on each array. GAPDH was normalized to 1.0, which gave a value to which other induced expression could be compared. This allowed for the comparison of densities as relative amounts expressed.
2.5 Microarray data analysis
The relative intensity of the array spots was analyzed using GEArray Expression Analysis Suite 2.0 software (SuperArray Bioscience Corporation, Bethesda, MD). The average intensity from multiple spots of individual genes on each array was compiled. Paired t-tests on normalized intensities with p values = 0.05 from three or more independent experiments were used to generate a list of genes with significant changes in gene expression between control and S protein treated samples. Only those that were reproducibly changed in independent experiments were analyzed further. Quality control measures included subtracting baseline and setting housekeeping gene glyceraldehyde-3 phosphate dehydrogenase (GAPDH) to one for all arrays. A comparison analysis was performed for the S protein-treated sample against its corresponding mock-treated control as the baseline ‘signal’. Fold change was calculated from the signal ratio after normalizing the control signal values to 1. Activity analyses (ELISAs) were performed on selected genes to confirm a biological function.
2.6 Statistical evaluations
Results were expressed as means ± SD or ± SE. Comparisons of values for test results from multiple individual donors of PBMC or from cultured cells were evaluated by Student’s t-test for paired samples (p value) (Wolk, 2008)
2.7 ELISA assays for secreted cytokines and chemokines
PBMC cultures were treated with S Protein, E Protein, or mock treated as described (section 2.3), and the culture medium was sampled at various times post treatment to assay for secreted cytokines by ELISA. Media samples were stored at 4°C. IL-8/CXCL8, MIP-1β, IL-1β, IL-6 and TNFα protein secretion into culture medium was quantitated using highly specific and sensitive ELISA kits. Quantikine ELISA kits were obtained from R&D Systems (Minneapolis, MN) and performed as described by the manufacturer. The sensitivities are: IL-8/CXCL8 assay is 1.5-7.5 pg/ml, MIP-1β assay is <4 pg/ml, IL-1β assay is <1 pg/ml, IL-6 assay is, <0.70 pg/ml, TNFα assay is 0.5-5.5 pg/ml. Secreted cytokine and chemokine levels were compared based on picograms per ml of culture medium.
2.8 NF-κB transcription Assay
For quantification of active NF-κB transcription factor, nuclear fractions of S treated and mock treated PBMC were assayed with the EZ-Detect NF-κBp65 Transcription Factor Kit (Pierce Biotechnology, Rockford IL). This method has been published in detail (Rosenau). 1×10⁴-2×10⁵ mock treated PBMC (Control), and PBMC treated with 11.2nM S protein for 24h were harvested by incubation with Versene (Invitrogen)at room temperature for 10 min and scraping into cold PBS. Adherent THP-1 cells (1×10⁶ cells per flask) were similarly treated. Cytoplasmic and nuclear cell fractions were prepared using NE-PER Nuclear and Cytoplasmic Extraction Reagents (Pierce, Rockford IL). TNFα-activated PBMC nuclear extract was used as a positive control. PBMC were stimulated with 50 ng/ml recombinant human TNFα (R&D Systems, Minneapolis MN) for 15 minutes, and nuclear extracts were prepared as described above. (Davis et al. 2001) All nuclear and cytoplasmic extracts were immediately placed -70°C. Protein concentration was determined by MicroBCA Protein Assay (Pierce Protein Research Products, Rockford IL). Five-to-ten μl (1 μg) of nuclear extracts was incubated in wells coated with NF-κBp65 consensus sequence for 1h. Only the active form of NF-κB transcription factor binds to the consensus sequence in the wells. After the first incubation, the wells were washed and incubated with specific primary antibody to NF-κBp65 for 1h. After incubation with the primary antibody, the wells were washed and incubated with a secondary HRP-conjugated antibody for one hour, then washed. A chemiluminescent substrate was added to the wells and the resulting signal was detected using a luminometer (BioTek Multifunction Plate Reader Winooski, VT). Active NF-κB transcription factor was reported as luminescence per ug protein.
2.9 NF-κB inhibitor
TPCK, N-Tosyl-L-Phenylalanine Chloromethyl Ketone (Sigma Products, St. Louis, MO), an irreversible inhibitor of serine proteases with chymotrypsin-like specificity, was prepared as 10mM stock in ethanol and stored at 4°C. TPCK, 25μM in RPMI 1640 medium, was used as an NF-κB inhibitor (Henkel et al, 1993). TPCK acts by inhibiting IKBα protease so that IKBα is not proteolytically degraded and NF-κB is not released to undergo nuclear translocation (Henkel 1993). Briefly, for treatment with S protein or HCoV-229E virus, PBMC cultures were pretreated with 25μM TPCK for 20 min on ice, then stimulated with S protein (section 2.3) or HCoV-229E virus (section 2.2) and incubated in medium with 25μM TPCK for up to 24h (Jovasevic et al. 2008). TPCK effect on virus production in infected cells was measured by plaque assay of the culture supernatant.
2.10 Real-time, quantitative RT-PCR (qRT-PCR)
qRT-PCR was used to quantitate the effect of S and E protein on IL-8 cytokine mRNA abundance. The RNA from in vitro PBMC cultures was reverse transcribed to cDNA using the reverse transcriptase kit from Promega (Promega Inc, Madison WI). Relative abundance of each mRNA species was quantitated using realtime quantitative PCR using specific primers: β-Actin, Forward 5’-TGA CGG GGT CAC CCA CAC TGT GCC CAT CTA, Reverse 3’-AGT CAT AGT CCG CCT AGA AGC ATT TGC GGT, IL-8, Forward 5’-TGC AGC TCT GTG TGA AGG TG, Reverse 3’-TCT GCA CCC AGT TTT CCT. TG. (Mahajan et al. 2005) and CXCL10 Forward 5′-CTG ACT CTA AGT GGC ATT-3′, Reverse 5′-TGA TGG CCT TCG ATT CTG-3′ (Cheung, 2005). (Primers were synthesized by Invitrogen or Integated DNA Technologies, Skokie, IL.) Using Brilliant® SYBR® green Q-PCR master mix from Stratagene (Stratagene Inc, La Jolla CA.) to provide precise quantification of initial target in each PCR reaction, the amplification plot was examined at a point during the early log phase of product accumulation. This is accomplished by assigning a fluorescence threshold above background and determining the time point at which each sample’s amplification plot reached the threshold (defined as the threshold cycle number or CT. the threshold is a numerical value assigned automatically by the software for each run above the calculated baseline. The CT value assigned to a particular sample thus reflects the point during the amplification reaction at which sufficient number of amplicons has accumulated above the baseline. After a suitable threshold is selected, the data is analyzed and CT values for each sample determined. Differences in threshold cycle number (CT) are used to quantify the relative amount of PCR target contained within each tube. Relative expression of mRNA species is calculated using the comparative CT method. Briefly, for each sample, the difference in CT values (ΔCT) was calculated for each mRNA by taking the mean CT of duplicate tubes and subtracting the mean CT of the duplicate tubes for the reverence RNA (β-Actin) measured on an aliquot from the same RT-reaction.
The ΔCT for the treated sample was then subtracted from the ΔCT for the untreated control sample to generate a Δ ΔCT.
The mean of these Δ ΔCT measurements was then used to calculate the expression of the test gene relative to the reference gene and normalized to the untreated control as follows:
This calculation assumes that all PCR reactions are working with 100% efficiency. All PCR efficiencies were found to be > 95%; therefore this assumption introduces minimal error into the calculations.
3. Results
3.1. Inflammatory gene analysis
To investigate the effect of treatment with S protein on the inflammatory response, we compared relative abundance of mRNA species of treated and mock-treated PBMC using microarray analysis. The paired t-test was used to detect mRNA species with statistically significant differences in expression, p ≤ 0.05. Figure 1 is the summary of genes identified by the analysis. Treatment with S protein increased the abundance of CCL15 mRNA by 2.2 fold (p = 0.033), CCL16 mRNA by 1.6 fold (p = 0.033) and CCL19 mRNA by 1.7 fold (p = 0.011). These chemokines chemo attract and activate monocytes. Cytokine IL-12A mRNA, which activates natural killer (NK) cells increased 2.36 fold (p =0.021). Interestingly, S protein treatment increased CXCL10 mRNA abundance by 5.5 fold (p = 0.029) and CXCL11 mRNA by 2.2 fold (p=0.014). These genes are modulated by virus infection (Cheung et al. 2005, Tseng et al. 2005). Only CXCL10 mRNA abundance was verified by qRT-PCR, which showed transcript accumulation increasing 6.4-8.0-fold in response to S protein.
Figure 1.
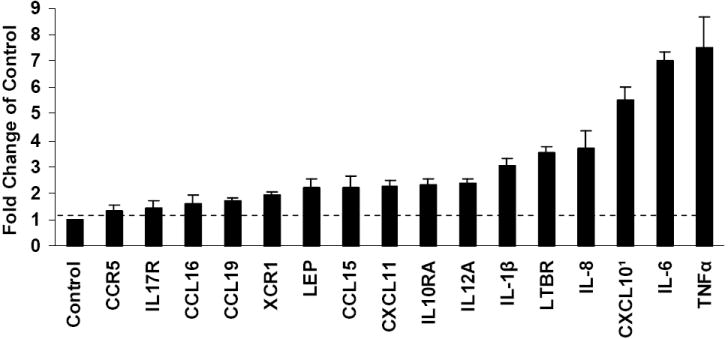
Differential mRNA abundances determined by a Microarray focused on immunologically relevant genes after treatment of PBMC (2 × 10⁵ cells) with 11.2nM S protein for 24 h. Statistically significant (p value <0.05) differences in mRNA abundance were identified using the student’s t-test by comparing treated with mock-treated culture from three or more independent experiments. Sixteen differences in mRNA abundance were identified. 1 CXCL10 was further analyzed by qRT-PCR.
S protein treatment also increased leptin mRNA 2.2 fold (p = 0.031). Leptin has immunoregulatory activity. CCR5(the receptor for CCL5, CCL4, CCL3) mRNA increased 1.3 fold (p=0.022). Chemokine receptor XCR1 increased 1.9 fold (p=0.004.) LTBR, a receptor for TNF, increased 3.5 fold (p = 0.048.) (by qRT-PCR, LTBR did not increase more than twofold). Cytokine receptors IL-10RA and IL17R increased 2.3 fold (p = 0.046) and 1.45 fold (p = 0.016) respectively. The fold increases were not further verified by qRT-PCR, however, they suggested that the viral S protein acts as an inflammatory stimulus in PBMC.
PBMC treated with S protein showed increased abundance of mRNAs for MIP-1β 1.3 fold (p=0.12, ns), IL-1β threefold (p=0.12, ns), IL-8 3.7 fold (p=0.34, ns), IL-6 sevenfold (p= 0.016) and TNFα 7.5 fold (p=0.12, ns). Production and secretion of these protective cytokines and chemokines after treatment of PBMC with S protein was further analyzed.
3.2. Inflammatory cytokine activity
In addition to mRNA abundance studies we also quantified inflammatory cytokine and chemokine activities by ELISA assay. In vitro PBMC (2×10⁵) were treated with 11.2nM S protein for 24 h. Supernatant medium from the cultures was tested for cytokines by the Quantikine ELISA assay. The results were expressed as pg/ml and the percentage increase in the secreted cytokine in S protein-treated versus mock-treated was compared. We observed that treatment with S protein increased the levels of secreted IL-8, MIP-1β, IL-6, IL-1β from in vitro PBMC, Figure 2. S protein-treated cells produced significantly more IL-8 (453%, p=0.008), MIP-1β (646%, p=0.008), IL-6 (>297%, p=0.027), IL-1β (285%, p=0.03). The increase in TNFα mRNA abundance was not significant (364%, p =0.064, ns). Our results showed increased production and secretion of protective cytokines and chemokines after treatment of PBMC with S protein.
Figure 2.
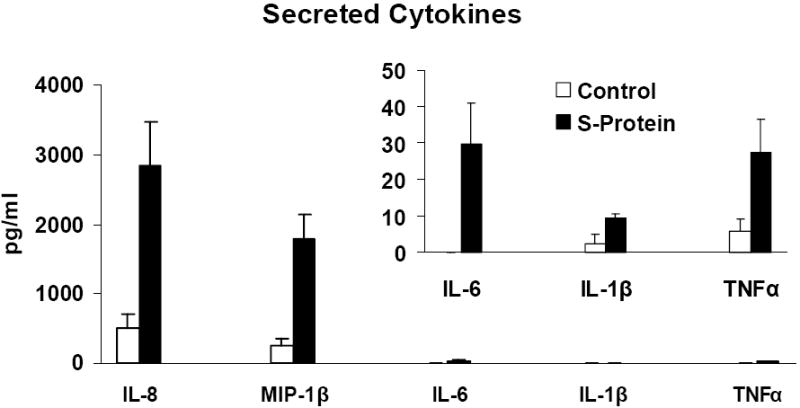
S protein-treated PBMC synthesized and secreted significantly (p<0.05) more of IL-8, MIP-1β, IL-6, IL-1β inflammatory cytokines than the control. PBMC (2 × 10⁵ cells) were cultured with and without 11.2nM S protein for 24 h and supernatants were assayed for cytokines by ELISA. Mean± SE of three or more independent experiments is shown. P values were determined by student’s t-test comparing S protein-treated and mock-treated control culture. TNFα p=ns.
3.3. The effect of S protein on IL-8 synthesis and secretion by PBMC is dose dependent
Data presented in Figure 3 show the effect of concentration of S protein on synthesis and secretion of the chemokine IL-8 by PBMC into the culture supernatants as measured by ELISA. Kinetic studies performed at 3, 6 and 9 h of incubation after treatment with 0.28nM, 2.8nMand 5.6nM S protein showed a dose dependent increase in IL-8 production compared to control cultures at all time periods. PBMC treated with S protein at 5.6nM produced significantly more IL-8 compared to controls. This corresponded to 132% (p=.0027) at 3 h, 107% (p=.037) at 6 h and 84% (p=.043) at 9h. Lower concentrations of S did not significantly affect IL-8 production. At 2.8nM S protein the increase was 77%, 59% and 47% and at 0.28nM S protein the increase was 19%, 14% and 3% at 3, 6 and 9h respectively. Our kinetic studies performed at 3, 6 and 9h of incubation showed significant IL-8 production by PBMC in an S protein concentration dependent manner.
Figure 3.
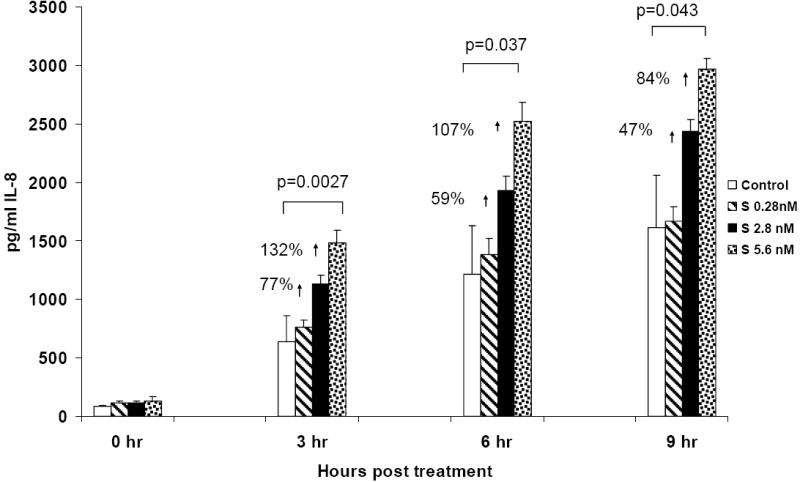
Production and secretion of IL-8 was significantly increased in PBMC after treatment with S protein. The kinetics and dose response effect of S protein on in vitro PBMC 3, 6 and 9h after treatment with S protein (0.28, 2.8 and 5.6nM) were evaluated. Secreted IL-8 is expressed as pg/ml (mean ± SE of three separate experiments). Statistical significance was determined using the student’s t-test based on comparison of S protein treated-with the mock-treated control for each time point. Our results indicated that S protein treatment increased IL-8 production in a dose dependent manner and that 5.6nM gave a statistically significant response compared to control.
3.4. S protein but not E protein increased IL-8 mRNA abundance in a dose dependent manner
E protein is similar to S protein in that it is an envelope protein expressed on the surface of virions and infected cells. We compared the effect of S and E protein treatment on IL-8 mRNA abundance in PBMC. In vitro PBMC were treated with various concentrations of E and S proteins for 24 h and RNA was extracted, reverse transcribed and cDNA amplified by qPCR using primers specific for the housekeeping gene β-Actin and IL-8. Data presented in Figure 4A show the relative expression (TAI values) of IL-8 in S versus E treated cultures. As expected, S protein increased IL-8 mRNA abundance in a dose dependent manner as follows: 1.9 fold at 0.28nM S, 2.04 fold at 2.8nM S, 7.89 fold at 5.6nM S and 22.01 fold at 28nM S. On the other hand, treatment with E protein did not increase IL-8 mRNA abundance as follows: 1.06 fold at 0.5nM E, 0.08 fold at 2.5nM E and 0.085 fold at 25nM E as compared to control. Our results indicated that treatment with S protein increased IL-8 mRNA, while E protein did not increase IL-8 mRNA in PBMC.
Figure 4.
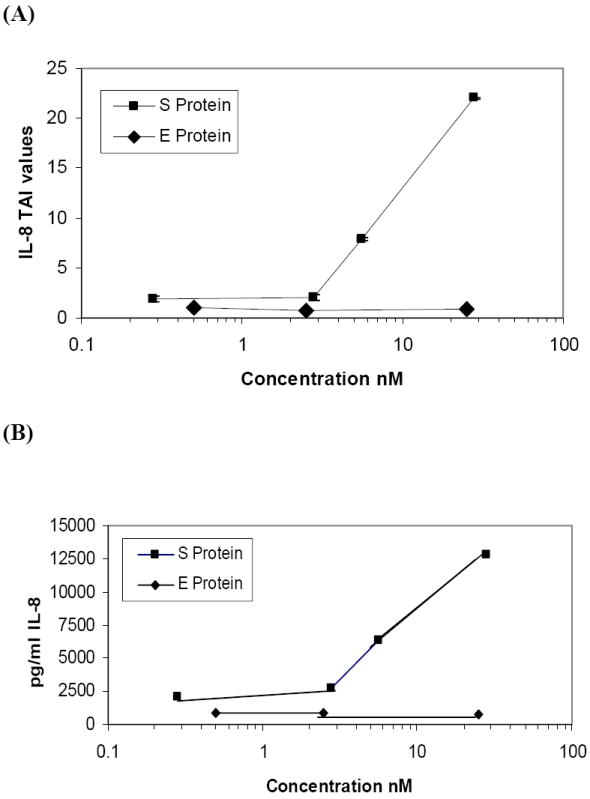
S protein but not E protein treatment increased IL-8 mRNA abundance and IL-8 production and secretion in PBMC. In vitro PBMC (2×10⁵ cells) were treated with S protein (0.28, 2.8, 5.6and 28nM) or E protein (0.5, 2.5 and 25nM) for 24 h. (A) RNA was extracted, reverse transcribed, cDNA amplified and IL-8 gene expression was determined by real time quantitative PCR. Relative expression of mRNA species was calculated using the comparative CT method. Statistical significance was determined using the student’s t-test based on comparison with the mock-treated control for each dose. Significant differences in IL-8 mRNA abundance were observed when the PBMC were treated with S protein ≥ 5.6nM compared to control (p= 0.047, data of three separate experiments) while E protein did not increase IL-8 mRNA levels. (B) Secreted IL-8 concentrations at 24 h following S protein and E protein treatment of PBMC were determined by ELISA. IL-8 concentration increased in S protein-treated PBMC in proportion to mRNA abundance whereas secreted IL-8 did not increase in E protein-treated PBMC, compared to control.
3.5. S protein but not E protein increased IL-8 production in a dose dependent manner
The synthesis and secretion of IL-8 by S protein- and E protein-treated PBMC (from section 3.4 above) was quantified by ELISA assay of the supernatant medium after 24h of incubation. PBMC treated with S protein produced more IL-8 in a dose dependent manner as follows 2049pg/ml (12% increase) at 0.28nM S, 2782pg/ml (52% increase) at 2.8nM S, 6340pg/ml (246% increase) at 5.6nM S, 12,774pg/ml (598% increase) at 28nM S as compared to the control, 1829pg/ml, without S protein. PBMC treated with E protein produced less IL-8 as follows; 885pg/ml (19% less) at 0.5nM E, 823pg/ml (21% less) at 2.5nM E, 736pg/ml (30% less) at 25nM E as compared to the control, 1045pg/ml, without E protein Figure 4B. Our results indicated that S protein increased IL-8 secretion in proportion to increased mRNA abundance, while E protein did not increase IL-8 secretion in PBMC.
3.6. NF-κB inhibitor suppresses the synthesis and secretion of IL-8 in PBMC and THP-1 cells after treatment with S protein and in PBMC infected with HCoV-229E
We next determined whether IL-8 production was dependent on NF-κB, which is activated through IκBα proteolysis. In order to inhibit NF-κB activation, we examined the effect of pretreatment of cells with TPCK, an NF-κB inhibitor that inhibits IκBα protease (Henkel, 1993). PBMC cultures (104-105 cells) or THP-1 cultures (106 cells) were pretreated with 25μM TPCK for 20 min, followed by S protein treatment and incubation in the presence of TPCK for 24h. Treated with S protein alone, TPCK alone or mock-treated served as controls. Production and secretion of IL-8 into the supernatant medium was measured by ELISA. Our results showed that in PBMC, S protein alone increased IL-8 significantly (1714± 432 pg/ml versus control 275±330 pg/ml, p=0.005) whereas pretreatment of PBMC with TPCK significantly reduced the amount of IL-8 produced in response to S protein (1714± 432 pg/ml versus S protein with inhibitor, 94 ±157pg/ml, p=0.024, 95% inhibition). In mock-treated PBMC with inhibitor 66 ± 113 pg/ml of secreted IL-8 was produced Figure 5A. Similarly, in THP-1 cells, S protein alone increased IL-8 significantly (1403± 79 pg/ml versus control 863± 48 pg/ml, p=0.017) whereas pretreatment with TPCK significantly reduced the amount of Il-8 produced in response to S protein (1403± 79 pg/ml versus S protein with inhibitor, 3.4±3.2 pg/ml). In mock-treated THP-1 cells with inhibitor <1.5pg/ml of IL-8 was produced Figure 5B. Next, the effect of TPCK inhibitor on IL-8 secretion in HCoV-229E-infected PBMC was measured during one cycle of virus replication (8h post infection). TPCK only partially inhibited the secretion of IL-8 and the effect was not seen until 6 h after infection suggesting that post-entry events were involved Figure 5C. TPCK toxicity for virus-infected cells was measured by plaque assay. HCoV-229E yield was 38% lower in PBMC cultures in the presence of 25μM TPCK. Virus titer with TPCK was 4.7 log10 vs 5.13 log10 pfu/ml without TPCK at 8h post infection. Our results indicated that NF-κB activation was required for production and secretion of IL-8 in response to treatment of PBMC or THP-1 cells with S protein. However, TPCK treatment was not sufficient to completely inhibit IL-8 production and secretion in PBMC infected with HCoV-229E at MOI of 1.
Figure 5.
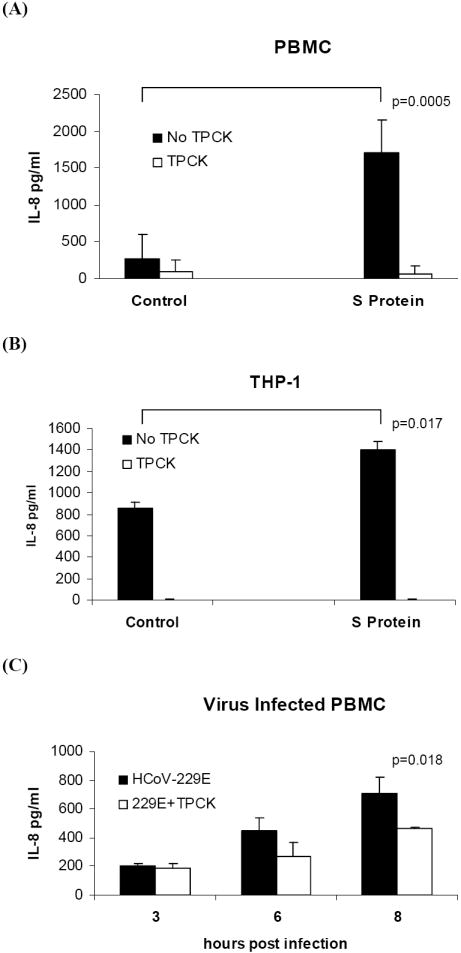
Effect of treatment with TPCK on the IL-8 response to S protein in PBMC and THP-1cells and in HCoV-229E-infected PBMC. PBMC or THP-1 cells were pretreated with 25μM TPCK for 20 min prior to addition of 11.2nM S protein. Secretion of IL-8 into culture supernatants after 24h of incubation was measured using ELISA: (A) In PBMC, in the presence of TPCK the response to S protein was reduced by 95% (p=0.024) (B) In THP-1 cells, in the presence of TPCK the response to S protein was reduced by 95%.(p=0.022). C) In HCoV-229E-infected PBMC, in the presence of TPCK the secretion of IL-8 was reduced by 51% at 6 h post infection and 34% at 8 h post infection (p=0.018). The data are from three independent experiments.
3.7. Active nuclear NF-κB is increased in PBMC and THP-1 cells treated with S protein
In order to determine the effect of S protein treatment on nuclear NF-κB activity, we measured the amount of active NF-κB p65 transcription factor in the nucleus using an assay that measures the amount of NF-κB p65 that binds to its consensus sequence immobilized on wells of a 96-well plate. Nuclear fractions of PBMC treated with S protein showed higher levels NF-κB p65 DNA binding activity than mock-treated controls. Activity levlels in PBMC at 6h post treatment were: S protein 23,585±13,414 (luminescence units per μg nuclear protein) versus control 6968±3490 (238% increase, p=0.018), at 9h post treatment S protein 19880±4694 (luminescence units per μg nuclear protein) versus control 6725±2680 (151% increase, p=0.0007), at 18h post treatment S protein 37,476 ±10,416 (luminescence units per μg nuclear protein) versus controls 11,500 ±6,600 (226% increase, (p= 0.15 ns) Figure 6A. When adherent THP-1 cells were analyzed, activity levels at 1h post treatment were: S protein 73382±2383 (luminescence units per μg nuclear protein) versus control 41,961±7516 (75% increase, p=0.005), at 4h post treatment, S protein 55339±1666 (luminescence units per μg nuclear protein) versus control 33487± 5535 (65% increase, p=0.004) Figure 6B. In THP-1 cells, TPCK pretreatment reduced the NF-κB promoter binding activity response to S protein. Our results showed that NF-κB promoter activity increased in PBMC and THP-1 cells treated with S protein and that TPCK pretreatment could reduce the response.
Figure 6.
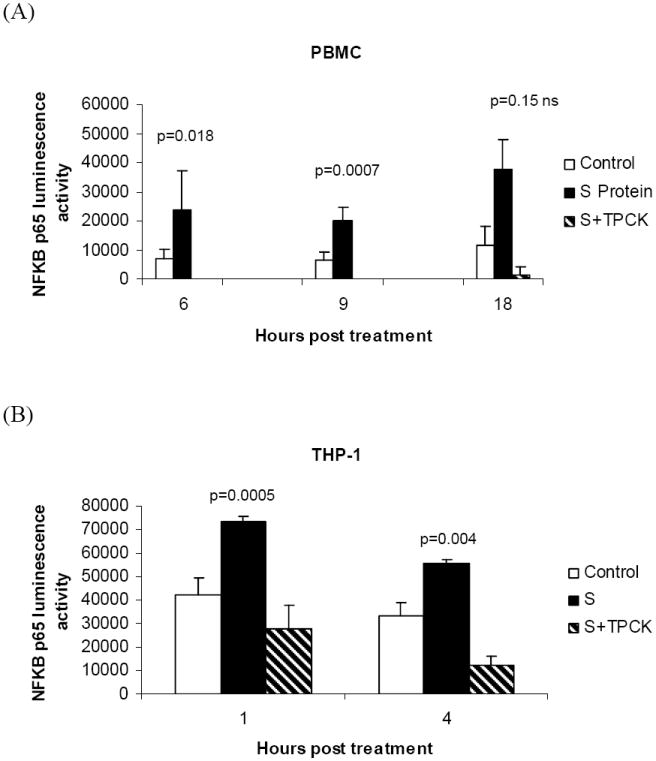
Quantitation of the effect of S protein on the activation of NF-κB. Nuclear proteins were extracted from PBMC or THP-1 cells treated with S protein (11.2nM) or mock-treated (control). To assay for activated NF-κB, 1μg of the nuclear extract was added per well coated with NF-κB consensus DNA sequence and the amount of active NF-κB p65 bound after 1 h incubation was measured as luminescence units using EZ Detect NF-κB p65 Transcription Factor Assay. Each bar represents of luminescence activity per μg nuclear extract (mean ± S.E from three independent experiments). The results show that in (A) PBMC and (B) THP-1 cells, treatment with S protein increased NF-κB activity compared to controls. In THP-1 cells, TPCK pretreatment reduced NF-κB binding activity in response to S protein by 62% (p=0.04) at 1 h post treatment and by 77% (p=0.008) at 4 h post treatment with S protein.
3.8 S protein utilizes Toll-like receptor 2(TLR 2) to increase IL-8 production
We next examined whether toll-like receptors that are present on human macrophages could interact with S protein to induce IL-8 secretion. Using 293 cells stably expressing human TLR2, we found that hTLR2 expression was sufficient to allow for IL-8 production in response to S protein (573± 194pg/ml versus control 218±154pg/ml, p = 0.03) Figure 7A. 293 cells did not show an IL-8 response to S protein Figure 7B. This was an important observation given that TLR2 can be activated by several viruses or viral components and is predominantly expressed on macrophages in humans (Finberg et al. 2007). hACE2-293 cells did not show an IL-8 response to S protein whereas SARS pseudovirus stimulated low levels of IL-8 (42±13pg/ml) possibly thru hACE2 signaling (Chang, 2004) Figure 7C. In 293 cells, pSARS pHIV cotransfection results in S protein synthesis and secretion of SARS pseudovirus. When supernantant medium from these cotransfected cells was examined, a low level of IL-8 secretion (69±8.5pg/ml) was found Figure 7B. In these cotransfected cells, S protein expression could be involved in stimulating IL-8 production. In HCoV-229E-infected hTLR2-293 cells and 293cells, production and secretion IL-8 was detected but activation was not TLR2-specific Figure 7A and 7B. Our results show that SARS S protein in a soluble form increased IL-8 production thru hTLR2 ligand interaction.
Figure 7.
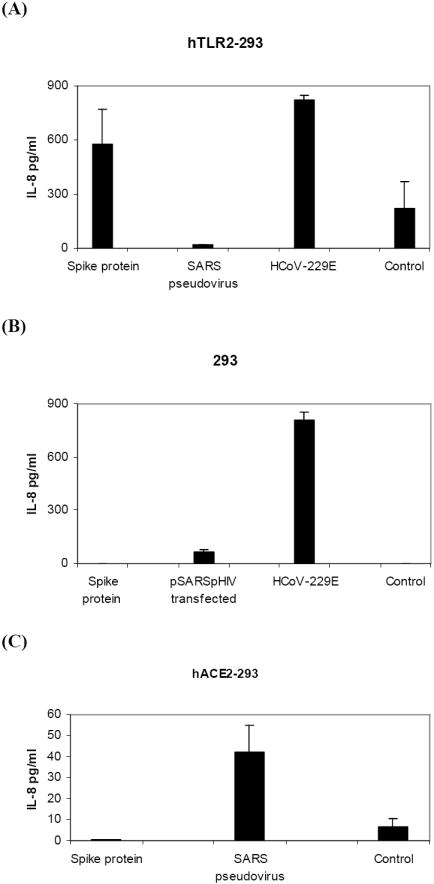
S protein is a ligand for human TLR2. Cultures of (A) hTLR2-293, (B) 293 and (C) hACE2-293 cells (1×10⁶ cells) were stimulated with S(spike) protein (11.2μM), SARS pseudovirus (3×10⁵ RLU), supernatant from pSARS pHIV cotransfected 293 cells (3×10⁶ RLU), or infected with HCoV-229E (MOI = 1). Culture media were collected at 18 h and secreted IL-8 was measured by ELISA. Data are from two or more experiments. p= 0.03 for S protein compared with control in hTLR2-293 cells by the paired one-tailed t-test.
4. Discussion
During the SARS-CoV respiratory syndrome, numerous cytokine and chemokines are induced that attract specialized immune cells to the sites of infection (He et al. 2006). An adaptive immune response is initiated that resolves the infection (Cameron et al. 2007). Elevated cytokine and immune regulatory gene expression was found in PBMC of patients with SARS (Yu et. al 2005). In good agreement with their observations we showed that mRNA abundance of IL-6 and IL-8 cytokines was elevated, as well as CXCL10 ligand (in convalescence). Elevated CXCL10 mRNA contributes to resolution of the infection with neuroadaptive mouse hepatitis virus (MHV) in mouse brain (Walsh et al 2008).
We showed that treatment of PBMC with S protein (11.2nM) leads to their activation as indicated by the production and secretion of several inflammatory mediators. The increase in secreted IL-8, MIP-1β (CCL4), IL-6 and IL-1β was statistically significant as detected by ELISA assay. By microaray analysis, IL-8, IL-6 and IL-1β mRNA abundance also increased but MIP-1β mRNA did not increase appreciably.
To study IL-8 chemokine induction in more detail, PBMC were treated with S protein at various concentrations, and production and secretion of IL-8 over a 24 h period was determined by ELISA. IL-8 levels increased significantly at 3 h post treatment with S protein at a concentration of 5.6nM compared to mock-treated controls. This concentration is higher than levels of binding of S to other functional molecules. ACE2 receptor binds S specifically with 1.7nM affinity (Li et al. 2003). A highly potent neutralizing monoclonal antibody bound to S and inhibited fusion at 0.32nM (Sui et al. 2004).
PBMC carry out steady state production of IL-8 from basal levels of IL-8 mRNA since it is also involved in other cellular processes. We found highly variable basal IL-8 levels between different individuals. However, after S protein treatment IL-8 levels were highly elevated. Similarly, Huang et al. (2005) found that in acute phase SARS patient sera, levels of IL-8 were highly variable but were significantly different from healthy controls. In genetic studies, differential expression between the IL8 promoter variant alleles showed significant association (P<0.001) with cystic fibrosis lung disease severity (Hillian et al. 2008). Our results showed that S protein at concentrations 5.6nM significantly increased IL-8 mRNA abundance in PBMC. IL-8 production and secretion could be enhanced in PBMC by more than one mechanism including direct activation by S protein and indirect priming via IL-8 receptor which was shown to be increased in SARS patients (Yu et al. 2005). Secreted spike could be produced during virus infection (Pulford and Britton, 1991).
We showed that recombinant E protein did not increase IL-8 mRNA abundance. Previously, Versteeg et al. (2007) showed that E and M structural proteins expressed from vaccinia virus in L cells did not induce CXCL2, the mouse counterpart of IL-8. The SARS E protein is of interest because it is found on the cell surface late in infection and it traverses the lipid bilayer with its N -terminal portion protruding and detectable with E-specific antibody (Maeda et al, 2001).
Since the SARS syndrome is characterized by an uncontrolled inflammatory response and NF-κB is the major transcription factor activated in acute respiratory distress syndrome (ARDS) (Fan et al. 2001), we sought to determine whether S protein-induced IL-8 production is mediated by NF-κB activation. We examined the activity of the NF-κB inhibitor, TPCK. This NF-κB inhibitor acts by inhibiting IKBα protease so that IKBα is not proteolytically degraded and NF-κB is not released to undergo nuclear translocation (Henkel et al. 1993). We observed that the addition of TPCK before treatment with S protein significantly inhibited IL-8 secretion suggesting that NF-κB activation was required for S protein-induced IL-8 secretion. TPCK partially inhibited IL-8 secretion in HCoV-229E-infected PBMC and also reduced the virus yield. These effects on HCoV-229E- infected PBMC could be due to inhibition of proteases and possibly to induction of apoptosis (Zhu et al. 1997). HCoV-229E spike resembles SARS-CoV spike. Both SARS-CoV and HCoV-229E spikes do not contain furin recognition sites and are uncleaved in the virion (Li et al. 2006). Cathepsin L cleavage separates the receptor binding subunit (S1) from the membrane anchored fusion subunit (Li et al. 2006). Both viruses use clathrin-mediated endocytosis for ACE2 or CD13 (human aminopeptidase N) receptor mediated entry (Yeager et al.1992, Inoue et al. 2007). Inhibitors of cathepsin L, a cysteine protease, block cell fusion and entry via endocytosis for both viruses (Bosch et al. 2008, Li et al. 2006, Kawase et al. 2008,). TPCK is an inhibitor of chymotrypsin-like serine proteases and prevents MHV spike cleavage in L2 cells (Mizzen et al. 1986). This class of inhibitors did not block SARS S1 cleavage from the spike trimer (Huang at al. 2006). However, Factor Xa, a membrane bound protease, could cleave SARS S protein into functional S1 and S2 subunits and Ben-HCl, an inhibitor of trypsin and serine proteases, inhibited cleavage and effectively blocked viral entry (Du et al. 2007). Thus, in addition to NF-κB inhibition, TPCK might prevent S protein cleavage. Further work is necessary to address this issue.
To verify that nuclear NF-κB activity increased in S protein-treated PBMC, we performed direct measurement of active NF-κB transcription factor binding to consensus DNA sequences. We found a significant increase in nuclear NF-κB p65 transcription factor activity in S protein-treated PBMC and THP-1 cells compared to mock treatment. This indicated that S protein caused a specific activation of NF-κB signaling.
Chang et al. (2004) suggested that in hACE2 receptor positive lung epithelial and fibroblast cells, SARS S1 protein induced IL-8 via AP-1 activator thru hACE2 signaling. We found that TLR2 expression was sufficient to allow for IL-8 production in response to S protein. TLR2, like all TLRs, activates a common signaling pathway that culminates in the activation of NF-κB (Barton et al. 2003). TLR2 is predominantly expressed at high levels on macrophages in humans and can be activated by several viruses or viral components (Finberg et al. 2007). Plasmacytoid cells use the TLR pathway for viral defense (Barton et al. 2003). Other cells use cytosolic RNA receptors RIG1-like helicases (RLHs) and MDA-5 (Uematsu et al. 2005) and nucleic acid recognizing TLRs 3,7,8 and 9 that are critical in the regulation of the production of type 1 IFNs in response to virus infection (Finberg et al. 2007). TLR2 is not an IFNβ inducer (Barton et al. 2003). IFNβ mRNA did not increase in S protein-treated PBMC in our experiments (data not shown). TLR2 mRNA was shown to be increased in PBMC from acute phase SARS patients (Reghunathan et al. 2005). Further work is underway to confirm our observations.
In conclusion, we have provided evidence that S protein induces IL-8 in PBMC in vitro and in THP-1cells. Others have shown this for lung epithelial cells and fibroblasts (Chang et al. 2004). S protein induction was dose dependent. A dose of 5.6nM per 2×10⁵ PBMC increased IL-8 secretion significantly compared to mock-treated controls. The ability of S protein to increase IL-8 mRNA was mediated by activation of NF-κB possibly via TLR2 ligand and could be inhibited by the NF-κB inhibitor TPCK. The ability to detect elevated NF-κB transcription factor activity in the nucleus in response to S protein suggests that this is most likely occurs by the mechanism of induction. Moreover increased secretion of IL-8 and IL-6 cytokines indicated that levels of proinflammatory mediators could be enhanced by S protein interaction with monocyte macrophages and could stimulate NK, neutrophil and monocyte migration to the site of infection.
Acknowledgments
NIH Grant 5R21AI159039-2 awarded to A.R. Collins provided funds for the research. Kate Rittenhouse-Olson, Ph.D. gave a critical review of the manuscript.
Footnotes
Publisher's Disclaimer: This is a PDF file of an unedited manuscript that has been accepted for publication. As a service to our customers we are providing this early version of the manuscript. The manuscript will undergo copyediting, typesetting, and review of the resulting proof before it is published in its final citable form. Please note that during the production process errors may be discovered which could affect the content, and all legal disclaimers that apply to the journal pertain.
References
- Beniac DR, Andonov A, Grudeski E, Booth TF. Architecture of the SARS coronavirus prefusion spike. Nat Struct Mol Biol. 2006;13:751–2. doi: 10.1038/nsmb1123. [DOI] [PMC free article] [PubMed] [Google Scholar]
- Bosch BJ, Bartelink W, Rottier PJ. Cathepsin L functionally cleaves the Severe Acute respiratory Syndrome coronavirus class I fusion protein upstream of rather than adjacent to the fusion peptide. J Virol. 2008;82:8887–90. doi: 10.1128/JVI.00415-08. [DOI] [PMC free article] [PubMed] [Google Scholar]
- Cameron MJ, Ran L, Xu L, Danesh A, Bermejo-Martin JF, Cameron CM, Muller MP, Gold WL, Richardson SE, Poutanen SM, Willey BM, DeVries ME, Fang Y, Seneviratne C, Bosinger SE, Persad D, Wilkinson P, Greller LD, Somogyi R, Humar A, Keshavjee S, Louie M, Loeb MB, Brunton J, McGeer AJ, Kelvin DJ Canadian SARS Research Network. Interferon-mediated immunopathological events are associated with atypical innate and adaptive immune responses in patients with severe acute respiratory syndrome. J Virol. 2007;81:8692–8706. doi: 10.1128/JVI.00527-07. [DOI] [PMC free article] [PubMed] [Google Scholar]
- Chang YJ, Liu CY-Y, Chiang BL, Chao YC, Chen CC. Induction of IL-8 release in lung cells via activator protein-1 by recombinant baculovirus displaying severe acute respiratory syndrome-coronavirus spike proteins: identification of two functional regions. J Immunol. 2004;173:7602–7614. doi: 10.4049/jimmunol.173.12.7602. [DOI] [PubMed] [Google Scholar]
- Chen J, Subbarao K. The immunobiology of SARS. Ann Rev Immunol. 2007;25:443–7. doi: 10.1146/annurev.immunol.25.022106.141706. [DOI] [PubMed] [Google Scholar]
- Cheung CY, Poon LL, Ng IH, Luk W, Sia SF, Wu MH, Chan KH, Yuen KY, Gordon S, Guan Y, Peiris JS. Cytokine responses in severe acute respiratory syndrome coronavirus-infected macrophages in vitro: possible relevance to pathogenesis. J Virol. 2005;79:7819–26. doi: 10.1128/JVI.79.12.7819-7826.2005. [DOI] [PMC free article] [PubMed] [Google Scholar]
- Collins AR. In vitro detection of apoptosis in monocytes/macrophages infected with human coronavirus 229E. Clin Diag Lab Immunol. 2002;9:1392–1395. doi: 10.1128/CDLI.9.6.1392-1395.2002. [DOI] [PMC free article] [PubMed] [Google Scholar]
- Collins AR, Grubb A. Cystatin D, a natural salivary cysteine protease inhibitor, inhibits coronavirus replication at its physiologic concentration. Oral Microbiol Immunol. 1998;13:59–61. doi: 10.1111/j.1399-302X.1998.tb00753.x. [DOI] [PMC free article] [PubMed] [Google Scholar]
- Corver J, Broer R, van Kasteren P, Spaan W. GxxxG motif of severe acute respiratory syndrome coronavirus spike glycoprotein transmembrane domain is not involved in trimerization and is not important for entry. J Virol. 2007;81:8352–8355. doi: 10.1128/JVI.00014-07. [DOI] [PMC free article] [PubMed] [Google Scholar]
- Davis JN, Kucuk O, Djuric Z, Sarkar FH. Soy isoflavone supplementation in healthy men prevents NF-κB activation by TNF-α in blood lymphocytes. Free Radical Biol and Med. 2001;30:1293–1302. doi: 10.1016/s0891-5849(01)00535-4. [DOI] [PubMed] [Google Scholar]
- Du L, Kao RY, Zhou Y, He Y, Zhao G, Wong C, Jiang S, Yuen KY, Jin DY, Zheng BJ. Cleavage of spike protein of SARS coronavirus by protease factor Xa is associated with viral infectivity. Biochem Biophys Res Commun. 2007;359:174–179. doi: 10.1016/j.bbrc.2007.05.092. [DOI] [PMC free article] [PubMed] [Google Scholar]
- Elass E, Aubry L, Masson M, Denys A, Guérardel Y, Maes E, Legrand D, Mazurier J, Kremer L. Mycobacterial lipomannan induces matrix metalloproteinase-9 expression in human macrophagic cells through a Toll-like receptor 1 (TLR1)/TLR2- and CD14-dependent mechanism. Infect Immun. 2005;73:7064–8. doi: 10.1128/IAI.73.10.7064-7068.2005. [DOI] [PMC free article] [PubMed] [Google Scholar]
- Fan J, Ye RD, Malik AB. Transcriptional mechanisms of acute lung injury. Am J Physiol Lung Cell Mol Physiol. 2001;281:1037–1050. doi: 10.1152/ajplung.2001.281.5.L1037. [DOI] [PubMed] [Google Scholar]
- Finberg RW, Wang JP, Kurt-Jones EA. Toll like receptors and viruses. Rev Med Virol. 2007;17:35–43. doi: 10.1002/rmv.525. [DOI] [PubMed] [Google Scholar]
- Frieman M, Heise M, Baric R. SARS coronavirus and innate immunity. Virus Res. 2008;133:101–112. doi: 10.1016/j.virusres.2007.03.015. [DOI] [PMC free article] [PubMed] [Google Scholar]
- He Y, Zhou Y, Siddiqui P, Jiang S. Inactivated SARS-CoV vaccine elicits high titers of spike protein-specific antibodies that block receptor binding and virus entry. Bioch Biophys Res Commun. 2004;325:445–452. doi: 10.1016/j.bbrc.2004.10.052. [DOI] [PMC free article] [PubMed] [Google Scholar]
- He L, Ding Y, Zhang Q, Che X, He Y, Shen H, Wang H, Li Z, Zhao L, Geng J, Deng Y, Yang L, Li J, Cai J, Qiu L, Wen K, Xu X, Jiang S. Expression of elevated levels of pro-inflammatory cytokines in SARS-CoV-infected ACE2+ cells in SARS patients: relation to the acute lung injury and pathogenesis of SARS. J Pathol. 2006;210:288–297. doi: 10.1002/path.2067. [DOI] [PMC free article] [PubMed] [Google Scholar]
- He L, Ding YQ, Wang W, Zhang QL, Zhang JH, Geng J, Cai JJ. Expression of immune cells and their roles in the involved tissues of SARS patients. Di Yi Jun Yi Da Xue Xue Bao. 2003;8:774–6. 780. Chinese. [PubMed] [Google Scholar]
- He Y, Li J, Heck S, Lustigman S, Jiang S. Antigenic and immunogenic characterization of recombinant baculovirus-expressed severe acute respiratory syndrome coronavirus spike protein: implication for vaccine design. J Virol. 2006;80:5757–5767. doi: 10.1128/JVI.00083-06. [DOI] [PMC free article] [PubMed] [Google Scholar]
- Henkel T, Machleidt T, Alkalay I, Krönke M, Ben-Neriah Y, Baeuerle PA. Rapid proteolysis of IκB-α is necessary for activation of transcription factor NF-κB. Nature. 1993;365:182–185. doi: 10.1038/365182a0. [DOI] [PubMed] [Google Scholar]
- Hillian AD, Londono D, Dunn JM, Goddard KA, Pace RG, Knowles MR, Drumm ML CF Gene Modifier Study Group. Modulation of cystic fibrosis lung disease by variants in interleukin-8. Genes Immun. 2008;9:501–8. doi: 10.1038/gene.2008.42. [DOI] [PMC free article] [PubMed] [Google Scholar]
- Hsueh PR, Chen PJ, Hsiao CH, Yeh SH, Cheng WC, Wang JL, Chiang BL, Chang SC, Chang FY, Wong WW, Kao CL, Yang PC. Patient data, early SARS epidemic. Emerg Infect Dis. 2004;10:489–493. doi: 10.3201/eid1003.030571. [DOI] [PubMed] [Google Scholar]
- Huang IC, Bosch BJ, Li F, Li W, Lee KH, Ghiran S, Vasilieva N, Dermody TS, Harrison SC, Dormitzer PR, Farzan M, Rottier PJ, Choe H. SARS coronavirus, but not human coronavirus NL63, utilizes cathepsin L to infect ACE2-expressing cells. J Biol Chem. 2006;281:3198–203. doi: 10.1074/jbc.M508381200. [DOI] [PMC free article] [PubMed] [Google Scholar]
- Inoue Y, Tanaka N, Tanaka Y, Inoue S, Morita K, Zhuang M, Hattori T, Sugamura K. Clathrin-dependent entry of severe acute respiratory syndrome coronavirus into target cells expressing ACE2 with the cytoplasmic tail deleted. J Virol. 2007;81:8722–9. doi: 10.1128/JVI.00253-07. [DOI] [PMC free article] [PubMed] [Google Scholar]
- Jovasevic V, Liang L, Roizman B. Proteolytic cleavage of VP1-2 is required for release of herpes simplex virus 1 DNA into the nucleus. J Virol. 2008;82:3311–9. doi: 10.1128/JVI.01919-07. [DOI] [PMC free article] [PubMed] [Google Scholar]
- Li F, Berardi M, Li W, Farzan M, Dormitzer PR, Harrison SC. Conformational states of the severe acute respiratory syndrome coronavirus spike protein ectodomainn. J Virol. 2006;80:6794–6800. doi: 10.1128/JVI.02744-05. [DOI] [PMC free article] [PubMed] [Google Scholar]
- Li L, Wo J, Shao J, Zhu H, Wu N, Li M, Yao H, Hu M, Dennin RH. SARS-coronavirus replicates in mononuclear cells of peripheral blood (PBMCs) from SARS patients. J Clin Virol. 2003;28:239–244. doi: 10.1016/S1386-6532(03)00195-1. [DOI] [PMC free article] [PubMed] [Google Scholar]
- Li W, Moore MJ, Vasilieva N, Sui J, Wong SK, Berne MA, Somasundaran M, Sullivan JL, Luzuriaga K, Greenough TC, Choe H, Farzan M. Angiotensin-converting enzyme 2 is a functional receptor for the SARS coronavirus. Nature. 2003;426:450–4. doi: 10.1038/nature02145. [DOI] [PMC free article] [PubMed] [Google Scholar]
- Luo Z, Matthews AM, Weiss SR. Amino acid substitutions within the leucine zipper domain of the murine coronavirus spike protein cause defects in oligomerization and the ability to induce cell-to-cell fusion. J Virol. 1999;73:8152–8159. doi: 10.1128/jvi.73.10.8152-8159.1999. [DOI] [PMC free article] [PubMed] [Google Scholar]
- Maeda J, Repass JF, Maeda A, Makino S. Membrane topology of coronavirus E protein. Virol. 2001;281:163–169. doi: 10.1006/viro.2001.0818. [DOI] [PMC free article] [PubMed] [Google Scholar]
- Mahajan SD, Schwartz SA, Aalinkeel R, Chawda RP, Sykes DE, Nair MP. Morphine modulates chemokine gene regulation in normal human astrocytes. Clin Immunol. 2005;115:323–332. doi: 10.1016/j.clim.2005.02.004. [DOI] [PubMed] [Google Scholar]
- Mizzen L, Daya M, Anderson R. The role of protease-dependent cell membrane fusion in persistent and lytic infections of murine hepatitis virus. Adv Exp Biol Med. 1986;218:175–186. doi: 10.1007/978-1-4684-1280-2_22. [DOI] [PubMed] [Google Scholar]
- Pulford DJ, Britton P. Intracellular processing of the porcine coronavirus transmissible gastroenteritic virus spike protein expressed by recombinant vaccinia virus. Virol. 1991;182:765–773. doi: 10.1016/0042-6822(91)90617-K. [DOI] [PMC free article] [PubMed] [Google Scholar]
- Rosenau C, Emery D, Kaboord B, Qaranfleh MW. Development of a high throughput plate-based chemiluminescent transcription factor assay. J Biomolecular Screening. 2004;9:334–342. doi: 10.1177/1087057103261446. [DOI] [PubMed] [Google Scholar]
- Shao H, Lan D, Duan Z, Liu Z, Min J, Zhang L, Huang J, Su J, Chen S, Xu A. Upregulation of mitochondrial gene expression in PBMC from convalescent SARS patients. J Clin Immunol. 2006;26:546–54. doi: 10.1007/s10875-006-9046-y. [DOI] [PMC free article] [PubMed] [Google Scholar]
- Song HC, Seo MY, Stadler K, Yoo BJ, Choo QL, Coates SR, Uematsu Y, Harada T, Greer CE, Polo JM, Pileri P, Eickmann M, Rappuoli R, Abrignani S, Houghton M, Han JH. Synthesis and characterization of a native, oligomeric form of recombinant severe acute respiratory syndrome coronavirus spike glycoprotein. J Virol. 2004;78:10328–35. doi: 10.1128/JVI.78.19.10328-10335.2004. [DOI] [PMC free article] [PubMed] [Google Scholar]
- Sui J, Li W, Murakami A, Tamin A, Matthews LJ, Wong SK, Moore MJ, Tallarico AS, Olurinde M, Choe H, Anderson LJ, Bellini WJ, Farzan M, Marasco WA. Potent neutralization of severe acute respiratory syndrome (SARS) coronavirus by a human mAb to S1 protein that blocks receptor association. Proc Natl Acad Sci U S A. 2004;101:2536–41. doi: 10.1073/pnas.0307140101. [DOI] [PMC free article] [PubMed] [Google Scholar]
- Thorp EB, Boscarino JA, Logan HL, Goletz JT, Gallagher TM. Palmitoylations on murine coronavirus spike proteins are essential for virion assembly and infectivity. J Virol. 2006;80:1280–1289. doi: 10.1128/JVI.80.3.1280-1289.2006. [DOI] [PMC free article] [PubMed] [Google Scholar]
- Tseng CT, Perrone LA, Zhu H, Makino S, Peters CJ. Severe acute respiratory syndrome and the innate immune responses: modulation of effector cell function without productive infection. J Immunol. 2005;174:7977–85. doi: 10.4049/jimmunol.174.12.7977. [DOI] [PubMed] [Google Scholar]
- Versteeg GA, van de Nes PS, Breedenbeek PJ, Spaan WJM. The coronavirus Spike protein induces endoplasmic reticulum stress and upregulation of intracellular chemokine mRNA concentrations. J Virol. 2007;8:10981–10990. doi: 10.1128/JVI.01033-07. [DOI] [PMC free article] [PubMed] [Google Scholar]
- Walsh KB, Lodoen MB, Edwards RA, Lanier LL, Lane TE. Evidence for differential roles for NKG2D receptor signaling in innate host defense against Coronavirus-Induced neurological and liver disease. J Virol. 2008;82:3021–3030. doi: 10.1128/JVI.02032-07. [DOI] [PMC free article] [PubMed] [Google Scholar]
- Wang W, Ye Linbai, Ye L, Li B, Gao B, Zeng Y, Kong L, Fang X, Zheng H, Wu Z, She Y. Up-regulation of IL-6 and TNF-α induced by SARS-coronavirus spike protein in murine macrophages via NF-κB pathway. Virus Res. 2007;128:1–8. doi: 10.1016/j.virusres.2007.02.007. [DOI] [PMC free article] [PubMed] [Google Scholar]
- Wolk DM. WS-18. Basis biostatistics for clinical microbiologists. American Society for Microbiology General Meeting; Boston MA. 2008. [Google Scholar]
- Yeager CL, Ashmun RA, Williams RK, Cardellichio CB, Shapiro LH, Look AT, Holmes KV. Human aminopeptidase N is a receptor for human coronavirus 229E. Nature. 1992;357:420–2. doi: 10.1038/357420a0. [DOI] [PMC free article] [PubMed] [Google Scholar]
- Yu S-Y, Hu Y-W, Liu X-Y, Xiong W, Zhou Z-T, Yuan Z-H. Gene expression profiles in peripheral blood mononuclear cells of SARS patients. World J Gastroenterol. 2005;11:5037–5043. doi: 10.3748/wjg.v11.i32.5037. [DOI] [PMC free article] [PubMed] [Google Scholar]
- Zhu H, Dinsdale D, Alnemri ES, Cohen GM. Apoptosis in human monocytic THP.1 cells involves several distinct targets of N-tosyl-L-phenylalanyl chloromethyl ketone (TPCK) Cell Death Differ. 1997;4:590–9. doi: 10.1038/sj.cdd.4400284. [DOI] [PubMed] [Google Scholar]