Abstract
The frequency organization of neurons in the forebrain Field L complex (FLC) of adult starlings was investigated to determine the effects of hair cell (HC) destruction in the basal portion of the basilar papilla (BP) and of subsequent HC regeneration. Conventional microelectrode mapping techniques were used in normal starlings and in lesioned starlings either 2 days or 6–10 weeks after aminoglycoside treatment. Histological examination of the BP and recordings of auditory brainstem evoked responses confirmed massive loss of HCs in the basal portion of the BP and hearing losses at frequencies above 2 kHz in starlings tested 2 days after aminoglycoside treatment. In these birds, all neurons in the region of the FLC in which CFs normally increase from 2 to 6 kHz had characteristic frequency (CF) in the range 2–4 kHz. The significantly elevated thresholds of responses in this region of altered tonotopic organization indicated that they were the residue of pre-lesion responses and did not reflect central nervous system plasticity. In the long-term recovery birds, there was histological evidence of substantial HC regeneration. The tonotopic organization of the high frequency region of the FLC did not differ from that in normal starlings, but the mean threshold at CF in this frequency range was intermediate between the values in the normal and lesioned short-recovery groups. The recovery of normal tonotopicity indicates considerable stability of the topography of neuronal connections in the avian auditory system, but the residual loss of sensitivity suggests deficiencies in high-frequency HC function.
Keywords: avian forebrain, hair cells, hearing loss, ototoxicity, plasticity, tonotopic organization
INTRODUCTION
Birds, unlike mammals, have the ability to regenerate hair cells (HCs) following damage to the peripheral auditory organ, the basilar papilla (BP) (see Cotanche (1999) and Bermingham-McDonogh and Rubel (2003) for reviews). Aminoglycoside antibiotics cause damage to both short and tall HCs over a region of the papilla extending from the base for a distance that depends on the dose administered and the duration of administration. Recovery of neural and behavioral thresholds after aminoglycoside treatment is correlated with HC regeneration. Although there are differences in the detailed results of different studies, there is general agreement that although auditory nerve, brainstem, and behavioural thresholds show substantial recovery, they can remain elevated by up to 25 dB at high frequencies 20 weeks or more after the time of the ototoxic treatment (see Smolders (1999) and Bermingham-McDonogh and Rubel (2003) for reviews).
Whether the residual high-frequency hearing loss in these animals is entirely attributable to the peripheral changes or reflects changes in the central nervous system (CNS) that are a consequence of the period of greatly reduced sensory input is unclear. The changes that could potentially occur in central auditory neurons as a consequence of peripheral damage range from direct consequences of the reduced input to dynamic processes of central reorganization triggered by the altered input. The latter possibility is suggested by studies showing dynamic reorganization of topographic representations of receptor surfaces in sensory cortices of adult mammals when input from part of the receptor surface is eliminated by a restricted lesion of that surface (see Kaas and Florence (2001) for review). In the case of the auditory system, a restricted cochlear lesion in adult mammals that eliminates input to the CNS over a limited frequency range results in a change in the frequency organization of primary auditory cortex, such that the region deprived of its normal input by the lesion is occupied by expanded representations of peri-lesion frequencies (see Irvine (2005) for review). These changes are not explicable as passive consequences of the lesion; they are assumed to reflect changes in neural connectivity, and are thus considered to be manifestations of CNS plasticity.
The effects of HC loss and regeneration in birds have not been examined using physiological measures at levels above the brain stem, and it is not known whether reorganization of the type seen in mammalian sensory cortices occurs in the homologous areas of the avian forebrain. If it does, then the properties of forebrain auditory responses after HC regeneration would depend in part on the extent to which plastic changes driven by the peripheral lesion are reversed when normal input is restored. The aim of this study was, therefore, to investigate the changes in the frequency organization of the auditory forebrain in birds produced by a restricted aminoglycoside-induced lesion of the BP, and the extent to which these changes are reversed following HC regeneration. A preliminary report of some of these data has appeared (Irvine et al., 2000).
MATERIAL AND METHODS
Experiments were carried out on mature European starlings (Sturnus vulgaris; weight range at beginning of experiment: 69–85 gm), wild caught in either Seattle, USA, or Melbourne, Australia. All procedures were approved by the University of Washington Institutional Animal Care and Use Committee (IACUC) and by the Monash University Department of Psychology Animal Ethics Committee. The frequency organization of the Field L complex (FLC; the avian homologue of the mammalian auditory cortex) was examined by conventional microelectrode mapping techniques in three groups of birds: normal starlings (identified by prefix SN); starlings in which restricted BP lesions were produced by a two- or three-week regime of daily injections of the ototoxic agent kanamycin sulphate, and the FLC was examined two days after the last injection (identified by the prefix SLSR; i.e., lesion, short recovery); and starlings that were allowed a long recovery period of 6–10 weeks after the injection regime (identified by the prefix SLLR; i.e., lesion, long recovery).
Ototoxic injections and recovery procedures
The kanamycin injection regime was based on that developed by Marean et al. (1993) and found to result in highly reproducible damage to the basal third of the BP. The major departure from their procedures was that injections were given intraperitoneally (ip) rather than subcutaneously. Each bird was given ip injections of kanamycin dissolved in normal saline at a dose rate of 100 mg/kg/day for two days and 200 mg/kg/day for a further 11 or 19 days (13- and 21-day injection regimes, respectively). Each animal was weighed every two days during the injection regime to ensure that the systemic effects of the injections did not result in excessive weight loss. Because of the possibility that these systemic effects might compromise the birds’ ability to survive the long period of anesthesia required for electrophysiological recording, short-recovery animals (SLSR group) were tested neurophysiologically 2 days after the last injection. Long-recovery animals (SLLR group) were allowed periods of 6–10 weeks after the last injection for HC regeneration prior to testing.
Surgical, stimulus generation, and electrophysiological recording procedures
The anesthetic regime was based on that described by Capsius and Leppelsack (1996). Surgical anesthesia was induced by a series (usually 5–6) of intramuscular (im) injections of 100 μl of a 20% solution of urethane at 15-minute intervals, and was maintained during surgery and electro-physiological recording by additional im injections at the same dose rate, usually at approximately hourly intervals. Throughout the recording sessions, each starling was given subcutaneous injections of saline-glucose (5% solution) to maintain fluid balance. The bird’s core temperature was measured by means of a cloacal thermistor and maintained at ~40 °C by means of a thermostatically controlled heating blanket.
Following induction of anesthesia, the skull and neck were cleared of feathers, and a tracheal cannula was inserted. The bird’s beak was then fixed with super glue into a hypodermic needle cover (“beak extension”), and the head was then supported by holding the beak extension in a clamp while the skull was cleared of overlying tissue. A stainless-steel rod, one end of which was flattened to form an attachment plate, was than fixed to the rostral portion of the skull with a small screw and dental acrylic. This rod was held in a clamp to provide a stronger support for the bird’s head, and the caudal portion of the skull was removed to expose the caudal pole of the neostriatum and the rostral portion of the cerebellum on the left side. The tympanic membrane on the left side was inspected using a surgical microscope, and in some cases the flap of skin partially overlying the external meatus was resected to allow insertion of the sound delivery speculum.
All electrophysiological recordings were made with the animal enclosed in a double-walled, sound attenuated booth. Shaped tone pulses (see details of parameters below) were generated digitally, and were presented monaurally to the left ear via a transducer in a special coupler (Seattle laboratory: Etymotic Research ER3A; Melbourne laboratory: Stax SRS-MK3 (Sokolich 1981)), which terminated in a speculum that fitted snugly into the bird’s external meatus. Calibration procedures in the two laboratories were similar except that in the Seattle lab stimuli were calibrated on line for each animal using a low noise microphone (Etymotic Research ER-10B), whereas the Melbourne laboratory used an acoustic coupler calibrated off-line (Heil et al., 1992). All sound pressure levels (SPLs) are expressed in dB re 20 μP.
Normal hearing in controls and the extent of threshold shift in lesioned birds were established by recording tone-evoked ABERs and determining threshold as a function of frequency to generate an ABER audiogram. A bipolar electrode was lowered into the brainstem on the left side, approximately 1.5 mm from the midline and at the level of the rostral edge of the cerebellum. The depth profile of averaged ABERs to a standard intensity click stimulus was determined, and the electrode was positioned at the site at which the largest click-evoked responses was obtained in order to record tone-evoked responses. ABER thresholds were determined (using a 6 ± 1-μv peak-to-peak amplitude criterion) at frequencies from 0.5 to 6 or 7 kHz on the basis of averaged responses (200 sweeps) to short tone bursts (10-ms duration; 1-ms rise – fall time).
Multi-unit (“cluster”) recordings were made from the FLC using glass insulated microelectrodes (impedance 0.8–1.3 MΩ at 1 kHz). A series of penetrations into the right forebrain were made at locations based on the descriptions of the frequency organization of the FLC provided by Rübsamen and Dörrscheidt (1986) and Capsius and Leppelsack (1996). The first penetration was usually made at a location 0.6 mm from the midline and approximately 3 mm rostral of the caudal pole of the hemisphere. The locations of subsequent penetrations were based on the responses encountered in that penetration, but generally formed a grid comprising a line of entry points in that lateral plane separated by 400 μm in the rostro-caudal plane, and a second line 300–400 μm more lateral. All penetrations were angled approximately 10° from dorso-caudal to rostro-ventral in an attempt to pass through the FLC approximately orthogonal to the orientation of iso-frequency contours (Rübsamen and Dörrscheidt, 1986).
In each penetration, the electrode was advanced rapidly until the first acoustically evoked multi-unit activity was encountered, and recordings were then made at that site and at a series of more ventral sites separated by 100 or 200 μm. Neural activity was amplified (x1000), filtered (300 Hz – 3 kHz bandwidth), and monitored on an oscilloscope and audiomonitor. At each recording site, the approximate characteristic frequency (CF; frequency at which threshold is lowest) and threshold at CF were first determined audiovisually. Quantitative data on the frequency response area were then obtained using a Schmitt trigger with level set well above the noise to isolate only larger action potentials of the cluster. Rectangular pulses generated by the Schmitt trigger were sent to a unit-event timer, and event (stimulus and spike) times were then fed to the computer.
As described previously (e.g., Kamke et al., 2003), the response area program presented tone bursts (100-ms duration; 4-ms rise – fall time) whose frequency and intensity were varied in accordance with a frequency-intensity matrix defined on the basis of the audiovisual determination of CF and of the suprathreshold frequency response range. In each of the repetitions (normally 5) of the frequency-intensity combinations in the matrix, the stimuli were presented (at a rate of 2 Hz) in a different pseudorandom order. At each frequency-intensity combination the number of spikes occurring in specified count windows was summed over the five stimulus presentations. The response area for each count window was displayed as a matrix in which the size of a vertical bar at each frequency-intensity point was scaled to the number of spikes, and the spike count data were stored for off-line analysis. Trials on which no stimulus was presented were interspersed regularly throughout the data collection period (usually every 20th stimulus presentation) to obtain a reliable estimate of the level of spontaneous activity. The number of spontaneous spikes occurring in blocks containing a number of trials equal to the number of repetitions of the matrix (i.e., usually 5) were summed, and the mean and standard deviation (SD) were calculated over the total number of blocks. Responses that were less than 1.64 SDs above the mean spontaneous activity were eliminated in a “clipped” version of the response area matrix. A frequency tuning curve was derived from the clipped version of the matrix, and quantitative data on the CF and threshold at CF were derived from this tuning curve. A peri-stimulus time histogram was also obtained for each cluster at a level ~25 dB above threshold at its CF.
All statistical analyses of the group data were performed using SPSS (SPSS 16.0 for Mac; Chicago, Illinois). The data were examined for outliers and points of high influence using studentized deleted residuals, centered leverage values, and Cook’s distance.
Histology
At the end of the recording session the bird was killed with an anesthetic overdose, the left cochlea was perfused via the round window with 2.5% gluteraldehyde and 2.5% paraformaldehyde in 0.1M phosphate buffered saline (PBS), and the brain was removed and placed in paraformaldehyde. Histological procedures for scanning electron microscopic examination of the BP in lesioned birds were based on those described by Marean et al. (1993). The temporal bone was removed, and the BP exposed using standard microdissection techniques. The specimens were than placed in 1% osmium tetroxide for one hour, followed by several washes in PBS. Specimens were then dehydrated in a graded ethanol series prior to final dissection. The tectorial membrane was removed under 70% ethanol. After critical point drying, specimens were mounted on aluminium stubs, and coated with gold palladium prior to examination with either a JEOL JSM 6300F or JEOL JSM 840A scanning electron microscope to document the extent and location of hair cell damage, loss and regeneration in each animal. Blocks containing the right forebrain were sectioned (50 μm) on a freezing microtome, and mounted sections were stained for Nissl. Sections were viewed on a profile projector, and recording sites were identified on the basis of recorded depth measurements and marking lesions made at the end of the recording session.
RESULTS
ABERs and frequency organization of the FLC in normal starlings
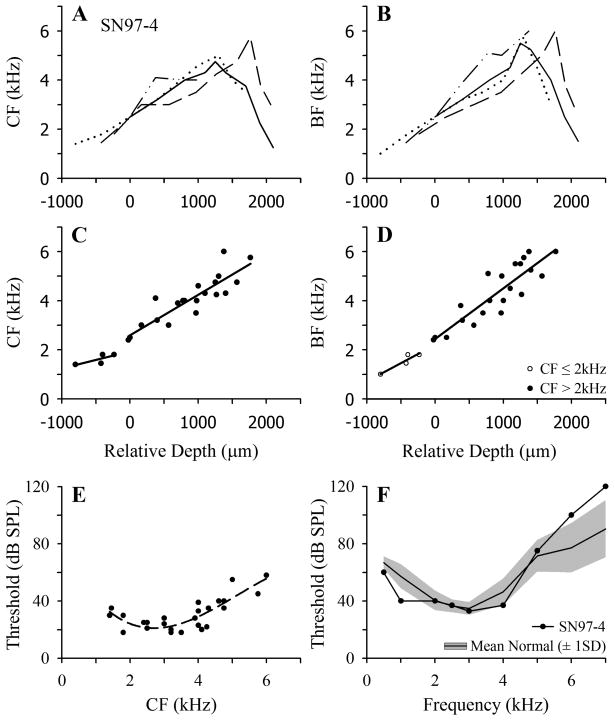
In Figure 1F the mean ABER audiogram ± one SD (shaded region) for a large sample of normal starlings is shown together with the audiogram for an individual normal starling (SN97-4) for which representative data are presented in Fig. 1A–E. The mean ABER function indicates a hearing range extending to 6–7 kHz, with lowest thresholds in the region of 3 kHz.
Fig. 1.
Frequency mapping data for an individual normal starling (SN97-4). A and B. Characteristic frequency (CF) and best frequency (BF), respectively, as a function of recording depth in multiple penetrations through the FLC. Data for four penetrations are indicated by different lines. Relative depth is normalized to that at which the CF closest to 2.5 kHz was encountered. C and D. CF and BF data, respectively, from all points in the four penetrations, up to that at which the frequency reversal occurred in each penetration. Solid lines are linear regression functions fitted to points with CF ≤ 2 kHz and CF > 2 kHz (see text). E. Threshold at CF as a function of CF for multi-unit clusters in starling SN97-4; solid line is fitted polynomial function. F. ABER audiogram for starling SN97-4 (filled circles); the solid black line shows the mean normal starling ABER audiogram based on a large sample (N = 10) of normal starlings, and the shaded region shows ± 1 standard deviation (SD) range around the mean.
Although the frequency organization of the FLC in normal starlings has been described by others, it was important to obtain control data in these experiments using the procedures to be employed with the lesioned animals. Capsius and Leppelsack (1996) distinguished a number of subdivisions of the FLC, defined on the basis of response patterns and latency. The central area, designated NA-L, was characterized by short-latency, strong, sustained responses to tone burst stimuli, whereas responses in the surrounding areas tended to be either onset or long-latency and very diffuse. In agreement with these observations, some penetrations yielded responses comprising a strong, short-latency (~10 ms) onset burst followed by a lower level of discharge sustained for the duration of the tone burst. The peri-stimulus time histograms of these multi-unit clusters were similar to those of mammalian auditory nerve fibres, i.e., were primarylike (Pfeiffer, 1966) in form, as described previously in unanaesthetized starlings (Nieder and Klump, 1999). In other penetrations, the majority of clusters exhibited either onset responses or diffuse long-latency responses, which commonly extended well beyond the stimulus duration.
Mapping data from a series of penetrations in normal starling SN97-4 are shown in Fig. 1A–E. In Fig. 1A, each line shows the variation in CF as a function of depth in a single penetration, and all functions have been normalized to the depth at which multi-unit activity with CF closest to 2.5 kHz was encountered. In all four penetrations there is a similar increase in CF with depth, to a maximum in the range 4–6 kHz, and in three penetrations there is a frequency reversal at greater depths. The low-to-high frequency dorsal to ventral tonotopic organization revealed here is in accord with the earlier reports of Rübsamen and Dörrscheidt (1986) and Capsius and Leppelsack (1996). The curves all show a very similar frequency gradient, although the penetrations differed in the range over which they remained in the core zone of short-latency sustained responses, suggesting that a single tonotopic gradient extends through the major divisions of the FLC. The frequency reversal ventral to the core zone was also reported by Capsius and Leppelsack (1996), and marks the transition between the regions they identified as NA-L and NA2a. The CF threshold data for this starling are shown in Fig. 1E, and a polynomial function is fitted to the data.
Because of the possibility that the effects of cochlear lesions and regeneration on frequency organization might differ for responses at low and high sound pressure levels (SPLs), frequency organization was also examined in terms of the best frequency (BF; the frequency evoking the strongest response) of multi-unit clusters. These data for SN97-4 are plotted in Fig. 1B, and show a tonotopy very similar to that for CF, except for the fact that BF in three of the four penetrations extends to higher frequencies than CF.
In Fig. 1C and D, respectively, the CF and BF data are shown for all recording sites in the four penetrations in SN97-4 up to the points at which the frequency reversals occurred. For reasons elaborated below in presentation of the data from the lesioned starlings, separate linear regression functions have been fitted to the data for frequencies ≤ 2 kHz and > 2 kHz (solid black lines).
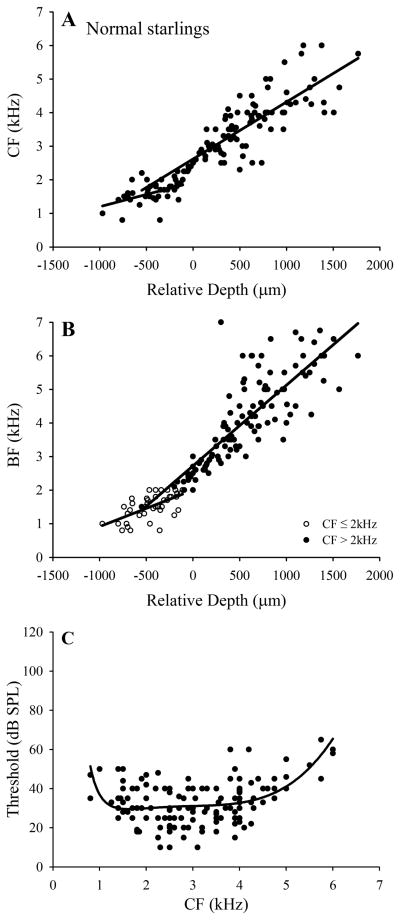
The pooled data for all normal starlings and the linear regression functions in the two frequency ranges are shown in Figs. 2A and B; the fits are better in the high-frequency range, as would be expected from the greater frequency range involved and the larger number of data points. Finally, the thresholds at CF of all multi-unit clusters recorded in the FLC in the normal starlings are shown in Fig. 2C, and a polynomial function is fitted to the data. In contrast to the ABER function, multi-unit thresholds are similar from approximately 1.5 to 4 kHz. The discrepancy in the slopes of the ABER mean curve and the threshold function reflects the fact that the ABER reflects synchronous activation of a number of neurons. The multi-unit data in Fig. 2C indicate that in the FLC (and presumably therefore at the lower levels of the pathway at which the ABER is generated) there are relatively few units with CF above 5 kHz. Generation of a detectable ABER at frequencies above 5 kHz therefore likely depends on the recruitment at higher SPLs of units with lower CF.
Fig. 2.
Group frequency mapping data for normal starlings. A and B. Pooled CF and BF data, respectively, for five normal starlings and linear regression functions (r2 values: CF ≤ 2 kHz: 0.26; CF > 2 kHz: 0.69; BF (for CF≤ 2 kHz): 0.38; BF (for CF > 2 kHz): 0.68). C. Thresholds for all multi-unit clusters in normal animals as a function of characteristic frequency (CF); solid line is fitted polynomial function.
Effects of lesions in starlings with short recovery periods (SLSR Group)
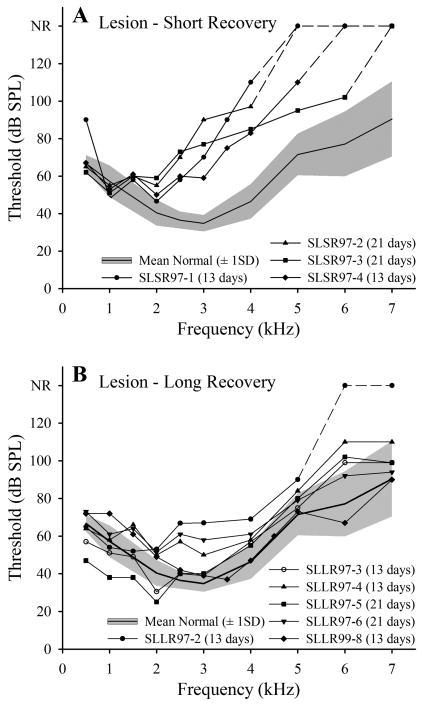
ABER audiograms for 4 starlings in the lesion – short recovery group, which were examined physiologically two days after the completion of a 13- or 21-day ototoxic injection regime, are plotted relative to the mean normal ABER audiogram in Fig. 3A. The thresholds for all animals are normal or near-normal at frequencies up to 1.5–2 kHz, but increase steeply at frequencies above 2 kHz. Broken lines indicate that no ABER could be recorded at frequencies above 4 kHz in two cases (one with 13- day and the other with 21-day injection regimes), or above 5 and 6 kHz in the other two cases (one with each injection regime). As the ABER data indicated no systematic relationship between the nature of the loss and the duration of the injection regime, the data for these 4 starlings will be combined in subsequent group analyses.
Fig. 3.
Hearing losses in lesioned starlings. A and B. ABER audiograms for individual starlings in the lesion – short recovery (SLSR) and lesion – long recovery (SLLR) groups, respectively, plotted relative to mean normal threshold ± 1SD (shaded region). NR: no response; dashed portions of lines therefore denote frequency regions at which thresholds were higher than the maximum SPLs produced by our equipment (in all cases over 110 dB). Duration of injection regime is indicated for each starling. Recordings were made two days after last injection of kanamycin, immediately prior to recordings from the FLC.
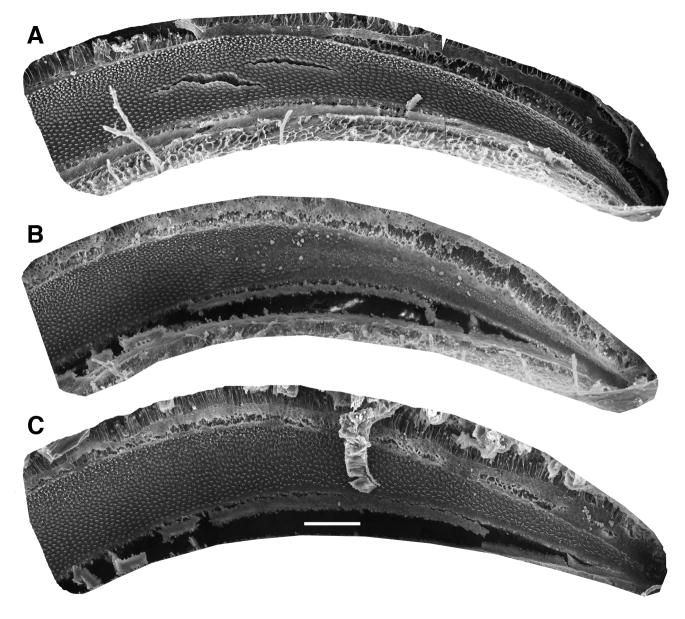
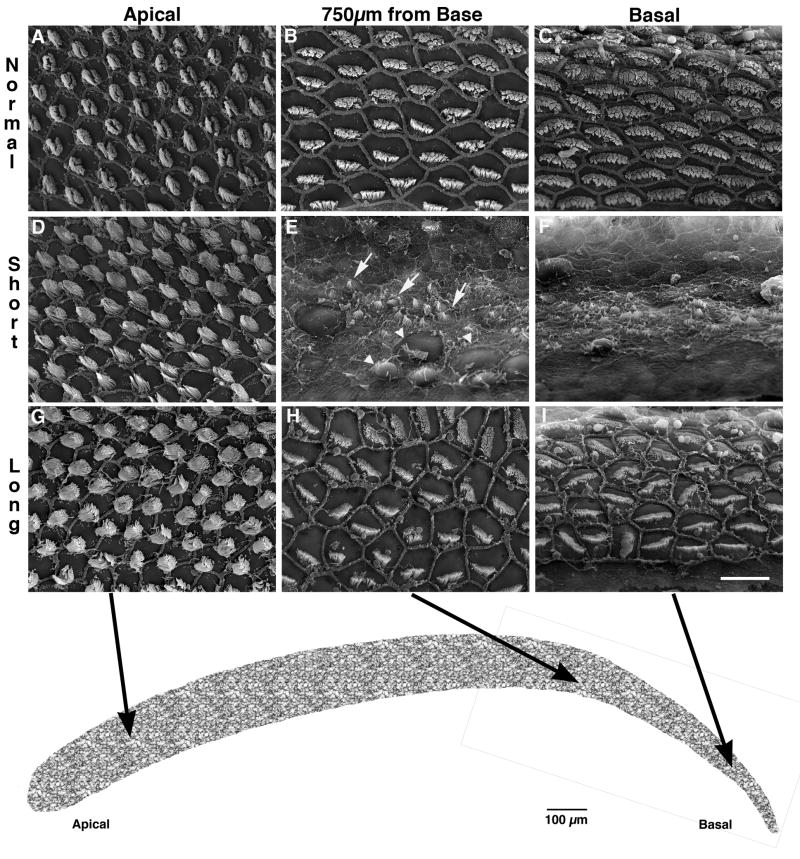
Scanning electron microscopic examination of the BP in the four starlings in the short-recovery group showed patterns of damage very similar to those described by Marean et al. (1993) after 11-day subcutaneous injection regimes at the same dose rates. As described by them, the injection regime resulted in damage to approximately the basal third of the papilla, with the damaged region comprising a zone that was devoid of mature HCs and a transition zone in which a few abnormal HCs remained. A low-power scanning electron micrograph of the basal half of the BP in starling SLSR97-1, for which physiological data are presented in Fig. 6, is shown in Fig. 4B. In comparison to the normal papilla in Fig. 4A, it reveals an area of damage extending for approximately 820 μm from the basal end of the papilla (38% of the total papilla length of 2160 μm in this starling). Higher power SEM photomicrographs from this animal are shown in the Fig. 5D–F. As described by Marean et al. (1993) for the starling and by Duckert and Rubel (1990;1993) for the chicken, some newly regenerated HCs with tiny stereocilia bundles are observed in the most basal regions and the transition region (arrows in Fig. 5E) by the termination of a multi-day course of aminoglycoside, such as used in these experiments. This was observed in all papillae from the SLSR group.
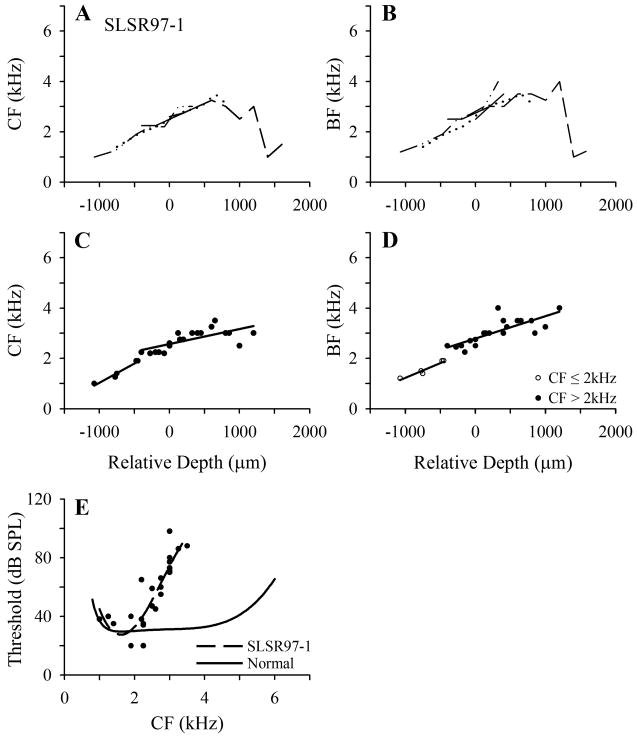
Fig. 6.
Frequency mapping data for an individual starling (SLSR97-1) in the lesion – short recovery (SLSR) group. A and B. Tonotopicity data for individual penetrations (details as in Figs. 1A and B). C and D. Pooled data from all points up to frequency reversals in the penetrations shown in A and B. As explained in the text, separate linear regression lines have been fitted for points with CF above and below 2 kHz. In D, these points are distinguished by different symbols, because CF and BF might not fall within the same frequency ranges, although in this case all points with CF in one frequency range had BF in the same range. E. Threshold as a function of CF for all recording sites plotted in C; broken line is polynomial fitted to these data; solid black line is polynomial fitted to normal threshold data (from Fig. 2C).
Fig 4.
Low-power scanning electron micrographs showing basilar papilla (BP) in representative normal, lesion – short recovery, and lesion – long recovery starlings. Each panel shows a low power scanning electron microscope image of the basal half of the BP. Scale bar (shown in A): 100 μm. A. Normal BP (from the work of Marean et al. (1993). B. BP from lesion – short recovery starling SLSR97-1, for which data are presented in Figs. 3A and 6. C: BP from lesion – long recovery starling SLLR97-5, for which data are presented in Figs. 3B and 8; note that the density of hair cells in the basal papilla appears normal, but the mosaic is abnormal.
Fig. 5.
Higher magnification scanning electron micrographs of normal (A-C), lesion – short recovery (D-F), and lesion – long recovery (G-I) starling basilar papillae shown in Fig. 4. The low-frequency (apical) region of all cases is unaffected by the kanamycin paradigm (A, D, G). Immature, regenerating hair cells (arrows) can be seen adjacent to remaining, damaged hair cells (arrowheads) in the region 750 μm from the basal tip (E) and in the basal end (F) of the BP from the short-recovery animal. This morphology is in stark contrast to that seen in the normal starling in the same regions (B and C). At longer survival times, regenerated hair cells attain a more normal appearance, although stereocilia bundles are not uniformly oriented and may display abnormal bundle morphology (H and I). The schematic representation of the entire starling basilar papilla at the bottom shows the regions from which the higher magnification photomicrographs were taken. Bar in I represents 10 μm in A-I.
The frequency mapping data for starling SLSR97-1 are presented in Fig. 6. The CF plots (Fig. 6A) show a progressive increase with relative depth up to a frequency of 2.5–3.0 kHz, but CF then varies in a restricted range of 2.5–3.5 kHz over a distance of more than 1 mm (relative depths of 0 to 1200 μm), in the region in which CF in normal starlings increases to 5–6 kHz. The BF data (Fig. 6B) show a similar pattern of variation with relative depth: BF increases progressively to approximately 3.5 kHz, but then remains relatively stable around 3–4 kHz over the range of relative depths for which BF in normal animals increases to approximately 6 kHz. The CF threshold data for this starling are shown in Fig. 6E, together with the polynomial function fitted to the normal starling threshold data (from Fig. 2C). In agreement with the ABER data, thresholds are close to the normal function at frequencies up to about 2 kHz, but increase steeply, from approximately 30 to 90 dB SPL, at progressively higher CFs.
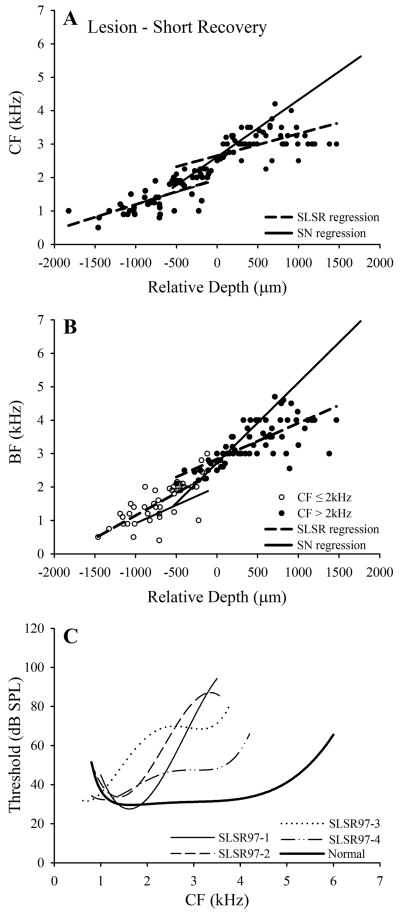
Because ABER and cluster thresholds in this and the other lesioned starlings indicate a hearing loss starting in the region of 2 kHz, separate linear regression functions were fitted to the CF and BF data (up to the point of frequency reversal) for the points with CF above and below 2 kHz, as shown for starling SLSR97-1 in Figs. 6C and D. The pooled data for the four SLSR starlings and the fitted functions are plotted in Fig. 7A and B, together with the normal functions over the two frequency ranges. For the frequency range > 2 kHz, the SLSR functions are much shallower than those of the SN functions, and the SLSR slope coefficients for both measures (Table 1) are significantly smaller than the mean SN coefficients (P < .01 in each case; these and all subsequent significance values are based on two-tailed t-tests with Bonferroni correction for multiple comparisons). In contrast, for both the CF and BF data, the SLSR and SN functions for frequencies ≤ 2 kHz have near-identical slopes, and the slope coefficients for these two groups (Table 1) are very similar and not significantly different for either measure (P > .05). In this context, it should be noted that the SLSR BF regression coefficient for the ≤ 2 kHz range was strongly influenced by one outlier point (Cooks Distance = 0.633; centered leverage = 0.206), which was removed from the analysis. Thus, the frequency organization of the FLC in the lesioned starlings is characterized by a larger than normal area in which neurons have CF in a limited frequency range (2–4 kHz) above the lesion-edge frequency.
Fig. 7.
Group frequency mapping data for lesion – short recovery (SLSR) starlings. A and B. Pooled CF and BF data, respectively, for the four SLSR starlings; broken lines are regression functions for the SLSR data; solid lines are functions for the SN group (from Fig. 2). (r2 values for the SLSR regressions: CF ≤ 2 kHz: 0.47; CF > 2 kHz: 0.37; BF (for CF ≤ 2 kHz): 0.58; BF (for CF > 2 kHz): 0.55). C. individual polynomial functions fitted to CF threshold data for the four SLSR starlings (see key), plotted with mean normal threshold function (heavy black line; from Fig. 2C).
Table 1.
| Slope coefficient (± SE) for CF (×E4) |
Slope coefficient (± SE) for BF (×E4) |
|||
|---|---|---|---|---|
| CF ≤ 2 kHz |
CF > 2 kHz |
CF ≤ 2 kHz |
CF > 2 kHz |
|
| SN | 7.27 (2.07) | 16.98 (1.12)× | 10.86 (2.23) | 24.01 (1.53)× |
| SLSR | 7.64 (1.27) | 6.57 (1.03)× † | 13.48 (1.82) | 10.71 (1.15)× † |
| SLLR | 8.63 (1.30) | 13.65 (1.01)† | 17.56 (1.36) | 22.21 (1.66)† |
Note: symbols indicate a significant difference (two-tailed t-test) between the pair of slopes identified by the same symbols for that CF range (p < .01; Bonferroni corrected for multiple comparisons).
This change in frequency organization is qualitatively similar to the enlarged representation of peri-lesion frequencies that is seen in auditory cortex and in subcortical structures after restricted cochlear lesions in mammals (see Irvine (2005) for review). As discussed in detail elsewhere (e.g., Rajan et al., 1993; Rajan and Irvine, 1998a), such changes in frequency organization can reflect neural plasticity, but can also occur as a passive consequence of cochlear lesions. Most neurons at all levels of the mammalian auditory system respond over a relatively wide frequency range at suprathreshold SPLs. At levels above the auditory nerve, these responses at higher SPLs reflect convergent input derived from regions of the cochlea other than that from which the neurons’ CF input is derived (e.g., Snyder and Sinex, 2002). For neurons with CF at and above the lesion-edge frequencies, elimination of input over the frequency range affected by the cochlear lesion would therefore be expected to leave intact input derived from lower-frequency channels. If the changed frequency organization in a given central auditory structure reflected a passive process of this sort, it would be associated with a progressive increase in threshold at CF across the region deprived of its normal input by the peripheral lesion (see Rajan et al. (1993) for detailed discussion). In the auditory cortex and thalamus of mammals with restricted cochlear lesions, the thresholds of neurons in the area of reorganization at their new CFs are normal or near-normal (Kamke et al., 2003; Rajan et al., 1993), indicating that the changes are not simply passive consequences of the cochlear lesion but reflect a dynamic process of reorganization (i.e., plasticity). In some subcortical structures (viz., the dorsal cochlear nucleus (Rajan and Irvine, 1998b) and most regions of the central nucleus of the inferior colliculus (Irvine et al., 2003)), however, the change in frequency organization is associated with an increase in thresholds across the area of changed frequency organization, indicating that the change is explicable as a passive consequence of the lesion.
These arguments are also applicable to the avian auditory system, in which the responses of central neurons across broad frequency ranges at higher SPLs similarly reflect convergent input across multiple frequency channels. In starling SLSR97-1 (Fig. 6E) thresholds increased massively across the area of changed frequency organization, and increases in threshold of similar magnitude were seen in the other starlings in the lesion – short recovery group (Fig. 7C). The smallest increase in multiunit threshold is apparent in starling SLSR97-4, in which the lesion-induced elevation in ABER thresholds was also the smallest (Fig. 3A). The mean threshold data for the SN and SLSR groups are presented in Table 2. The thresholds in the two groups for CF ≤ 2 kHz were almost identical and not significantly different, but for CFs in the 2.1–4.2 kHz range the SLSR threshold was significantly elevated (by 31 dB; P < .01). The high- frequency comparison was restricted to this range because there were no multiunit responses with CF > 4.2 kHz in the SLSR birds, whereas CFs as high as 6 kHz were encountered in normal starlings. This pattern of results indicates that the changed frequency organization seen in the FLC of the SLSR birds is associated with greatly elevated thresholds in the high-frequency range, and is therefore explicable as a passive consequence of the peripheral lesion rather than as dynamic change reflecting changes in CNS connectivity.
Table 2.
| Mean (± SE) Threshold at CF (dB SPL) |
|||
|---|---|---|---|
| CF ≤ 2 kHz |
CF 2.1–4.2 kHz |
CF > 4.2 kHz |
|
| SN | 34.8 (1.4) | 29.9 (1.1)× † | 42.7 (2.3)× |
| SLSR | 37.9 (1.4) | 60.9 (2.0)× + | |
| SLLR | 35.5 (1.2) | 44.4 (1.0)† + | 56.7 (2.6)× |
Note: symbols indicate a significant difference (two-tailed t-test) between the pair of thresholds identified by the same symbol for that CF range (p < .01; Bonferroni corrected for multiple comparisons).
Effects of lesions in starlings with long recovery periods (SLLR Group)
Six starlings were allowed to recover for 6–10 weeks following the final kanamycin injection (SLLR Group), a period sufficient for HC regeneration. The ABER audiograms for these starlings are plotted relative to the mean normal ABER audiogram in Fig. 3B. Compared to the SLSR audiograms in Fig. 3A, the SLLR functions are much more similar to the normal function: for many birds, and at many frequencies the thresholds fall within the ± 1SD range around the mean audiogram. For three of the six birds, thresholds remained slightly elevated in the 2–4 kHz range and (for different birds) at higher frequencies. The largest threshold elevations were seen in SLLR97-2, in which no response could be recorded at frequencies above 5 kHz. The recovery period in this bird was one of the longest (67 days), and in general there was no correlation between recovery time within the 6–10 week period and ABER threshold recovery.
Scanning electron microscopic examination of the BP in the starlings in the long-recovery group showed patterns of recovery similar to those described in previous studies. Micrographs of the BP in starling SLLR97-5, for which physiological data are presented in Fig. 8, are shown in Fig. 4C and Fig. 5G–I. Both the basal portion of the papilla, which in the SLSR starlings was devoid of mature HCs, and the transition zone are repopulated by mature appearing stereocilia bundles in what appear to be normal numbers and with a normal density. However, this previously damaged portion is easily identified by abnormal orientation of stereociliary bundle orientation pattern and occasional abnormal bundle morphology. These abnormalities are similar to those reported by Marean et al. (1993), and are consistent with qualitative and quantitative data reported by a number of authors working on chicken and quail (e.g., Duckert and Rubel, 1991; Cotanche and Corwin, 1991; Duckert and Rubel, 1993; Niemiec et al., 1994, Janas et al., 1995; Komeda and Raphael, 1996).
Fig. 8.
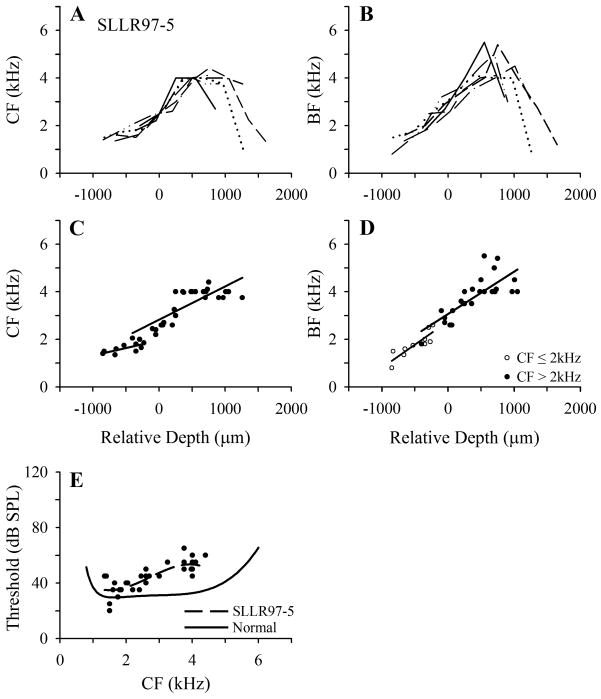
Frequency mapping data for an individual starling (SLLR97-5) in the lesion – long recovery group. A and B. Tonotopicity data for individual penetrations (details as in Figs. 1A and B). C and D. Pooled data from all points up to frequency reversals in the penetrations shown in A and B; details as in Figure 6. Note (in D) that one point with BF ≤ 2 kHz had CF > 2 kHz, and two points with BF > 2 kHz had CF ≤ 2 kHz. E. Threshold as a function of CF for all recording sites plotted in C (details as in Fig. 6E).
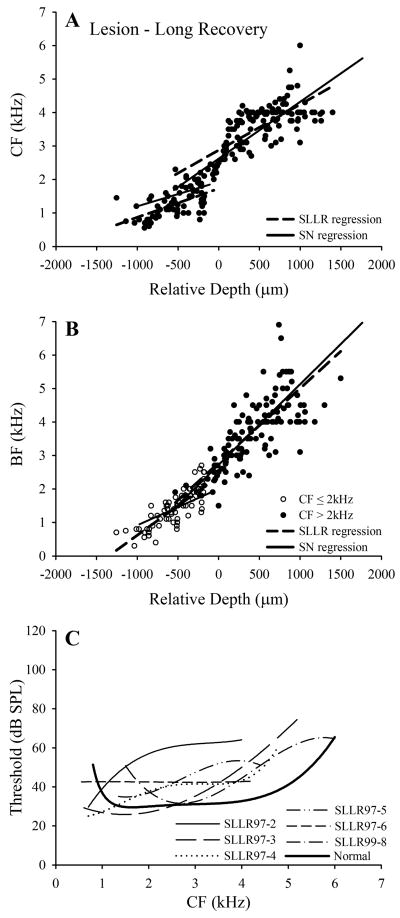
The frequency mapping data for starling SLLR97-5 are presented in Fig. 8. The CF plot (Fig. 8A) shows a progressive increase with relative depth up to a frequency of 4–4.3 kHz. In some penetrations, there is a slight tendency for the functions to plateau at this level before the region of declining CF, but this tendency is comparable to that seen in normal starlings (e.g., Fig. 1A). The BF data (Fig. 8B) show a near-linear increase up to values in the range 5–6 kHz, comparable to that seen in normal starlings (e.g., Fig. 1B). To facilitate comparison with the data from the SLSR starlings, separate linear regression functions were fitted to the CF and BF data for points with CF above and below 2 kHz, as shown for SLLR 97-5 in Figs. 8C and D. Finally, the CF threshold data for this starling are shown in Fig. 8E, together with the polynomial functions fitted to its data (broken line) and to the normal starling threshold data (heavy line; from Fig. 2C): comparison of the functions indicates that thresholds are close to normal at frequencies up to about 2.4 kHz, but are elevated by 10 to 20 dB at frequencies above 3 kHz.
The group data for the six SLLR starlings are presented in Fig. 9. The pooled CF and BF data and functions over the two frequency ranges are plotted in Figs. 9A and B, respectively, together with the mean SN functions. The SLLR mean CF and BF functions in the > 2 kHz frequency range (broken lines) are similar to, but slightly shallower than, the mean normal functions (solid lines). In the ≤ 2 kHz range, the CF functions for the two groups have very similar slopes, but the BF function for the SLLR group is steeper than that for the SN group.
Fig. 9.
Group frequency mapping data for lesion – long recovery (SLLR) starlings. A and B. Pooled CF and BF data, respectively, for the six lesion – long recovery starlings; broken lines are regression functions for the SLLR data; solid lines are functions for the SN group (from Fig. 2). (r2 values: CF ≤ 2 kHz: 0.38; CF > 2 kHz: 0.57; BF (for CF ≤ 2 kHz): 0.70; BF (for CF > 2 kHz): 0.57). C. individual polynomial functions fitted to CF threshold data for the six SLLR starlings (see key), plotted with mean normal threshold function (heavy black line; from Fig. 2C).
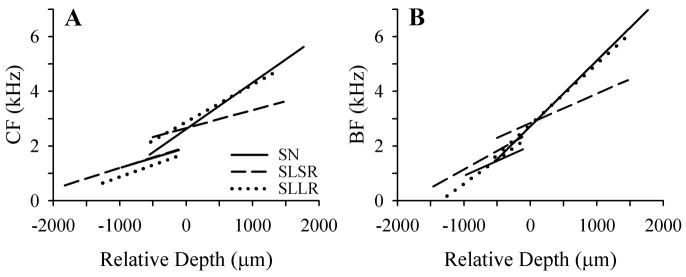
The CF – depth and BF – depth functions for all three groups are plotted together in Figs. 10A and B, respectively. In the > 2 kHz frequency range affected by the BP lesions, it is apparent that the slopes of the mean SLLR function for both CF and BF are very similar to those for the SN group, and substantially steeper than those for the SLSR group. This is supported by the mean slope coefficients in Table 1: for both measures, the SLLR coefficient is not significantly different from that of the SN group, and both are significantly larger than that of the SLSR group. In the ≤ 2 kHz frequency range, the CF functions for all three groups have very similar slopes (Fig. 10A), and the slope coefficients are not significantly different (Table 1). The BF functions in this frequency range (Fig. 10B) show more variability, but statistical comparison of the slope coefficients indicated that the differences failed to reach significance.
Fig 10.
Comparisons of mean data for the three experimental groups. A and B. Mean regression functions for CF and BF data, respectively, for the three groups.
In Fig. 9C, the polynomial functions fitted to the threshold data for the individual SLLR starlings are plotted together with the polynomial fitted to the normal data. For most of the group, thresholds are similar to normal CFs below about 2 kHz, and elevated by 10–20 dB at higher frequencies. The major exception is starling SLLR97-2, for which the threshold elevation at frequencies above 2 kHz is approximately 30 dB, and in which no clusters were recorded with CF above ~4 kHz. As noted above, the ABER threshold elevation in this starling was also greater than that of other animals in the group. The horizontal linear fit to the threshold data for SLLR 97-6 reflects the fact that in this animal thresholds at all but three points were in the range 36–49 dB SPL, with no systematic dependence on CF.
The mean threshold data for the three groups are summarized in Table 2. In the ≤ 2 kHz frequency range, the mean thresholds for the three groups are very similar, and there were no significant differences between the groups. In the 2.1–4.2 kHz frequency range, to which SLSR responses were restricted, the mean SLSR threshold was significantly elevated relative to that for the normal (SN) group. The mean SLLR threshold was intermediate between those of the SN and SLSR groups and significantly different from both of them. In the frequency range 4.2–6 kHz, in which there were no CFs in the SLLR group (i.e., if there were neurons with CF at these frequencies their thresholds exceeded the maximum available SPL of ~100 dB), mean threshold in the SLLR group was also significantly elevated relative to that in normals. These two sets of comparisons indicate that at the frequencies above 2 kHz (i.e., those affected by the BP lesions), thresholds in the long-recovery group had recovered significantly, but had not achieved normal levels. The residual threshold elevations in the two high-frequency ranges (viz., mean elevations of 14.5 dB (2.1–4.2 kHz range) and 14 dB (4.2–6 kHz range)) are very similar to those in the mean ABER thresholds in those frequency ranges (viz., 15.6 and 12.5 db, respectively). This correspondence suggests that the residual threshold elevations in FLC neurons simply reflect those in the periphery.
DISCUSSION
This study of the effects of partial BP lesions and of subsequent HC regeneration on the frequency organization of the starling auditory forebrain had two major aims. The first was to determine whether such lesions resulted in a dynamic reorganization of the FLC analogous to that seen in mammalian auditory forebrain after partial cochlear lesions and, if it did, to determine whether those changes were reversed by the restoration of afferent input consequent on HC regeneration. The second aim, regardless of whether or not plastic reorganization occurred, was to determine the extent to which HC regeneration resulted in the restoration of normal tonotopicity and thresholds in the forebrain. The implications of the results with respect to these two aims are discussed below.
Nature of Reorganization of Forebrain Tonotopy
Lesions restricted to the basal (high-frequency) portion of the BP resulted in profound changes in the frequency organization of the FLC. The general form of this reorganization was that the regions of the FLC that contain neurons tuned to the high frequencies in this species’ hearing range (viz., 3.5–6 kHz) now had CFs in the 2–4 kHz range. As a consequence, the slopes of frequency – distance functions in the frequency range > 2 kHz were significantly less steep in the SLSR group than in normal starlings (Figs. 10A and B; Table 1). The effect of the lesion on BF – depth functions was almost identical to that on CF – depth functions, indicating that this effect was independent of sound pressure level. This change in tonotopic organization is qualitatively similar to that observed in mammalian primary auditory cortex following lesions restricted to the basal high-frequency end of the cochlea, where neurons in the area deprived of its normal high frequency input by the lesion are tuned to lower frequencies represented at the edge of the cochlear lesion (see Irvine (2005) for review).
As noted above, a change in frequency organization of this sort can occur either as a passive consequence of the peripheral lesion or as a manifestation of central nervous system plasticity. Information on the thresholds of neurons in the region of altered frequency selectivity has been used to distinguish between these alternatives. As discussed in detail by Rajan et al. (1993), if the change in frequency organization is a passive consequence of the lesion (i.e., if it simply reflects the residue of pre-lesion responses), thresholds will increase progressively across the region in which CFs are constant or near-constant. As shown in Fig. 7C, the thresholds of neuronal clusters in the area of changed frequency organization in the FLC of starlings in the SLSR group (i.e., 2 days after a series of aminoglycoside injections) increased systematically across the area of changed organization. The mean threshold in the 2.1–4.0 kHz range was significantly elevated (by more than 30 dB; Table 2), and no clusters with CF above this range could be recorded. These threshold data indicate that the changes in FLC frequency organization observed in these starlings is explicable as a passive consequence of the peripheral lesion.
It should be emphasized that the failure to find evidence of plasticity in the FLC under the conditions of this study does not mean that plasticity might not occur as a consequence of peripheral damage under different conditions (e.g., with more steeply sloping losses or longer periods of hearing loss) or as a consequence of other manipulations of auditory experience that have been reported to produce plasticity in mammalian cortex (see Irvine and Wright (2005) for review).
Effects of Hair Cell Regeneration on Forebrain Tonotopicity and Thresholds
The second aim of the study was to determine the extent to which HC regeneration resulted in the restoration of normal tonotopicity and thresholds in the FLC. The CF – depth and BF – depth plots in the > 2 kHz range for the long-recovery (SLLR) starlings had slopes slightly shallower than, but not significantly different from, those for the normal (SN) starlings (Figs. 10A and B and Table 1), indicating that tonotopicity had recovered completely. However, the threshold data showed only a partial return to normal levels, with mean thresholds in the long-recovery group being significantly lower than those in the short-recovery group, but significantly higher than those in normals (Table 2).
It should be noted that the recovery of tonotopicity and partial recovery of thresholds observed in this study cannot unequivocally be attributed to HC regeneration. The recovery data were obtained at a single time point after cessation of ototoxic injections, and although HC regeneration also occurred during this period, the relationship between the two changes remains correlational. Nevertheless, the similarity between the electrophysiological data reported here and behavioural data from starlings with similar BP lesions obtained at multiple time points during recovery (Marean et al., 1993) is compelling. They found that recovery of detection thresholds for pure tones began soon after the cessation of ototoxic injections and continued for approximately 50 days. This behavioral study also showed that the degree of permanent threshold shift increased with increasing frequency above 3 kHz, a finding in good agreement with our data.
There do not appear to have been any previous studies that bear directly on the effects of HC loss and regeneration on central auditory system tonotopy. Cohen and Saunders (1994) reported that tonotopy in the nucleus magnocellularis (NM; homologue of the mammalian anteroventral cochlear nucleus) returned to normal 12 days after sound trauma in 1-day-old chickens, but it is likely that the recovery in this case reflected the rapid regeneration of supporting structures (tectorial membrane and tegmentum vasculosum) that is seen after mild noise-trauma damage. Park et al. (1999) used 2-Deoxyglucose labeling to measure activity evoked in the NM by a broadband signal (recorded music) at various intervals after gentamicin poisoning in 11-day-old chicks. Damage to HCs in the basal region of the BP was associated with reduced labeling in the rostral, high-frequency region of the nucleus, a result in agreement with our finding of massively elevated thresholds at new CFs in the high-frequency region of the FLC of the short-recovery starlings. They also reported that HC regeneration was associated with a return to normal levels of labeling in that region of the nucleus, whereas we found that although tonotopy was restored in the high-frequency region of the FLC in the long-recovery starlings, thresholds remained elevated relative to normal. Park et al.’s use of a broad-band acoustic stimulus to evoke activity in the NM means that although the recovery they observed was in the cochleotopically appropriate region of the nucleus, their data do not bear on the recovery of tonotopic organization within that region. Moreover, their stimulus was presented at a single moderate SPL, and the 2-Deoxyglucose technique is highly nonlinear. It is therefore unlikely that they would have detected a residual threshold elevation of the type we observed.
Although the normal tonotopy in the long-recovery starlings indicates that the regenerated hair calls in the basal papilla are functional, the elevated thresholds in the high-frequency region indicates that they are not functioning normally. A residual hearing loss that becomes progressively greater with increasing frequency is a ubiquitous finding in studies of functional recovery following HC regeneration after ototoxic damage (Tucci and Rubel, 1989; Smolders, 1999; Bermingham-McDonogh and Rubel, 2003). The results presented above make it tempting to attribute the residual high frequency deficit seen in the long-recovery starlings to the abnormal pattern of stereocilia bundle alignment apparent in our observations and those of many previous authors (e.g., Duckert and Rubel, 1993, Janas et al., 1995; Komeda and Raphael, 1996). On the other hand, a number of factors could be responsible in addition to or instead of bundle orientation. In this respect, it should be kept in mind that threshold is determined by the sensitivity of the most sensitive elements in the system, not the average sensitivity. Hence, with a few hair cells working at maximum efficiency, one might expect thresholds to return to normal. Some other attributes to consider are the pattern of the afferent and efferent innervation of the tall HCs, the possibility of ganglion cell degeneration, and changes in the tegmentum vasculosum (Ryals et al., 1989, 1995). On the other hand, none of these factors, nor the stereocilia misalignment, explain why the degree of threshold shift seen peripherally, centrally and behaviorally is progressively greater with progressively higher frequencies. One hypothesis that would account for this result is that it reflects incomplete recovery of the specialized channel properties of high frequency hair cells that normally populate the proximal portion of the avian BP and that vary systematically with CF (Pantelias et al, 2001; Bermingham-McDonogh and Rubel, 2003).
The recovery of normal tonotopicity in the FLC after a period of deafness and subsequent HC regeneration indicates considerable stability of the topography of neuronal connections in the avian auditory system. Furthermore, the fact that the residual increase in FLC neuron thresholds appears to reflect the peripheral threshold changes indicates that deafness and HC regeneration did not result in major changes in forebrain neuron response characteristics.
Acknowledgments
This research was supported by National Institutes of Health Grants DC02854, DC03829 and DC04661 and a National Health and Medical Research Council of Australia Project Grant. DRFI was supported by a Senior Sabbatical Scientist Award from the Virginia Merrill Bloedel Hearing Research Center of the University of Washington, and is grateful to Bill Lippe and Cam Marean for introducing him to the delights of avian research. The invaluable technical support of John Burt, Dale Cunningham, Graeme Farrington, Elana Hartley, Valerie Park and Brandon Warren, and the helpful comments of two reviewers on an earlier version of the manuscript, are also gratefully acknowledged.
References
- Bermingham-McDonogh O, Rubel EW. Hair cell regeneration: winging our way towards a sound future. Curr Opin Neurobiol. 2003;13:119–126. doi: 10.1016/s0959-4388(03)00018-7. [DOI] [PubMed] [Google Scholar]
- Capsius B, Leppelsack HJ. Influence of urethane anesthesia on neural processing in the auditory cortex analogue of a songbird. Hear Res. 1996;96:59–70. doi: 10.1016/0378-5955(96)00038-x. [DOI] [PubMed] [Google Scholar]
- Cohen YE, Saunders JC. The effect of acoustic overexposure on the tonotopic organization of the nucleus magnocellularis. Hear Res. 1994;81:11–21. doi: 10.1016/0378-5955(94)90148-1. [DOI] [PubMed] [Google Scholar]
- Cotanche DA. Structural recovery from sound and aminoglycoside damage in the avian cochlea. Audiol Neurootol. 1999;4:271–285. doi: 10.1159/000013852. [DOI] [PubMed] [Google Scholar]
- Cotanche DA, Corwin JT. Stereociliary bundles reorient during hair cell development and regeneration in the chick cochlea. Hear Res. 1991;52:379–402. doi: 10.1016/0378-5955(91)90027-7. [DOI] [PubMed] [Google Scholar]
- Duckert LG, Rubel EW. Ultrastructural observations on regenerating hair cells in the chick basilar papilla. Hear Res. 1990;48:161–82. doi: 10.1016/0378-5955(90)90206-5. [DOI] [PubMed] [Google Scholar]
- Duckert LG, Rubel EW. Morphological correlates of functional recovery in the chicken inner ear after gentamycin treatment. J Comp Neurol. 1993;331:75–96. doi: 10.1002/cne.903310105. [DOI] [PubMed] [Google Scholar]
- Heil P, Rajan R, Irvine DRF. Sensitivity of neurons in cat primary auditory cortex to tones and frequency-modulated stimuli. I. Effects of variation of stimulus parameters. Hear Res. 1992;63:108–134. doi: 10.1016/0378-5955(92)90080-7. [DOI] [PubMed] [Google Scholar]
- Irvine DRF, Brown M, Rubel EW. Effects of restricted basilar papillar lesions on the frequency organization of the auditory forebrain in adult starlings. Proc Aust Neurosci Soc. 2000;11:77. doi: 10.1523/JNEUROSCI.5513-08.2009. [DOI] [PMC free article] [PubMed] [Google Scholar]
- Irvine DRF, Rajan R, Smith S. Effects of restricted cochlear lesions in adult cats on the frequency organization of the inferior colliculus. J Comp Neurol. 2003;467:354–374. doi: 10.1002/cne.10921. [DOI] [PubMed] [Google Scholar]
- Irvine DRF, Wright BA. Plasticity in spectral processing. In: Malmierca M, Irvine DRF, editors. Auditory spectral processing. San Diego: Elsevier Academic; 2005. pp. 435–472. [Google Scholar]
- Janas JD, Cotanche DA, Rubel EW. Avian cochlear hair cell regeneration: stereological analyses of damage and recovery from a single high dose of gentamicin. Hear Res. 1995;92:17–29. doi: 10.1016/0378-5955(95)00190-5. [DOI] [PubMed] [Google Scholar]
- Kaas JH, Florence SL. Reorganization of sensory and motor systems in adult mammals after injury. In: Kaas JH, editor. The mutable brain. Amsterdam: Harwood Academic Publishers; 2001. pp. 165–242. [Google Scholar]
- Kamke MR, Brown M, Irvine DRF. Plasticity in the tonotopic organization of the medial geniculate body in adult cats following restricted unilateral cochlear lesions. J Comp Neurol. 2003;459:355–367. doi: 10.1002/cne.10586. [DOI] [PubMed] [Google Scholar]
- Komeda M, Raphael Y. Gentamicin distribution in the basilar papilla: possible association with regenerated hair cell orientation. Hear Res. 1996;102:81–9. doi: 10.1016/s0378-5955(96)00150-5. [DOI] [PubMed] [Google Scholar]
- Marean GC, Burt JM, Beecher MD, Rubel EW. Hair cell regeneration in the European starling (Sturnus vulgaris): Recovery of pure-tone detection thresholds. Hear Res. 1993;71:125–136. doi: 10.1016/0378-5955(93)90028-y. [DOI] [PubMed] [Google Scholar]
- Nieder A, Klump GM. Adjustable frequency selectivity of auditory forebrain neurons recorded in a freely moving songbird via radiotelemetry. Hear Res. 1999;127:41–54. doi: 10.1016/s0378-5955(98)00179-8. [DOI] [PubMed] [Google Scholar]
- Niemiec AJ, Raphael Y, Moody DB. Return of auditory function following structural regeneration after acoustic trauma: behavioral measures from quail. Hear Res. 1994;79:1–16. doi: 10.1016/0378-5955(94)90122-8. [DOI] [PubMed] [Google Scholar]
- Pantelias AA, Monsivais P, Rubel EW. Tonotopic map of potassium currents in chick auditory hair cells using an intact basilar papilla. Hear Res. 2001;156:81–94. doi: 10.1016/s0378-5955(01)00269-6. [DOI] [PubMed] [Google Scholar]
- Park DL, Girod DA, Durham D. Tonotopic changes in 2-deoxyglucose activity in chick cochlear nucleus during hair cell loss and regeneration. Hear Res. 1999;138(1–2):45–55. doi: 10.1016/s0378-5955(99)00138-0. [DOI] [PubMed] [Google Scholar]
- Pfeiffer RR. Classification of response patterns of spike discharges for units in the cochlear nucleus: Tone-burst stimulation. Exp Brain Res. 1966;1:220–235. doi: 10.1007/BF00234343. [DOI] [PubMed] [Google Scholar]
- Rajan R, Irvine DRF. Neuronal responses across cortical field A1 in plasticity induced by peripheral auditory organ damage. Audiol Neurootol. 1998a;3:123–144. doi: 10.1159/000013786. [DOI] [PubMed] [Google Scholar]
- Rajan R, Irvine DRF. Absence of plasticity of the frequency map in dorsal cochlear nucleus of adult cats after unilateral partial cochlear lesions. J Comp Neurol. 1998b;399:35–46. [PubMed] [Google Scholar]
- Rajan R, Irvine DRF, Wise LZ, Heil P. Effect of unilateral partial cochlear lesions in adult cats on the representation of lesioned and unlesioned cochleas in primary auditory cortex. J Comp Neurol. 1993;338:17–49. doi: 10.1002/cne.903380104. [DOI] [PubMed] [Google Scholar]
- Robertson D, Irvine DRF. Plasticity of frequency organization in auditory cortex of guinea pigs with partial unilateral deafness. J Comp Neurol. 1989;282:456–471. doi: 10.1002/cne.902820311. [DOI] [PubMed] [Google Scholar]
- Rübsamen R, Dörrscheidt GJ. Tonotopic organization of the auditory forebrain in a songbird, the European starling. J Comp Physiol A: Sensory, Neural and Behavioral Physiology. 1986;158:639–646. doi: 10.1007/BF00615245. [DOI] [PubMed] [Google Scholar]
- Ryals BM, Dooling R. Changes in innervation and auditory sensitivity following acoustic trauma and hair cell regeneration in birds. In: Salvi RJ, Henderson D, Fiorino F, Colletti V, editors. Auditory System plasticity and regeneration. New York: Thieme; 1996. pp. 84–99. [Google Scholar]
- Ryals BM, Stalford MD, Lambert PR, Westbrook EW. Recovery of noise-induced changes in the dark cells of the quail tegmentum vasculosum. Hear Res. 1995;83:51–61. doi: 10.1016/0378-5955(94)00190-2. [DOI] [PubMed] [Google Scholar]
- Ryals BM, Ten Eyck B, Westbrook EW. Ganglion cell loss continues during hair cell regeneration. Hear Res. 1989;43:81–90. doi: 10.1016/0378-5955(89)90061-0. [DOI] [PubMed] [Google Scholar]
- Smolders JWT. Functional recovery in the avian ear after hair cell regeneration. Audiol Neurootol. 1999;4:286–302. doi: 10.1159/000013853. [DOI] [PubMed] [Google Scholar]
- Snyder RL, Sinex DG. Immediate changes in tuning of inferior colliculus neurons following acute lesions of cat spiral ganglion. J Neurophysiol. 2002;87(1):434–452. doi: 10.1152/jn.00937.2000. [DOI] [PubMed] [Google Scholar]
- Sokolich WG, inventor. Closed sound delivery system. 4251686 US. Patent . 1981


