

Abstract
Age trajectories of physiological indices contain important information about aging-related changes in the human organism and therefore may help us understand human longevity. The goal of this study is to investigate whether shapes of such trajectories earlier in life affect the residual life span distribution. We used longitudinal limited access data from seven physiological indices and life spans of respective individuals collected in the Framingham Heart Study (FHS). These include: diastolic blood pressure (DBP), pulse pressure (PP), body mass index (BMI), serum cholesterol (SCH), blood glucose (BG), hematocrit (HC), and pulse rate (PR). We developed a method for assigning individuals to groups of potentially long-lived (PLL) and potentially medium-lived (PML) groups using age trajectories of physiological indices at the age interval between 40 and 60 years. The analysis shows that the longevity of individuals who survived to age of 65 depends on the behavior of the physiological indices between 40 and 60 years of age.
Keywords: age trajectories, aging, exceptional longevity, longitudinal data, physiological indices, the Framingham Heart Study
Abbreviations: BG blood glucose, BMI body mass index, CVD cardiovascular disease, DBP diastolic blood pressure, FHS the Framingham Heart Study, HC hematocrit, LL long-lived, ML medium-lived, PLL potentially long-lived, PML potentially medium-lived, PP pulse pressure, PR pulse rate, SCH serum cholesterol, SL short-lived
Introduction
Genetic and environmental factors influence the risk for incident disease or death. This occurs through various biological and physiological mediators involved in damage repair and compensatory adaptation at different levels of an organism’s biological and physiological organization. This helps explain why age-related mortality rate increases in adults are accompanied by aging-related changes in one’s physiological state and other variables describing the organism’s functioning. However, the patterns of such aging-related changes are poorly understood. Do age trajectories of individual physiological states differ in long-lived (LL) and short-lived (SL) individuals? Are particular features of these trajectories observed in early adulthood predictive of long life? Understanding these questions may provide us with a better understanding of the aging process. In order to address these questions, an analysis of longitudinal data containing regular measurements of the physiological state of numerous individuals has to be performed. Such systematic measurements over a 50-year follow-up period are available in the Framingham Heart Study (FHS) dataset.
Intensive analyses of selected physiological indices and their effects on morbidity and mortality characteristics have been performed in earlier studies using standard statistical tools (Dawber et al. 1951, 1963; Dawber 1980; D’Agostino and Kannel 1989; Coady et al. 2002; Franco et al. 2005; Franklin et al. 2005; Kannel et al. 2003; Singh et al. 1999; Vlagopoulos et al. 2005; Port et al. 2006; Natarajan et al. 2003). Such analyses, however, have a restricted ability to capture dynamic effects. For example, questions about the role of past trajectories on future survival remain unexplored. The interpretation of average age trajectories of such indices must be done with care, because such trajectories do not describe average dynamics of the physiological state. This is because individuals whose physiological state deviated too far from the range of ‘normal’ values have increased chances of death. And those who have died do not participate in the averaging procedure for subsequent age categories.
The effects of such compositional changes can be partly eliminated by considering individuals who survived to a certain age x*. The average age trajectories for such individuals considered prior to age x* characterize the age evolution of an average physiological state without compositional effects. The observed difference between such trajectories conditional on survival to different ages is an important indicator of statistical dependence between life span and physiological age trajectories. In this study, we evaluate the properties of average trajectories of physiological indices and establish their connection to survival characteristics of respective groups of individuals.
Materials and methods
The Framingham Heart Study dataset
The original aim of the Framingham Heart Study (FHS) was to evaluate potential risk factors for cardiovascular disease (CVD – coronary heart disease and stroke) in healthy individuals. In 1948, the study recruited 5,209 non-institutionalized white subjects (2,336 males and 2,873 females) between the ages of 28 and 62 in the town of Framingham, Massachusetts. For more than 50 years, the participants of the original cohort have been reexamined biennially with physical examination, laboratory tests, detailed medical history, and extensive cardiovascular history. There remained 319 males and 673 females alive in the year 2000. Among the risk factors identified in the Framingham study (Greenland et al. 2003) are age, sex, systolic and diastolic blood pressure, serum cholesterol levels, diabetes mellitus, cigarette use, left ventricular hypertrophy, body mass index, and blood glucose. The recruitment, methodology, and study design have been explained more fully in Dawber et al. (1951, 1963), and Dawber (1980).
Methods
For the current study, in order to investigate the dynamics of age trajectories of diastolic blood pressure (DBP), pulse pressure (PP), body mass index (BMI), pulse rate (PR), serum cholesterol level (SCH), blood glucose (BG), and hematocrit (HC), we first evaluated their empirical average trajectories for the entire FHS cohort and compared them for males and females. We calculated average values of respective indices for different age groups. For the entire FHS cohort, we used 5-year age groups, < 35, 35–40, …, 85–90, and 90+. We then evaluated age trajectories for the long-lived (LL) (survived to age 80 for males and age 83 for females) and the group of medium-lived (ML) individuals (i.e., individuals whose age at death was between the ages of 65 and 80 for males and 65 and 83 for females). This allowed us to exclude the effects of changes in population composition at the age interval between 40 and 60, where the average age trajectories are compared in construction of the PLL and PML groups (see below). For the LL and ML groups, we calculated average values of physiological indices for 2-year age groups 40–41, 42–43, …, and 58–59.
Subsequently, we developed a method for constructing groups having the potential to live long (PLL) and having the potential to live medium life spans (PML) using shapes of their age trajectories at the age interval spanning 40 to 60 years. The formal criteria for distinguishing between the PLL and PML individuals are specified in the Results section. Then the survival functions (conditional at age 60) of the respective groups were evaluated and compared for both males and females. Such an analysis has been performed for each of seven physiological indices, and then in the multivariate case by evaluating the distance between age trajectories in seven-dimensional space. To evaluate how close the age trajectories of physiological indices of different individuals are, we employed measures of distance described below in the section Results. Standard statistical criteria have been used to test the difference between survival distributions in the PLL and PML groups. Survival functions were estimated using the nonparametric ‘product limit estimator’ (Kaplan and Meier 1958) modified for the case of left truncated data (see Tsai et al. 1987; Tsai 1988).
Results
Our analysis shows that the connection between age patterns of physiological indices and life span is not deterministic, and is affected by many unmeasured stochastic factors. Taking average trajectories of such indices instead of individual ones reduces the effects of random factors acting additively and allows for evaluation of population effects. This is why we first decided to calculate average age trajectories of seven physiological indices for males and females. The results are shown in Figure 1. The total number of individuals and observations of the seven indices in the FHS can be found in Table 1.
Figure 1.
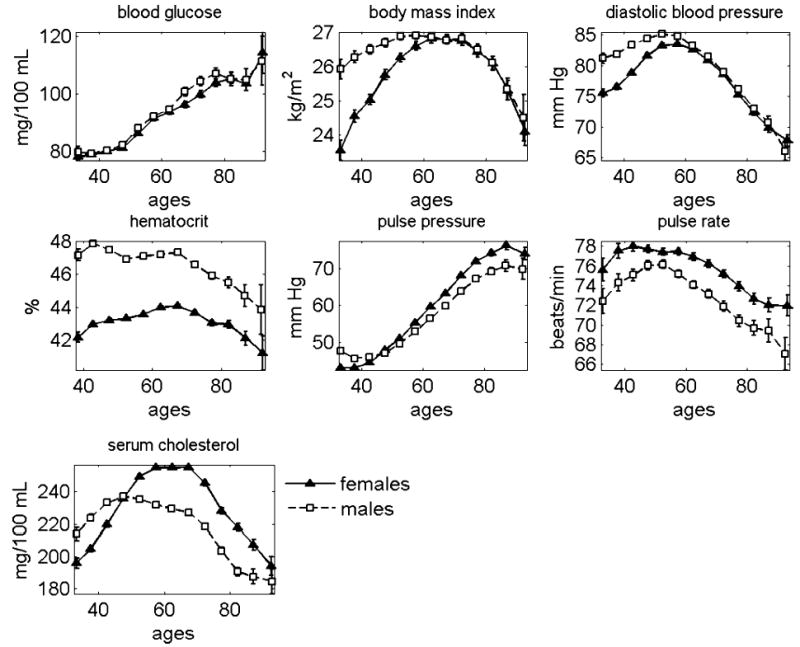
Average age trajectories of seven physiological indices constructed for males and females using data from the Framingham Heart Study
Table 1.
Total number of individuals (N) and observations of seven indices at the age interval spanning 40 to 60 years in the LL and ML groups (the FHS data, first sub-cohort) and in the total FHS sample.
| Population | N | BG | BMI | DBP | HC | PP | PR | SCH |
|---|---|---|---|---|---|---|---|---|
| Females | ||||||||
| ML | 516 | 2,008 | 2,949 | 2,953 | 1,749 | 2,953 | 2,326 | 2,498 |
| LL | 653 | 2,671 | 3,947 | 3,950 | 2,312 | 3,950 | 3,066 | 3,356 |
| Total (FHS) | 2,873 | 30,910 | 40,999 | 41,911 | 27,319 | 41,911 | 36,766 | 29,975 |
| Males | ||||||||
| ML | 441 | 1,827 | 2,555 | 2,558 | 1,648 | 2,558 | 2,051 | 2,258 |
| LL | 477 | 2,213 | 3,180 | 3,182 | 2,149 | 3,182 | 2,594 | 2,786 |
| Total (FHS) | 2,336 | 23,277 | 30,151 | 30,469 | 20,655 | 30,469 | 26,371 | 23,277 |
As seen in Figure 1, all age patterns for physiological indices are non-monotonic functions of age other than blood glucose (BG), which increases with age for both sexes, and hematocrit (HC) for males, which tends to stay constant until age 70 years and then decline with age. In particular, for both sexes, body mass index (BMI) increases with age up to age 60, stays relatively constant between the ages of 50 and 70 years for males and between the ages 60 and 70 years for females, and then declines for both sexes. Diastolic blood pressure (DBP) increases until about age 55 years and then after age 60 years, declines for both sexes. The level of hematocrit (HC) for males is approximately 47% until age 70 and then declines. For females, it increases until age 70 and then declines. For both sexes, the pulse pressure (PP) increases after age 40, reaches its peak at approximately 90 years of age, and then shows a tendency to decline. The pulse rate (PR) for males reaches its maximum around age 55 and then declines. For females, the average PR shows a slight tendency to decline between the ages of 45 and 60. After age 60, it declines at a faster rate. In females, the level of serum cholesterol (SCH) first increases, then reaches its maximum around age 60, stays at this level until age 70 years, and then declines. For males, a gradual rise in the SCH ceases near age 50 years, and then SCH declines slowly until age 70 years. After age 70 years, the decline accelerates.
Age trajectories of physiological indices for males and females appear different
Figure 1 also shows that the average age trajectories of physiological indices (except blood glucose) differ for males and females. Statistical analysis confirms the significance of this observation. In particular, after age 35, the female BMI increases faster than that of males. Both indices reach the same maximum value around age 60, and then show a similar pattern of decline after age 70. Diastolic blood pressure is higher among males but increases more slowly. The maximum value reached near ages 55–60 is about the same for both sexes, with a similar rate of decline afterwards. The average level of hematocrit is higher in males than in females during the entire life course. However, the rate of decline of both these indices after an age of 70 is approximately equal. Average female pulse pressure tends to increase faster than that of males. Average female pulse rate always appears higher than that of males. Between the ages of 35 and 50 years, the level of serum cholesterol is higher in males than in females. After an age of 50 years, the male SCH index becomes lower and remains lower than for females for the rest of the interval of aging.
Mortality rates for males and females in the FHS cohort are also different
Figure 2 shows age patterns of survival functions for male and female participants of the FHS cohort.
Figure 2.
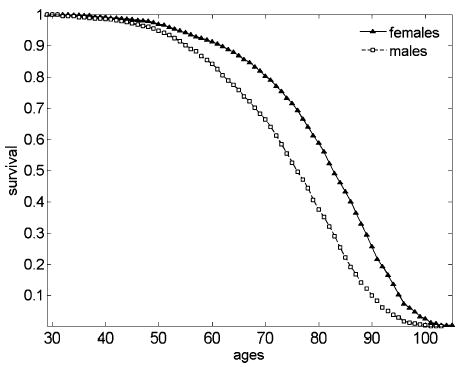
Empirical survival functions for male and female participants of the FHS cohort
The fact that male and female life-span distributions are also different suggests that differences in the shape of male and female age trajectories might have something to do with the difference in male and female survival distributions (in calculations of survival characteristics, we assumed that all individuals from the FHS cohort experienced the same age pattern for risk of survival). If this assumption is correct, one can expect to observe differences in average age trajectories of respective indices calculated for groups of individuals of the same gender who have distinct life spans. For example, for the long-lived group (LL, defined as those who survived to age 80 for males and 83 for females) and the short-lived group (SL, defined as those who did not survive to age 65 for both genders) the statistical analysis showed that respective trajectories are substantially different between the ages of 40 and 65 years.
However, comparison of such trajectories presents methodological problems since the trajectories of SL individuals contain effects of compositional changes (i.e., deaths) and those of the LL individuals do not. To exclude the influence of changes in population composition on average age trajectories of respective indices, we introduced a group referred to as medium survivors (ML or ‘medium-lived’). By definition, the ML group includes individuals who survived to age 65 for both genders and died before age 80 for males and before age 83 for females. Such a division allows us to compare average age trajectories of physiological indices for the ML and LL individuals at the age interval that spans 40 to 60 years of age. This helps compensate for compositional changes due to mortality selection, and for changes in physiological indices due to acceleration of disease several years before death, such that they do not affect respective trajectories at the selected age interval. Unfortunately, one still cannot compare survival distributions for the ML and LL individuals, because, by definition, individuals from these groups die at non-intersecting age intervals. To make a comparison of survival distributions for selected sub-groups of individuals possible, we have to modify the definitions of the respective groups.
The need for the groups of PLL and PML individuals
Ideally, instead of the LL and ML individuals, it would be desirable to modify the criteria that allow for assigning individuals to groups of potential long survivors (PLL) and potential medium-lived survivors (PML) using individual age trajectories of physiological indices considered at certain age intervals. Some of the PLL individuals may die prematurely, probably because of extreme external (i.e., environmental) or inadequate internal (e.g., disease) conditions, and, conversely, some PML individuals may live a long life because of favorable conditions. It would be natural to expect that individual age trajectories of physiological indices of the PLL and PML individuals will be close to those of the LL and ML individuals. However, the selection rule must be independent of survival conditions for individuals having these trajectories. This condition would be met if one modified the criteria for assignment of individuals to the PLL and PML groups using one data set, implemented these criteria to an independent data set, and then compared survival functions in the two groups. A significant difference in survival functions would indicate that the respective age trajectories of physiological indices are important correlates of longevity. The existence of such groups would support the importance of age patterns of physiological trajectories for longevity, and would allow for comparison of respective survival distributions.
The construction of the PLL and PML groups of individuals
Following this line of thought, we randomly divided the entire FHS cohort into two equal-sized sub-cohorts, by gender. The first sub-cohort has been used for elaboration of the criteria for selecting the PLL and PML groups using individuals from the second sub-cohort. For this purpose, we identified the LL and ML sub-groups of individuals in the first sub-cohort, and evaluated average age trajectories of physiological indices at the age interval spanning 40 to 60 years. The results are shown in Figures 3 and 4 for females and males, respectively. The total number of individuals and observations of seven indices at the age interval spanning 40 to 60 years for the LL and ML females and males can be found in Table 1.
Figure 3.
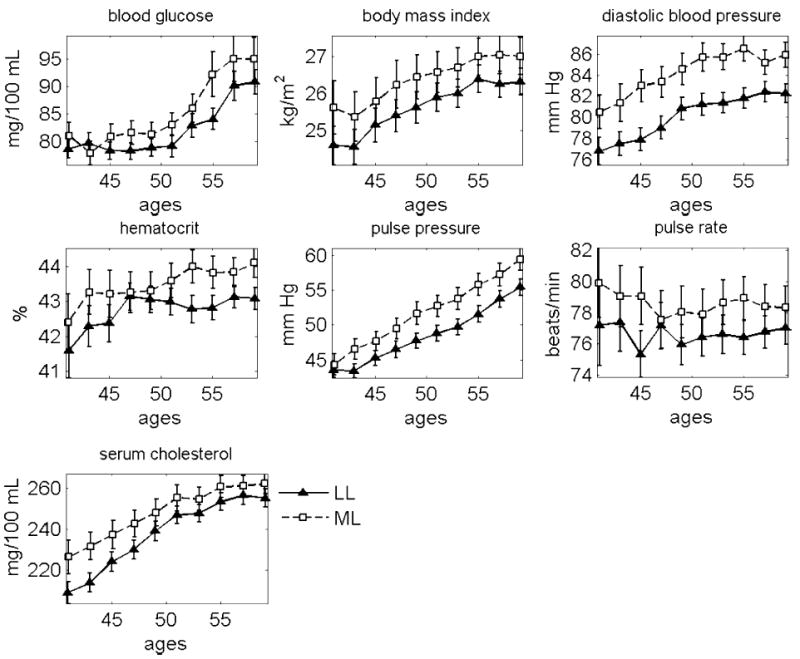
Mean age trajectories of seven physiological indices in the LL and ML females. The FHS data, first sub-cohort
Figure 4.
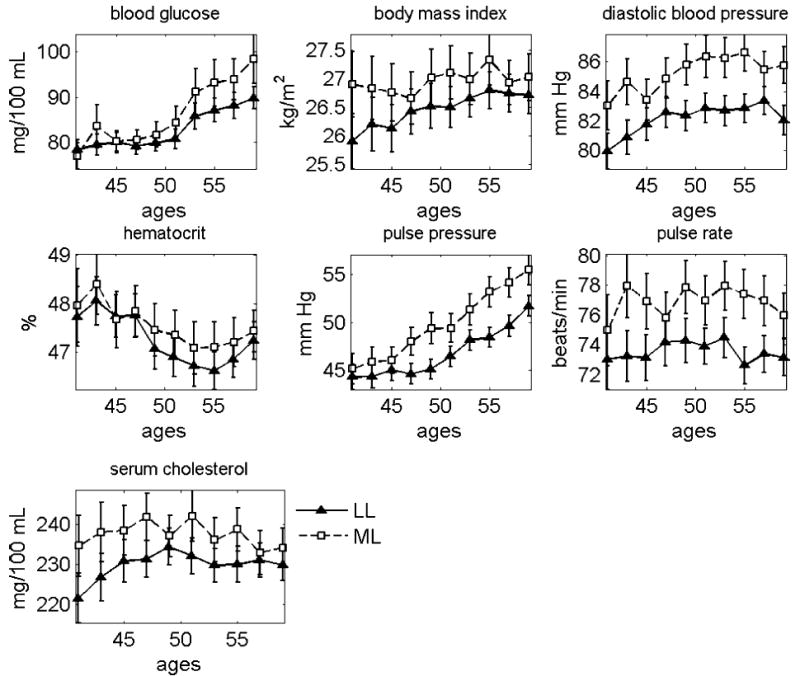
Mean age trajectories of seven physiological indices in the LL and ML males. The FHS data, first sub-cohort
Average values of physiological indices for the LL and ML females from the first sub-cohort are significantly different for the following age groups: 50–51 and 54–55 (p<0.01), 46–47 (p=0.013), 44–45, 48–49, 52–53, 56–57, and 58–59 (0.05<p<0.1) for BG; 40–41, 46–47, …, 52–53, 56–57, and 58–59 (0.01<p<0.05), 42–43 and 54–55 (0.05<p<0.1) for BMI; all age groups (p<0.01) for DBP; 52–53, …, 58–59 (p<0.01), 42–43 (p=0.029), 44–45 and 50–51 (0.05<p<0.1) for HC; 42–43, …, 58–59 (p<0.01) for PP; 44–45 and 54–55 (p<0.01), 52–53 (p=0.034), 48–49 and 56–57 (0.05<p<0.1) for PR; 40–41, …, 46–47 (p<0.01), 48–49, …, 54–55 and 58–59 (0.01<p<0.05) for SCH. Average values of physiological indices for the LL and ML males from the first sub-cohort are significantly different for the following age groups: 58–59 (p=0.005), 54–55 and 56–57 (0.01<p<0.05), 50–51 and 52–53 (0.05<p<0.1) for BG; 40–41 (p=0.009), 50–51 (p=0.041), 42–43, 44–45, and 54–55 (0.05<p<0.1) for BMI; 40–41, 42–43, 46–47, …, 58–59 (p<0.01), 44–45 (p=0.065) for DBP; 46–47, …, 58–59 (p<0.01) for PP; 42–43, 44–45, 48–49, …, 58–59 (p<0.01) for PR; 40–41, 46–47 (p<0.01), 42–43, 50–51, and 54–55 (0.01<p<0.05), 44–45 and 53–54 (0.05<p<0.1) for SCH.
We use evaluated age trajectories as ‘standards’ for dividing the second (non-analyzed) FHS sub-cohort into the potentially long-lived (PLL) and potentially medium-lived (PML) individuals. The second sub-cohort has been used to implement the modified criteria and construct the PLL and PML groups of individuals. For this purpose, we developed a procedure assigning each individual from the second FHS sub-cohort either to the group of potential medium-livers (PML) or potential long-livers (PLL).
Specifically, each individual was supplied with two numbers. One is the number of measurements at the age interval between 40 and 60 years in which the individual’s trajectory was closer to the ‘PLL standard’ (i.e., the average trajectory for the LL individuals, evaluated in the first sub-cohort) than to the ‘PML standard’ (i.e., the average trajectory for the ML individuals, evaluated in the first sub-cohort). The other is the number of measurements at the same age interval in which the individual’s trajectory was closer to the respective trajectory of the ML individuals. If the first number was larger than the second, the respective individual was assigned to the PLL group. Otherwise s/he was assigned to the PML group. All trajectories were considered at the age interval spanning 40 to 60 years (if an individual had no observations for the respective index at this age interval then s/he was excluded from this analysis).
Formally, let and be average values of an index for age groups t for ML and LL individuals in the first sub-cohort (i.e., those shown in Figures 3 and 4), be average values of the index for age groups t observed for ith individual from the second sub-cohort (note that most individuals have only one observation in each age group because intervals between the FHS exams are about 2 years), and be the number of such age groups (i.e., 2-year age groups as described above) for which at least one observation of the index for ith individual is available. Then the ‘distance’ di for ith individual from the second sub-cohort is calculated as
where I(.) is the indicator function, i.e., it equals 1 if and 0 otherwise. If then ith individual is assigned to the PML group, otherwise it is assigned to the PLL group.
The total number of individuals and observations of seven indices at the age interval spanning 40 to 60 years for the PLL and PML females and males can be found in Table 2.
Table 2.
Total number of individuals (N) and observations of seven indices (Obs.) at the age interval spanning 40 to 60 years in the PLL and PML groups (the FHS data, second sub-cohort).
| BG
|
BMI
|
DBP
|
HC
|
PP
|
PR
|
SCH
|
|||||||||
|---|---|---|---|---|---|---|---|---|---|---|---|---|---|---|---|
| Sex | Population | N | Obs. | N | Obs. | N | Obs. | N | Obs. | N | Obs. | N | Obs. | N | Obs. |
| Females | PML | 553 | 2,488 | 634 | 3,860 | 687 | 4,009 | 664 | 3,407 | 616 | 3,538 | 666 | 3,509 | 622 | 3,401 |
| Females | PLL | 795 | 3,613 | 744 | 5,107 | 691 | 4,970 | 432 | 2,269 | 762 | 5,441 | 707 | 3,761 | 720 | 4,230 |
| Males | PML | 434 | 2,030 | 556 | 3,697 | 579 | 3,489 | 421 | 2,175 | 560 | 3,297 | 520 | 2,652 | 553 | 3,135 |
| Males | PLL | 661 | 2,841 | 558 | 3,221 | 535 | 3,440 | 429 | 2,326 | 554 | 3,632 | 590 | 2,952 | 534 | 2,963 |
Derivatives
We also investigated whether the values characterizing the rate of age-related changes in indices might affect survival distributions. For these purposes, we calculated individual trajectories of first derivatives of the respective indices, calculated by dividing increments in the selected index at the respective age interval over the length of this interval. Following the procedure described above, we evaluated average age trajectories of respective indices for the LL and ML groups. The fact that the results did not show a substantial difference in the respective trajectories indicates that the rate of changes in physiological indices at the age interval spanning 40 to 60 years of age does not affect survival of these individuals after age 65 (data not shown).
Survival functions
Figure 5 shows survival functions for females and males corresponding to the PLL and PML groups of individuals constructed using age trajectories for all seven indices.
Figure 5.
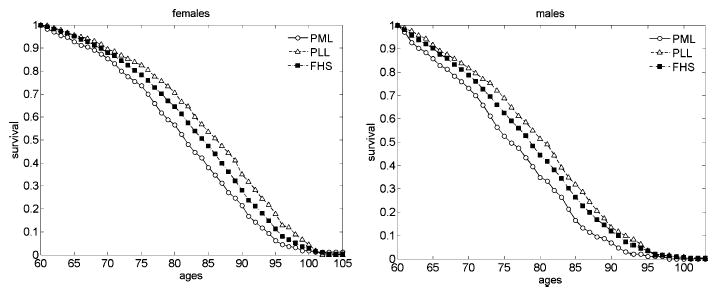
Survival functions (conditional at age 60) for the PPL and PML females and males constructed using all seven indices. The FHS data, second sub-cohort. Survival functions for the total FHS sample are shown for comparison
One can see that the combined analysis of trajectories of all seven indices produces a substantial difference in survival of the PLL and PML groups. The difference between the survival functions of the PLL and PML groups is statistically significant for both females and males (p<0.0001, log-rank test).
Cox’s regression
The results of the analyses performed above suggest that the age trajectories of the physiological state at the interval spanning 40 to 60 years of age may affect individual survival status after age 65. Survival is especially sensitive to the values of DBP, PR, and PP (and the values of all seven indices combined). In order to further test this hypothesis, we used the Cox proportional hazard model (Cox 1972). In this model, we used the calculated distances for individuals in the second sub-cohort as observed covariates. We divided the respective counts by the total number of observations, so that the resulting distances are normalized between 0 (the closest trajectory to the long-lived individuals in the first sub-cohort) and 1 (the closest trajectory to the medium-lived individuals in the first sub-cohort).
The results are summarized in Tables 3 and 4. Here μ0 and β1 stand for the parameters of Gompertz mortality and β2 is the parameter for the respective distance in the Cox regression model: μi(t, di) = μ0eβ1t+β2di, where t is age, di is the distance for i-th individual in the second sub-cohort calculated as described above and μi(t, di) is mortality rate at age t for this individual.
Table 3.
Cox regression model with distance applied to the FHS data on different indices in the second sub-cohort (females).
| Parametersa |
|||||
|---|---|---|---|---|---|
| Index | μ0 · 106 | β1 | β2 | ln Lb | p-valuesc |
| BG | 3.624 (1.691) | 0.112 (0.006) | 0.206 (0.163) | −1992.18 | <0.0001 |
| BMI | 4.062 (1.831) | 0.111 (0.006) | 0.214 (0.106) | −2030.89 | <0.0001 |
| DBP | 3.508 (1.582) | 0.111 (0.005) | 0.471 (0.121) | −2025.38 | <0.0001 |
| HC | 2.363 (1.323) | 0.116 (0.007) | 0.356 (0.147) | −1535.33 | <0.0001 |
| PP | 3.187 (1.444) | 0.112 (0.006) | 0.597 (0.123) | −2021.48 | <0.0001 |
| PR | 4.122 (1.870) | 0.111 (0.006) | 0.110 (0.123) | −2032.54 | <0.0001 |
| SCH | 3.929 (1.802) | 0.112 (0.006) | 0.066 (0.124) | −1971.36 | <0.0001 |
| All seven indices | 2.460 (1.139) | 0.112 (0.006) | 1.152 (0.236) | −2021.14 | <0.0001 |
Standard errors in parentheses
ln L – logarithm of the likelihood function
p-values – p-values (likelihood ratio test) for the null hypothesis β2=0
Table 4.
Cox regression model with distance applied to the FHS data on different indices in the second sub-cohort (males).
| Parametersa |
|||||
|---|---|---|---|---|---|
| Index | μ0 · 105 | β1 | β2 | ln Lb | p-valuesc |
| BG | 2.756 (1.409) | 0.096 (0.007) | 0.117 (0.164) | −1725.92 | <0.0001 |
| BMI | 2.689 (1.352) | 0.096 (0.006) | 0.148 (0.111) | −1750.62 | <0.0001 |
| DBP | 1.679 (0.868) | 0.099 (0.007) | 0.603 (0.128) | −1740.45 | <0.0001 |
| HC | 1.975 (1.183) | 0.098 (0.008) | 0.446 (0.161) | −1343.77 | <0.0001 |
| PP | 1.355 (0.703) | 0.101 (0.007) | 0.789 (0.133) | −1734.14 | <0.0001 |
| PR | 2.286 (1.165) | 0.097 (0.006) | 0.348 (0.129) | −1747.93 | <0.0001 |
| SCH | 3.016 (1.518) | 0.096 (0.007) | −0.105 (0.122) | −1715.00 | <0.0001 |
| All seven indices | 1.148 (0.616) | 0.100 (0.007) | 1.329 (0.258) | −1738.41 | <0.0001 |
Standard errors in parentheses
ln L – logarithm of the likelihood function
p-values – p-values (likelihood ratio test) for the null hypothesis β2=0
The tables show that the deviations of trajectories of indices at ages 40–60 from those of the long-lived individuals in the first sub-cohort increase risk of death for all observed indices. The most significant increase is observed for the DBP, PP, PR and for all seven indices combined (p<0.01), which is in line with empirical observations. The distance calculated using all seven indices gives the largest increase. A ‘standard’ individual in the second population; i.e., an individual with average deviations from the trajectories of the respective indices in the long-lived individuals from the first sub-cohort, has an approximate two-fold increase in the relative risk of death compared with his/her age peer who has trajectories of indices resembling those in the long-lived individuals from the first sub-cohort (that is, individuals with zero distance).
Discussion
In this study, we found that the behavior of physiological age trajectories at the age interval spanning 40 to 60 years affects late-age survival of respective individuals. This finding, however, does not indicate the etiology of the differences in physiological trajectories. Possibilities for this include genetic differences in the rate and pattern of senescent processes or differences in individual stress loads that produce allostatic changes in one’s physiological state. This is difficult to ascertain since the longitudinal data do not contain systematic measurements of individual stress load. However, the importance of such information for better understanding of the aging process and concomitant changes in health and well-being is now well recognized.
The shape of average age trajectories of physiological indices (Figure 1) cannot be considered a result of pure physiological age-related changes in the human organism. An important component contributing to this shape is related to changes in population composition due to the premature death of individuals whose physiological state deviated ‘too far’ from the ‘normal’ range corresponding to minimal mortality. Such selection effects can be evaluated using extensions of heterogeneity or frailty models to the cases where the frailty can change stochastically over time (Yashin and Manton 1997). However, the physiological age-related changes for the LL individuals can be estimated empirically (Figures 3 and 4) at the intervals before age 80 (83) for males (females), since by definition the selection component did not make its contribution before these ages. Thus, the average age trajectories for the LL individuals shown in Figures 3 and 4 are an important source of information about physiological changes accompanying long life.
The physiological state at a given age characterizes an organism’s functioning in existing internal and external conditions. An ongoing source of internal disturbance in the adult organism is the process of senescence. Researchers have not come to an agreement concerning its primary causes. However, evidence is accumulating that thermodynamic forces, oxidative stress, and other destructive factors acting on an organism’s organization at the molecular and biological level make a substantial contribution to this process. The primary effects of aging are only partly compensated for by the processes of homeostatic and compensatory adaptation. Senescence develops and eventually kills the organism even in ideal external conditions. The remarkable fact that senescence can progress without development of major chronic diseases (i.e., ‘healthy’ aging) indicates that: (i) this process is likely to affect all systems, organs, and tissues of a living organism; and (ii) there are evolutionarily developed mechanisms that coordinate the process of compensatory adaptation at different levels of an organism’s biological organization.
Inadequate external conditions (e.g., modifiable risk factors for CVD or other diseases) may contribute to the rate of an organism’s decay, resulting in premature aging and death. Functioning in such conditions is possible but it has a price: chronic diseases, functional impairments, disability, and other aging-related health disorders as well as death may develop earlier than in the case of an ‘ideal’ environment. Such conditions are often associated with permanently acting stress. Although stressful factors may act at physiological or other levels of an organism’s organization, they activate processes at all other levels. Thus, age-related changes in physiological state are the results of a complicated dynamic interplay between senescence, external stressors and the processes of biological and physiological adaptation.
The key finding in this study is that age-related changes in about half of these characteristics are non-monotonic. In other words, each index increases until a certain age and then declines. Different indices begin declining at different ages. The decline in average values of diastolic blood pressure starts after age 60 for both sexes. This decline may indicate the exhaustion of resources in the heart muscle pumping blood to the vessels or some other compensatory mechanism. The decline in BMI begins earlier in males (around 65) than in females (around age 75). It is well known that an individual’s height also declines with age. This means that an individual’s weight declines even more rapidly. This decline may be caused, in part, by the loss of muscle cells due to apoptosis, and due to reduction of muscle mass. A rapid decline in pulse rate begins at age 70 in both sexes. Again, such a decline may be caused, in part, by exhaustion of the resources of the cardiac musculature. The non-monotonic changes in age trajectories of some physiological indices indicate that the values of these indices cannot be used as a measure of individual aging. Indeed, 50-year-old and 80-year-old individuals may have the same BMI value. This situation emphasizes the need for a search for additional dimensions of individual aging. Such an additional manifestation of aging could be the decline in individual stress resistance and the reduction of individual homeostatic capacity. To specify and evaluate these characteristics, one needs to develop better models of human mortality and aging.
In summary, our findings are in a good agreement with previous studies by Terry et al. (2005) who examined the effect of midlife cardiovascular risk factors (similar to those used in this study) on survival to the age of 85 using the FHS dataset. The authors demonstrated that the values of risk factors measured at ages 40 to 50 are capable of predicting survival to an age of 85 using the stepwise logistic regression model. This method uses means of all observations at ages 40 to 50 to evaluate the effect of the respective risk factors on survival to age 85. In our paper, we also demonstrate such mid-life predictive capacity. However, we show that the age trajectories of measurements of risk factors at ages 40 to 60 years can predict survival at older ages. That is, we investigated the age trajectories of risk factors measured in midlife calculating deviations from the ‘optimal’ trajectories in a reference population. This allows for taking into account the dynamic effects of the trajectories on survival and provides addition predictive ability above and beyond static mid-life measures. More study of age trajectories and their dynamic effects may help us better understand the aging process.
Acknowledgments
The Framingham Heart Study (FHS) is conducted and supported by the NHLBI in collaboration with FHS Investigators. This manuscript was prepared using a limited access dataset obtained by the NHLBI and does not necessarily reflect the opinions or views of the FHS or the NHLBI. The work on this project was partly supported by the NIH/NIA grants 1R01 AG028259-01, 1RO1-AG-027019-01 and 5PO1-AG-008761-16.
References
- Coady SA, Jaquish CE, Fabsitz RR, Larson MG, Cupples A, Myers RM. Genetic variability of adult body mass index: a longitudinal assessment in Framingham families. Obes Res. 2002;10:675–681. doi: 10.1038/oby.2002.91. [DOI] [PubMed] [Google Scholar]
- Cox DR. Regression models and life-tables. J R Stat Soc B. 1972;34(2):187–220. [Google Scholar]
- D’Agostino RB, Kannel WB. Epidemiological background and design: the Framingham Study. In: Gail MH, Johnson NJ, editors. Proceedings of the American Statistical Association Sesquicentennial 1988–89. Am Stat Assoc; Alexandria, VA: 1989. pp. 707–718. [Google Scholar]
- Dawber TR. The Framingham Study: the epidemiology of atherosclerotic disease. Harvard University Press; Cambridge, MA: 1980. [Google Scholar]
- Dawber TR, Meadors GF, Moore FE. Epidemiologic approaches to heart disease: the Framingham Study. Am J Public Health. 1951;41:279–286. doi: 10.2105/ajph.41.3.279. [DOI] [PMC free article] [PubMed] [Google Scholar]
- Dawber TR, Kannel WB, Lyell LP. An approach to longitudinal studies in a community: the Framingham Study. Ann N Y Acad Sci. 1963;107:539–556. doi: 10.1111/j.1749-6632.1963.tb13299.x. [DOI] [PubMed] [Google Scholar]
- Franco OH, Peeters A, Bonneux L, de Laet C. Blood pressure in adulthood and life expectancy with cardiovascular disease in men and women: life course analysis. Hypertension. 2005;46:280–286. doi: 10.1161/01.HYP.0000173433.67426.9b. [DOI] [PubMed] [Google Scholar]
- Franklin SS, Pio JR, Wong ND, Larson MG, Leip EP, Vasan RS, Levy D. Predictors of new-onset diastolic and systolic hypertension: the Framingham Heart Study. Circulation. 2005;111:1121–1127. doi: 10.1161/01.CIR.0000157159.39889.EC. [DOI] [PubMed] [Google Scholar]
- Greenland P, Knoll MD, Stamler J, Neaton JD, Dyer AR, Garside DB, Wilson PW. Major risk factors as antecedents of fatal and nonfatal coronary heart disease events. JAMA. 2003;290:891–897. doi: 10.1001/jama.290.7.891. [DOI] [PubMed] [Google Scholar]
- Kannel WB, Vasan RS, Levy D. Is the relation of systolic blood pressure to risk of cardiovascular disease continuous and graded, or are there critical values? Hypertension. 2003;42(4):453–456. doi: 10.1161/01.HYP.0000093382.69464.C4. [DOI] [PubMed] [Google Scholar]
- Kaplan EL, Meier P. Nonparametric estimation from incomplete observations. J Am Stat Assoc. 1958;53:457–481. [Google Scholar]
- Natarajan S, Liao Y, Cao G, Lipsitz SR, McGee DL. Sex differences in risk for coronary heart disease mortality associated with diabetes and established coronary heart disease. Arch Intern Med. 2003;163(14):1735–1740. doi: 10.1001/archinte.163.14.1735. [DOI] [PubMed] [Google Scholar]
- Port SC, Boyle NG, Hsueh WA, Quinones MJ, Jennrich RI, Goodarzi MO. The predictive role of blood glucose for mortality in subjects with cardiovascular disease. Am J Epidemiol. 2006;163(4):342–351. doi: 10.1093/aje/kwj027. [DOI] [PubMed] [Google Scholar]
- Singh JP, Larson MG, O’Donnell CJ, Tsuji H, Evans JC, Levy D. Heritability of heart rate variability: the Framingham Heart Study. Circulation. 1999;99(17):2251–2254. doi: 10.1161/01.cir.99.17.2251. [DOI] [PubMed] [Google Scholar]
- Terry DF, Pencina MJ, Vasan RS, Murabito JM, Wolf PA, Hayes MK, Levy D, D’Agostino RB, Benjamin EJ. Cardiovascular risk factors predictive for survival and morbidity-free survival in the oldest-old Framingham Heart Study participants. J Am Geriatr Soc. 2005;53(11):1944–1950. doi: 10.1111/j.1532-5415.2005.00465.x. [DOI] [PubMed] [Google Scholar]
- Tsai W-Y. Estimation of the survival function with increasing failure rate based on left truncated and right censored data. Biometrika. 1988;75(2):319–324. [Google Scholar]
- Tsai W-Y, Jewell NP, Wang M-C. A note on the product-limit estimator under right censoring and left truncation. Biometrika. 1987;74(4):883–886. [Google Scholar]
- Vlagopoulos PT, Tighiouart H, Weiner DE, Griffith J, Pettitt D, Salem DN, Levey AS, Sarnak MJ. Anemia as a risk factor for cardiovascular disease and all-cause mortality in diabetes: the impact of chronic kidney disease. J Am Soc Nephrol. 2005;16(11):3403–3410. doi: 10.1681/ASN.2005030226. [DOI] [PubMed] [Google Scholar]
- Yashin AI, Manton KG. Effects of unobserved and partially observed covariate processes on system failure: a review of models and estimation strategies. Stat Sci. 1997;12 (1):20–34. [Google Scholar]