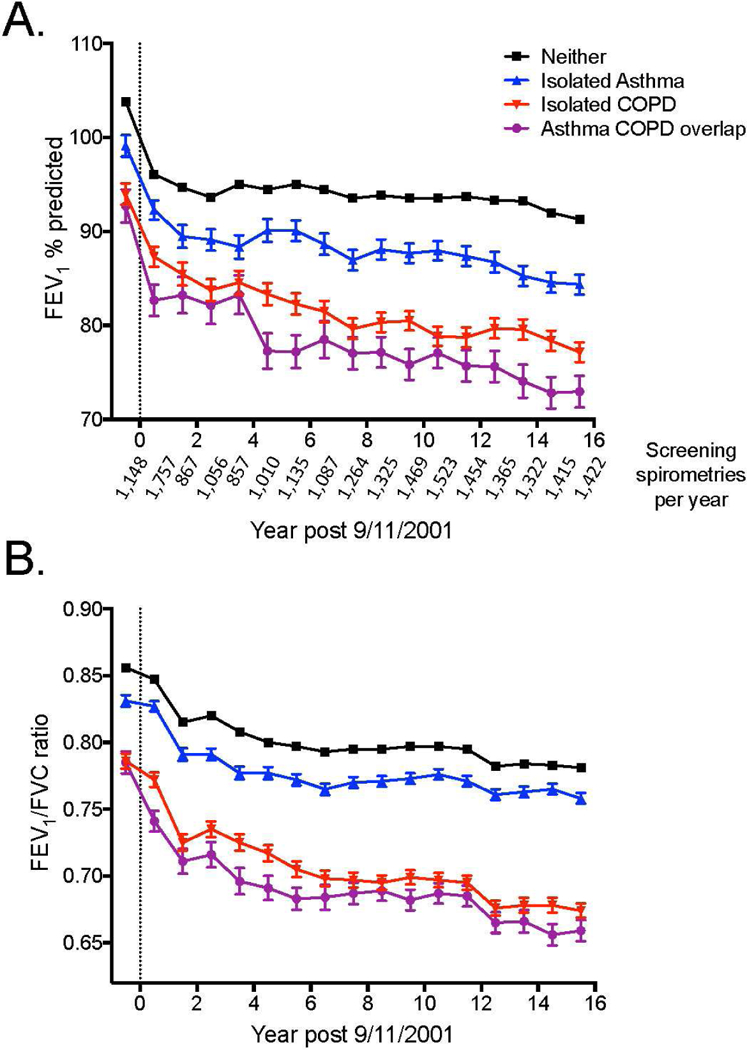
Figure 3. Lung function over time.

Panel A shows the mean (±SEM; SEM not shown if it is smaller than the size of the symbol) FEV1 % predicted in each year between 9/11/2000 and 9/10/2017 in the asthma/COPD overlap (purple), isolated COPD (red), isolated asthma (blue) and asthma-free and COPD-free (black) groups. The vertical line at 0 represents 9/11/2001. The number of spirometries per year is shown below the x axis. Panel B shows the mean FEV1/FVC ratio in the above groups in each year, adjusted for race, height and age, using the same number of spirometries per year as shown in panel A.
