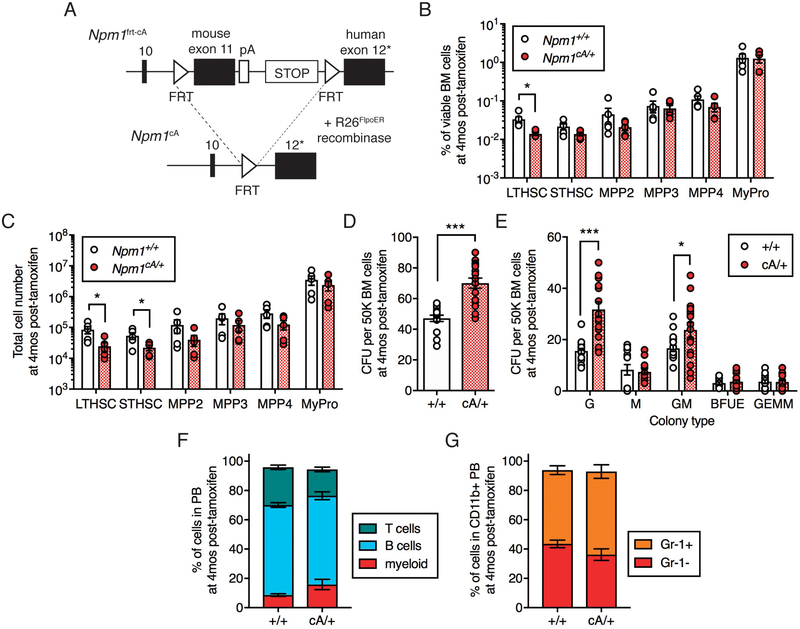
Figure 2. Npm1cA/+ depletes HSCs and expands myeloid colony-forming cells.
(A) Schematic diagram of the design of the Npm1frt-cA/+ allele. * indicates frameshift mutation to create a humanized mutant exon 12 (p.W288fs*12). (B) Frequency and (C) Total number of LTHSC, STHSC, MPP2, MPP3, MPP4 and MyPro cells in the BM of +/+ (n = 5) and cA/+ (n = 5) mice at 4 months post-tamoxifen. (D) Total CFU and (E) Colony types derived from 50K BM MNCs isolated from +/+ (n = 8) and cA/+ (n = 8) mice at 4 months post-tamoxifen. Results are from 4 independent experiments. (F) Frequency of myeloid, B and T cells within PB and (G) Gr-1+ and Gr-1− cells within myeloid PB at 4 months post-tamoxifen in +/+ (n = 6) and cA/+ (n = 12) mice. In all graphs, dots represent individual mice, bars indicate mean ± s.e.m. *P < 0.05; ***P < 0.001.

