

Abstract
We recently described the boundary-like expression pattern of the extracellular matrix (ECM) molecule Tenascin-C (Tnc) in the developing mouse olfactory bulb (OB) (Shay et al., 2007). In the present study we test the hypothesis that Tnc inhibits olfactory sensory neuron (OSN) axon growth in the developing olfactory bulb (OB) prior to glomerulogenesis. The period of time before glomerular formation begins, when axons remain restricted to the developing olfactory nerve layer (ONL), is crucial for axon sorting. Here, we show with in vitro analyses that OSN neurite outgrowth is inhibited by Tnc in a dose dependent manner, and that in stripe assays, axons preferentially avoid Tnc. Using Tnc null mice, we also show that that glomerular development is delayed in the absence of Tnc. In wild type mice, OSN axons coalesce into immature or protoglomeruli, which further differentiate and segregate into glomeruli. Glomeruli are first identifiable as discrete structures at birth. In null mice, glomeruli appear immature at birth, remain fused to the ONL and have a significantly larger diameter compared to wild type controls. By postnatal day 4, null glomeruli are indistinguishable from controls. Thus, OSN axons appear delayed in their coalescence into glomerular structures. These data correlate with behavioral reports of Tnc null mice which are delayed by 24 hours in their acquisition of an olfactory behavior (de Chevigny et al., 2006). Collectively, these data demonstrate that Tnc is an inhibitory boundary molecule in the developing OB during a key period of development.
Keywords: development, glomeruli, olfactory sensory neuron, guidance cues
Introduction
The projection of axons from the olfactory epithelium (OE) to the olfactory bulb (OB) is topographic. Olfactory sensory neurons (OSNs) express a single odor receptor (OR) from a family of approximately 1,200. The convergence of OSN axons expressing the same OR from widely distributed OSNs in the OE to discrete glomerular targets in the OB is a fundamental principle of organization in the olfactory system. This topographic projection appears very specific and is reproducible across animals. The OR proteins are necessary for correct OSN convergence (Mombaerts et al., 1996; Wang et al., 1998), however it is equally evident that they are alone insufficient for correct targeting. Some guidance molecules are also implicated in targeting (Cutforth et al., 2003; Schwarting et al., 2004; Serizawa et al., 2006; Kaneko-Goto et al., 2008 ) as well as cAMP signaling from the OR (Imai et al., 2006; Chesler et al., 2007).
We previously described the development of the OSN pathway (Treloar et al., 1996b, Treloar et al., 1999). Of note, OSNs undergo a waiting period in the developing olfactory bulb (OB), where they remain restricted to the olfactory nerve layer for up to 4 days prior to penetrating into deeper layers and forming synapses with the OB projection neurons. This waiting period is likely critical for sorting of axons and establishment of the appropriate topography between olfactory epithelium (OE) and OB. We previously identified tenascin-C (Tnc) in the mouse as a candidate inhibitory boundary molecule in the developing mouse OB, preventing OSN axons from entering deeper layers of the OB during this critical sorting period (Shea et al., 2008).
Here, our aim was to functionally test this hypothesis. Using an in vitro OSN neurite outgrowth assay we demonstrate that Tnc inhibits OSN neurite outgrowth from OE explants in a dose dependant manner. Moreover, this effect is specific to Tnc. When grown on a different tenascin substrate, tenascin-R (Tnr), which can also be inhibitory to neurite outgrowth (Taylor et al., 1993), there was no effect on outgrowth from the OE explants.
To further characterize the functional significance of Tnc, we examined olfactory development in Tnc null mice. In Tnc nulls we found a delay in glomerular formation. At birth, glomerular structures appear immature; they are not separated from the underlying ONL and appear “hairy” and larger than wild type controls. Analysis of glomerular diameter reveals they are significantly larger than controls. By postnatal day 4, however, null glomeruli are indistinguishable in size and appearance from controls, suggesting that axon coalescence and glomerulogenesis are delayed, but not completely blocked, by the absence of Tnc. This delay in glomerular formation is consistent with reports of delayed acquisition of a neonatal olfactory behavior in Tnc nulls (de Chevigny et al., 2006). Collectively, our studies demonstrate that Tnc is important for glomerulogenesis, providing an inhibitory cue for OSN axons in the OB prior to the period of synapse formation. When the cue is removed, axon coalescence and circuit establishment is delayed leading to altered olfactory behavior.
Methods
PCR and Western blot analysis
Animals
Pregnant, time-mated CD-1 mice (Charles-River, Wilmington, MA) were euthanized with CO2. Embryos (n = 12–36 at each age) were collected by cesarean section on gestational days 13, 15, and 17 (day of positive vaginal plug was designated day 0) and immediately decapitated. Postnatal mice (postnatal days (PND) 0, 2 and 4 (n = 6 – 12 at each age) were rapidly decapitated. Older postnatal mice (PND7, 14 and 21) and adult mice (n = 3 – 6 at each age) were euthanized with CO2. Olfactory bulbs (OBs) were dissected and immediately frozen in dry ice. Animal protocols were reviewed and approved by the Yale Animal Care and Use Committee.
RNA extraction and RT-PCR
RNA was extracted using RNeasy Plus Mini kit (Qiagen, Valencia, CA) following manufactures instructions. Briefly, 20 – 30mg frozen OB tissue was homogenized in Buffer RLT Plus with β-mercaptoethanol. DNA was removed through gDNA Eliminator column, and extracts were washed with 70% ethanol in RNeasy spin column. After several washes with Buffer RW1 and Buffer RPE, RNA was eluted with water. Total RNA concentrations were determined using spectrophotometry. cDNA was produced for each RNA sample using iScript cDNA Synthesis Kit (BioRad Laboratories Inc., Hercules, CA; cat # 170-8891) following manufactures instructions. Briefly, 1ug total RNA was incubated with a mixture of oligo (dT) and random hexamers together with the enzyme mix and synthesis kit buffer in a thermocycler programmed for 5 min @ 25°C, 30 min @ 42°.
PCR was performed for each primer pair using cDNA from E13, E15, E17, PND0, PND2 and PND4 OB cDNA using Platinum BluePCR SuperMix (Invitrogen, cat. #). 0.5μl 20μM premixed forward and reverse primers (see sequences below) and 2μl of cDNA reactions (see above) were mixed with 45μl Platinum BluePCR SuperMix, which was activated at 94°C for 1 min. cDNA was denatured for 45 sec @ 94°C, annealed for 45 sec @ 55°C seconds, and extended at 72°C for 45 sec; this cycle was repeated 30 times. Final extension was performed at 72°C for 10 min. Primers (5′-3′): TNC-FWD GCAACCAAGGACAATGTGTG; TNC-REV TGTGGTTTCAGACACCCGTA (amplicon 1844bp); β-actin-FWD GTGGGCCGCTCTAGGCACCAA; β-actin-REV CTCTTTGATGTCACGCACGATTTC (amplicon 540bp). TNC5fwd, TNC6rev, TNC5S and TNC6AS primer sequences were synthesized as described (Joestner and Faisner, 1999).
Immunoblotting
Dissected OBs from E15, E17, PND0, PND2, PND4, PND7, PND7, PND14 and PND21 were homogenized in lysis buffer (0.5M Tris, ph6.8, 2% SDS and 1X Complete Protease Inhibitor Cocktail (Roche, Indianapolis, IN) using a Dounce homogenizer. Protein concentrations were determined using Pierce BCA Protein Assay Kit (Thermo Scientific, Rockford, IL; cat # 23227). 10μg of each protein sample were resolved using 3–8% Tris-Acetate reducing gel (Invitrogen) to separate larger molecular weight proteins. Following electrophoresis, proteins were transferred to a nitocellulose membrane with an iBlot dry blotting system (Invitrogen) using program 3 with an 8 min transfer time recommended for larger molecular weight proteins.
Membranes were blocked in 5% BSA in Tris-buffered saline, pH 7.4 (TBS) and 0.1% Tween 20 (TBSTw) for 30 min at room temperature (RT), incubated in 5% BSA in TBSTw + primary antibody (either rabbit anti-Tnc (1:1000; Millipore cat# AB19013) or mouse anti-β-actin after stripping (1:1000; Abcam, Cambridge, MA; cat. # AC-15) for 60 min @ RT. Blots were washed 3 × 5 min in TBSTw, incubated in HRP-conjugated secondary antibodies (donkey anti-rabbit and donkey anti-mouse IgG respectively, Jackson ImmunoResearch, West Grove, PA) diluted 1:1000 in TBSTw for 30 min @ RT. Blots were washed 2 × 5 min in TBSTw, and 1 X TBS before incubation in chemiluminescence buffer (ECL Western blotting reagents; GE Healthcare, Buckinghamshire, UK) for 1min @ RT. Blots were exposed to Amersham Hyperfilm MP autoradiography film (GE Healthcare). Blots were stripped using Restore Western blot stripping buffer, 15 min @ RT (Thermo Scientific), washed 3 X TBS before incubating with second primary antibody. Blots were digitized using an Epson flatbed scanner. Band size was determined using Molecular Imaging Software v4.0 (Kodak).
Immunohistochemistry
Animals
Pregnant, time-mated CD-1 mice (Charles-River) were euthanized with CO2 and embryos collected by cesarean section at E13, E15 and E17 (n = 6–9 at each age). Neonatal mice at P0, P2, P4 and were rapidly decapitated (postnatal days 0, 2, and 4; n = 4–6 at each age). Heads were immersion fixed in 4% paraformaldehyde (PFA) in phosphatebuffered saline, pH 7.4 (PBS) at 4°C overnight. Following fixation, tissue was washed in PBS for at least 2 hrs, cryoprotected in 30% sucrose in PBS at 4°C, embedded in O.C.T. compound (Tissue-Tek; Miles Laboratories Inc., Elkhart, IN), and snap frozen in a slurry of dry ice and ethanol. Animal protocols were reviewed and approved by the Yale Animal Care and Use Committee.
Cryosectioning
Tissue was serially sectioned at 20μm in the coronal plane using a Reichert-Jung 2800 Frigocut E cryostat. Sections were thaw-mounted onto Superfrost Plus microscope slides (Fisher Scientific, Waltham MA), air dried, and stored at −20°C until use.
Immunohistochemistry
Immunostaining was performed as previously described (Shay et al., 2008). Briefly, sections were blocked with 2% bovine serum albumin (BSA); Sigma Chemical Co., St. Louis, MO) in TBS containing 0.3% Triton X-100 (TBST) for 30 min @ RT then incubated with different combinations of primary antibodies (detailed below, including sources) as a cocktail in block solution overnight @ 4°C. Sections were rinsed 3 × in TBST, incubated in a cocktail of corresponding fluorescence-labeled secondary antibodies (detailed below) diluted 1:1000 for 1 hr @ RT, rinsed 3 × in TBST, 1 × in TBS, and coverslipped in NPG fluorescent mounting media (5% n-propyl gallate in glycerol and 25mM NaHCO3). If needed, fluorescent DNA dye Draq5 (1:1000, Biostatus Ltd, Leicestershire, UK) or DAPI (1:1000, Invitrogen) was included with secondary antibodies to counterstain nuclei. Table 1 details the antibodies used in this study.
Tissue culture
Substrate preparation
Microexplants of OE were cultured on poly-D-lysine (PDL, mol wt 30,000–70,000, Sigma, cat. # P-7886) coated (50μg/ml in dH20, 30 min @ 37°C + 5% CO2, followed by 3 × rinses in dH20) 8-well CultureWell™ chambered coverglasses (Grace Biolabs, Bend, OR; cat# CWCS 8R-1.0). Coverglass wells were subsequently either left uncoated (i.e. PDL alone) or coated with either EHS-laminin (20μg/ml in dH20, overnight @ 37°C + 5% CO2, followed by 3 × rinses in dH20; Invitrogen, Carlsbad, California; cat. # 23017-015); Tnc (10, 15, 20 or 50 μg/ml in dH20, overnight @ 37°C + 5% CO2, followed by 3 × rinses in dH20; Millipore, Billerica, MA; cat. # CC115). Tnr (50 μg/ml in dH20, overnight @ 37°C + 5% CO2, followed by 3 × rinses in dH20; Millipore; cat. # CC116).
Stripe substrate preparation
Striped substrates were created using silicone matrices obtained from the Bonhoeffer lab (Knöll et al., 2007). Briefly, matrices were applied to PDL coated (50μg/ml) coverglasses (coated as above) and Tnc (20 μg/ml in dH20) was applied to the channels using a syringe. After 1 hr incubation @ 37°C + 5% CO2, channels were flushed with 3 × rinses in dH20 while aspirating the outlet hole via vacuum. Matrices were removed, a surrounding hydrophobic barrier quickly applied and dH20 reapplied to stripes temporarily to store the substrate prior to plating explants so ECM proteins did not dry out.
Microexplant preparation
OE explants were harvested from P1-P3 CD1 pups. Six pups were rapidly decapitated and the OE lining the nasal septum from the dorsal recess of the nasal cavity was dissected in sterile Dulbecco’s PBS (dPBS). Microexplants were prepared by using a brief (5 min) enzymatic digestion step followed by gentle trituration. Dissected OEs were digested using the Papain Dissociation Kit (Worthington Biochemical Corporation, Lakewood, NJ) following the manufacturer’s instructions. Briefly, components of the dissociation medium were reconstituted as per the manufacturer’s instructions; tissue was added and the mixture was equilibrated with 95% O2: 5% CO2. Tissue was dissociated by incubation with activated papain @ 37°C for 5 min, followed by gentle trituration. Dissociated cells were pelleted and then resuspended in medium containing the papain inhibitor ovomucoid, as provided in the Papain Dissociation Kit. Intact cells were separated from cell membranes by centrifuging through a single step discontinuous density gradient and the pellet was finally resuspended in culture medium (Neurobasal supplemented with B27, L-glutamine and penicillin/streptomycine; Invitrogen). Microexplants were then selected using a dissecting microscope in 50μl media and plated into culture wells. Explants were cultured for 48 hrs at 37°C + 5% CO2 before being fixed in 4% PFA/4% sucrose in PBS for 30 min @ room temperature followed by 3 rinses in PBS.
Analysis of Neurite Outgrowth
Cultures were immunostained and analyzed with MetaMorph image analysis software (Molecular Devices, Sunnyvale, CA). Briefly, explants were blocked with 2% BSA in TBST for 30 min than incubated rabbit polyclonal NCAM antibody (Millipore, Cat # AB5032) for 1 hr @ RT, rinsed 3X in TBST, incubated in donkey anti-rabbit Alexa-555 conjugated secondary antibody (1:1000; Invitrogen) together with DAPI (1:1000) for 30 min @ RT, rinsed 3X in TBST, 1X in TBS, and coverslipped in NPG mounting media. Staining was visualized using an Olympus BX51 fluorescence microscope. Analysis was performed with MetaMorph software (Molecular Devices, Sunnyvale, CA), which measured explant area (area stained by DAPI) and total explant and neurite area (area stained by NCAM) through its Integrated Morphometry Analysis program. Data was graphed and statistically analyzed using one-way ANOVA with a Dunnett’s Multiple Comparison Post Hoc Test with Prism 4 software (GraphPad Software Inc., La Jolla, CA).
Analysis of Tnc null mice
Animals
Pregnant, time-mated Tnc+/+ and Tnc−/− mice (Evers et al., 2002) were euthanized and embryos collected by cesarean section at E17 (n = 4 at each age). Early postnatal mice at PND0, PND2, and PND4 were rapidly decapitated. Heads were immersion fixed in 4% PFA in PBS. Tissue was washed in PBS for 24 hrs, cryoprotected in 30% sucrose in PBS at 4°C until the tissue sank, embedded in O.C.T. compound and snap frozen in a slurry of dry ice and ethanol.
Cryosectioning
Tissue was serially sectioned at 20μm in the coronal plane using a Reichert-Jung 2800 Frigocut E cryostat. Sections were thaw-mounted onto Superfrost Plus microscope slides (Fisher Scientific, Waltham MA), air dried, and stored at −20°C until use.
Immunohistochemistry
Immunostaining was performed as above. To assess glomerular formation, every 10th section from rostral to caudal was stained with rabbit anti- NCAM (1:1000) and guinea-pig anti-Vglut2 primary antibodies, followed by donkey antirabbit- Alexa-555 and goat anti-guinea-pig-488 (both 1:1000) secondary antibodies together with DAPI (1:1000). To assess formation of topographic projections, every 10th section from rostral to caudal was stained with rabbit anti-NCAM (1:1000) and the plant lectin DBA conjugated to biotin (1:50; Vector Laboratories, Burlingame, CA) followed by donkey antirabbit- Alexa-488 and avidin-568 (both 1:1000) secondary antibodies.
Glomerular diameter analysis
High magnification images of the glomerular layer on the medial surface of the OB were obtained from both the left and right OBs from each of 3 animals at every age (wild type and null), except for PND4 null mice, where only 2 animals were available. Glomerular diameter (parallel to the plane of the nerve layer) was measured in postnatal animals using the caliper function in MetaMorph. Glomerular boundaries were defined using 3 independent measures: NCAM immunoreactivity, Vglut2 synaptic staining and DAPI boundaries. Data was graphed and statistically analyzed using Students t – test with Prism 4 software (GraphPad).
Results
Expression of Tenascins in the developing OB
Previous results from our lab demonstrated immunolocalization of tenascin-C (Tnc) in the mouse OB in a boundary like pattern (Shea et al., 2007). Tnc has been reported to be inhibitory to neurite outgrowth for some classes of neurons or when presented as a sharp substrate boundary with a conducive substrate. To molecularly characterize Tnc expression in the OB, we first used RT-PCR to examine expression in the developing OB. As seen in Figure 1, using primers to a conserved region of the protein, Tnc mRNA (Fig. 1A) is detected in the developing OB during the period of olfactory pathway formation, confirming our prior immunolocalization studies (Shay et al., 2008). To assess changes in protein expression levels during OB development, we performed a Western blot (Fig. 1B). Multiple isoforms were observed, at 175, 190, 205, 260 and 270 kDa. The predominant species were the 260–270 kDa bands, which increased during the embryonic period and peaked at birth, a timepoint when glomeruli are first identifiable. Expression was then observed to gradually decrease over the first postnatal week, show a marked decrease over the second postnatal week, and by the end of the third postnatal week have levels of expression lower than E15, the first embryonic age examined. These data are consistent with immunlocalization of Tnc in tissue sections (c.f. Shay et al., 2008; Fig 8).
Figure 1. Characterization of tenascin-C (Tnc) expression in developing olfactory bulb.

(A) RT-PCR using primers specific for Tnc and β-actin using cDNA reverse transcribed from RNA isolated from OBs of various developmental ages. A 1844bp Tnc amplicon and a 540bp β-actin control amplicon product is detected in the OB at all ages examined. (B). Western blot analysis of Tnc expression reveals five splice variants of approximately 175, 190, 205, 260 and 270 kDa in the OB. Tnc expression of the higher Mr isforms is found to increase from E15 to birth, when expression peaks. During the postnatal period (birth to P21) expression of these isforms is observed to decrease. No expression of any isoform is detected in the adult (>3 months). β-actin load control (42kDa) confirms quantity of protein loaded on gel. (C) PCR anlyses of isoform expression. Using primers which span the alternatively spliced domains, isforms os all expected sizes are observed (i.e 0 to 6 FNIII domains). Note the 2 bands indicated with arrows seen using primer pairs TNC5fwd/TNC6rev. While these bands do not correspond to 300bp FNIII domains, they have been previously observed (von Holst et al., 2007) and may represent variant domains in this region.
Figure 8. Colocalization of Tnc and Phosphacan in the developing OB.

Coronal section of OB from E13-17 and PND0-4 stained with Tnc (green), phosphacan (red). Tnc and Pohsphacan partially co-localize, as evident by yellow overlap. However, distinct red and green staining is also evident. Phosphacan is found more extensively within glomerular structures than TNC (arrowheads). Both proteins are in a position to influence OSN axon growth.
Scale bar = 50μm..
To further investigate the isoforms of Tnc present in the developing OB, we employed the PCR-based approach developed by Joester and Faissner (1999) to confirm the observations seen in Western analyses (Fig. 1C). Using 2 different primers pairs which span the alternatively spliced domains, these analyses reveals Tnc isoforms of all the predicted sizes present in the developing OB. These data confirm the presence of multiple isofoms and indicates differential expression, but do not allow the identification of which specific isoforms are present. It must also be noted that this analyses does not indicate relative abundance of different size isoforms either, as the PCR reaction is biased towards the production of smaller amplicons.
Collectively, these data establish that Tnc upregulates expression during the period of initial olfactory pathway fornmation, and decreases in expression as the pathway is established. Moreover, Tnc has dynamic changes in isoform expression. Thus, Tnc is both spatially and temporally located in the developing olfactory pathway to influence OSN axon coalescence and the formation of OB glomeruli.
Functional characterization of tenascin effects on OSN neurite outgrowth
As Tnc is in a position to influence OSN axon growth in the developing OB, we developed an in vitro assay to assess the effects this candidate inhibitory cue. Microexplants of OE were generated by a brief (5 min) enzymatic digestion of OE harvested from postnatal mice followed by gentle trituration. This treatment results in small explants which can be adhered to substrates and neurite outgrowth assessed. Substrates comprise poly-D-lysine (PDL) coated glass coverslips (50μg/ml) that are incubated with extracellular matrix proteins for 1 hour at 37°C. Control experiments were performed on PDL alone; on a known potent promoter of OSN neurite outgrowth, laminin; and on another tenascin family member, Tnr, to determine the specificity of the effect. When OSN explants were grown on PDL, modest neurite outgrowth was observed (Fig. 2A). When laminin (20μg/ml) was added to the substrate, as expected from many studies in the literature (e.g. Kafitz and Greer, 1998), neurite outgrowth from OSN explants was greatly potentiated (Fig. 2B). However, when Tnc (20μg/ml) was added to the substrate almost no neurite outgrowth was observed (Fig. 2C), with axons preferring to extend within the explant itself rather than onto the substrate (green ring of axons extending around the edge of the explant; Fig. 2C). In contrast, when Tnr (20μg/ml) was provided there was no effect on OSN neurite outgrowth (Fig. 2D), with explants appearing indistinguishable from those grown on PDL alone (c.f. Fig. 2A).
Figure 2. Olfactory neurite outgrowth assay.

Olfactory epithelial explants plated on either poly-d-lysine (PDL) coated coverslips alone (A) or PDL coverslips subsequently coated with laminin (LN; as a positive control) (B), Tnc (C) or Tnr (D). Explants are grown for 48hrs then fixed and stained for NCAM and couterstained with DAPI. (A) When grown on 50μg/μl PDL modest neurite outgrowth from the explant is observed. (B) When 20μg/μl laminin is added to the substrate, neurite outgrowth is greatly potentiated, as expected. (C) When 20μg/μl Tnc is added to the substrate, neurite outgrowth is inhibited. (D) When 20μg/μl Tnr is added to the substrate, neurite outgrowth appears unaffected, as compared to PDL control explants. Scale bars = 50μm.
To characterize this inhibitory effect of Tnc on OSN neurite outgrowth, we determined the dose response of Tnc as a substrate (Fig. 3). Approximately 50 explants were analyzed for each condition (taken from 3 replicates) and analyzed using a 1 way ANOVA with a Dunnett’s Multiple Comparison Post Hoc Test. Tnc was found to be inhibitory for OSN neurite outgrowth, with significant differences observed via ANOVA (P<0.0001). Even at the lowest concentration tested,10μg/ml, a significant decrease in neurite outgrowth was observed (p<0.05). At 15μg/ml Tnc, OSN neurites were sparse and considerably less branched (Fig. 3C) which was further reduced at 20μg/ml when occasional, but often no, neurites were observed (Fig. 3D; c.f. Fig. 2C). Effects were also observed on growth cones. On PDL alone, growth cones were spread with many filopodia (arrowheads, Fig. 3A; insert is a high magnification image of the spread growth cone indicated with a red arrowhead). On 10μg/ml Tnc, explants had fewer spread growth cones (arrowheads, Fig. 3B), with more neurites ending in blunt “bull-nosed’ type growth cones (open arrowheads, Fig. 3B). At 15μg/ml Tnc no spread growth cones were observed; all processes tapered to blunt endings (open arrowheads, Fig. 3C; insert is a high magnification image of the bull-nose growth cone indicated with the red open arrowhead). Similarly, at 20μg/ml Tnc, when neurites were present they tapered to a blunt end (open arrowhead, Fig. 3D).
Figure 3. Dose response of OSN neurite outgrowth on Tnc.

Microexplants of olfactory epithelium plated on PDL coated coverslips (50μg/ml) that are subsequently coated with increasing concentrations of Tnc. Explants were grown for 48 hours, fixed, stained with NCAM (green) and DAPI (blue) and neurite outgrowth was assessed. (A) In the absence of Tnc, OSNs extend neurites, and large spread growth cones are observed (arrowheads, see insert (high magnification of growth cone indicated with red arrowhead)). (B) Explants grown on 10μg/ml Tnc appear to have shorter neurites and fewer spread growth cones (solid arrowheads), with more neurites ending in blunt “bull-nosed’ type growth cones (open arrowheads). (C) The neurites extending from explants grown on 15μg/ml Tnc were sparse, considerably less branched and tapered to blunt endings (open arrowheads, see insert (high magnification of growth cone indicated with red open arrowhead). c.f. inset in panel A). No spread growth cones were observed. (D) Explants grown on 20μg/ml Tnc were occasionally observed to extend neurites. Often no neurites were extended (see Fig. 3C). When neurites were extended, they had few or no branches and tapered to a blunt end (open arrowhead). (E) Quantification of dose response of neurite outgrowth on Tnc. Neurite outgrowth was determined by measuring total area of NCAM staining and dividing by the area of DAPI staining, to normalize for variability in explant size. Approximately 50 explants (49, 54, 47, 55 respectively) were analyzed for each condition (taken from 3 independent replicates) and analyzed using a 1 way ANOVA with a Dunnett’s Multiple Comparison Post Hoc Test. Significant differences were observed in the ANOVA (P<0.0001), and Tenascin-C was found to be an inhibitory molecule for OSN neurite outgrowth, with significant differences found between control (0μg/ml Tnc) and each Tnc concentration tested in a dose dependent manner using the Dunnett’s Multiple Comparison Test: 0 vs 10, P < 0.05; 0 vs 15, P < 0.01; 0 vs 20, P < 0.01.
Scale bar = 50μm. * P < 0.05. ** P < 0.01
Our dose response assays were performed when Tnc was presented as a uniform substrate. However Tnc is present in the OB in vivo in a boundary-like pattern. To determine the response of OSN neurite outgrowth to Tnc boundaries, we performed a modified stripe assay (Knöll et al., 2007), where explants were plated on a substrate with interdigitating stripes of PDL and Tnc (Fig. 4). Neurites preferentially grew out of the explant on PDL stripes, with little (Fig. 4A, C) or no (Fig. 4B) outgrowth from the explants on Tnc stripes. Branching was extensive on PDL stripes, but neurites stopped at Tnc boundaries (arrowheads Fig. 4A). Some neurites turned and grew along the boundary (Fig. 4B). Occasional fine processes entered a Tnc stripe (open arrowheads Fig. 4A, B), but these were rare instances and extension onto the Tnc stripe was minimal after 48 hrs in vitro. Further, it is of note that the fine processes that did extend slightly onto the Tnc stripe were secondary neurite branches and not primary neurites originating from within the explant.
Figure 4. Modified Stripe Assay of neurite outgrowth on Tnc.
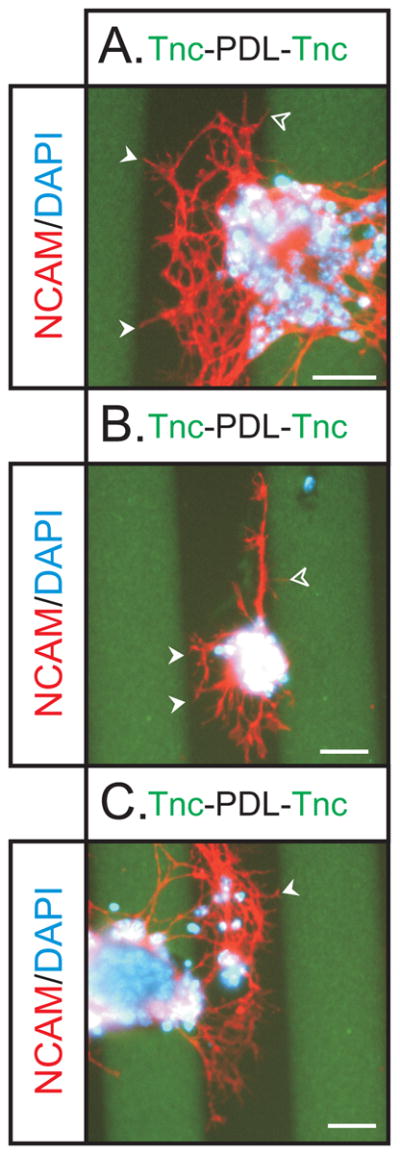
To assess OSN neurite behavior at Tnc boundaries, OE explants were plated on stripes of Tnc (green) intergigitating with PDL (black). Explants were grown for 48 hours, fixed, stained with NCAM (red) and DAPI (blue). Substrate was stained for Tnc (green) so boundaries could be visualized. (A) Explants were observed to preferentially extend neurites on PDL stripes, with few being extending on the green Tnc stripes. Within the PDL stripes, neurites extensively branched, but stopped at Tnc boundaries (solid arrowheads). One process appears to have crossed the boundary onto the Tnc stripe (open arrowhead) but it is very thin and has not gown far. It is likely that this thin process is sampling the substrate and in the process of retracting. (B) An explant that was observed to extend neurites along the Tnc boundary. Note the many neurites that stopped at Tnc boundaries (solid arrowheads). Again some fine processes were seen to extend onto the Tnc stripe (open arrowhead) which likely reflect sampling of the environment. The polarized growth from this explant preferentially in the PDL stripe versus the Tnc stripe indicates the preference of OSN axons to not grow on Tnc substrates. (C) Another example of the preferential growth and branching on PDL versus Tnc. Note the neurite that has stopped at the Tnc boundary (arrowhead). Scale bars = 50μm.
These data demonstrate that Tnc is an important boundary molecule influencing OSN axon outgrowth. Coupled with its expression pattern in vivo, this provides compelling evidence that Tnc may be an important determinant in the establishment of the primary olfactory pathway from the OE to the OB. Of further interest, primary neurites extending from explants robustly avoided Tnc boundaries, but there was some evidence that secondary branches may be less subject to the inhibitory effects of Tnc.
Olfactory bulb development in Tnc null mice
Given that we have demonstrated that Tnc is inhibitory to OSN neurite outgrowth in vitro, we next examined OB development in the absence of Tnc. We obtained tissue of Tnc−/− mice and wild type littermates (Tnc+/+) during the period of glomerulogenesis, specifically, at E17, PND0, PND2 and PND4. To determine whether the absence of Tnc, as a putative inhibitory/boundary molecule, would lead to deficits in OB development, we examined 2 aspects of pathway formation: 1) synapse formation; and 2) topography between OE and OB.
Synapse Formation
The vesicular glutamate transporter 2 (Vglut2) is restricted to the presynaptic compartment of axo-dendritic synapses made by OSN axons at their targets within glomeruli (Nakamura et al., 2005). As such, it can be utilized as a measure of OSN synaptogenesis in the developing OB. When comparing Tnc−/− mice and +/+ littermates at E17-PND4 stained with NCAM (red) and Vglut2 (green) (Fig. 5), some subtle differences were observed. Analysis was focused on the medial surface of the OB as previous studies have indicated this region shows more advanced development (Treloar et al., 1999). At E17 in wild type mice, synapses (green) appeared in a thin layer at the interface of the olfactory nerve ONL and deeper layers of the OB. Protoglomeruli (i.e. immature glomeruli) were observed as hemi-circular thickenings at the site of Vglut2 staining (arrowheads, Fig. 5A). They remained fused with the ONL, a feature characteristic of protoglomeruli. At E17 in null mice, synapses (green) were less dense as compared to wild types (Fig. 5B, c.f. 5A) with the layer of Vglut2 staining at the edge of the ONL appearing very thin and irregularly stained. Protoglomeruli were rarely, if ever, observed. While some regions were identified with increased density of VGlut2 staining, (open arrowheads, Fig. 5B) they were not hemi-circular, did not protrude into the dendritic zone, and were rarely observed (compare open arrowheads in Fig. 5B with arrowheads in Fig. 5A).
Figure 5. Glomerular development in Tnc −/− mice.
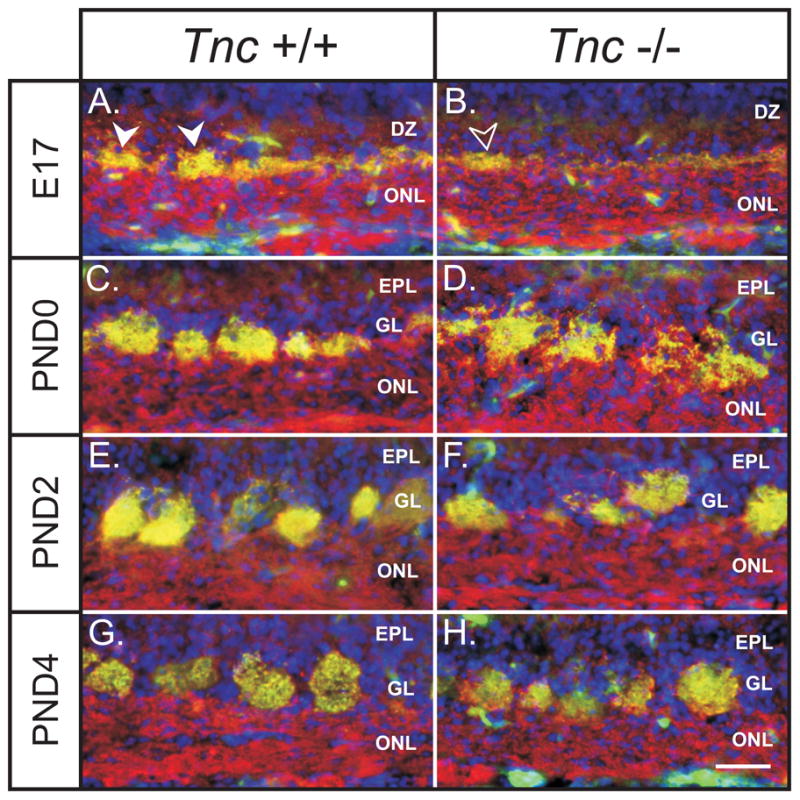
Coronal sections of Tnc+/+ and Tnc−/− medial olfactory bulb stained for the synaptic marker Vglut2 (green), the marker of OSN axons Ncam (red) and the nuclear marker DAPI (blue) at E17 (A, B), PND0 (C, D), PND2 (E, F) and PND4 (G, H). (A) In wildtypes at E17, VGlut2 staining is observed to be in a layer at the interface of the olfactory nerve layer (ONL) and the (DZ). Hemi-circular synaptic thickenings were observed in this layer (arrowheads) which are the immature glomeruli, or protoglomeruli, that are still fused and not separated from the ONL. (B) In null mice at E17, VGlut2 staining is also observed to be in a layer at the interface of the ONL and DZ, but considerably less dense than controls (c.f. panel A). Protoglomeruli were rarely, if ever observed. Some thickening in the layer of VGlut2 staining were occasionally observed (open arrowheads) however they were not hemi-circular and did not protrude into the DZ (c.f. arrowheads in panel A). (C) In wildtypes at PND0, glomeruli are discrete neuropil, separated from the ONL and forming their own layer, the glomerular layer (GL). (D). In null mice at PND0, glomeruli do not appear like the discrete structures seen in wildtypes. Rather, they have a more diffuse, “shaggy” appearance and are not separated from the underlying nerve layer. These structures also appear larger than control glomeruli. (E) In wildtypes at PND2, glomeruli appear to contain a high density of synapses. (F) In null mice at PND2, glomeruli appear more developed as compared to PND0. They appear more densely innervated (less “shaggy”) and separated from the ONL into a distinct GL. (G) In wildtypes at PND4, glomeruli appear to have increased in size as compared to PND2 (c.f. panel E). (H). In null mice at PND4 glomeruli appear indistinguishable from controls.
Scale bar = 100μm
By PND0, glomeruli were distinct discrete neuropil in wild type animals (Fig. 5C) but in Tnc null mice, glomeruli presented a more “shaggy” appearance (Fig. 5D), suggesting that the OSN axons had not fully coalesced into these structures. Similarly, glomerular-like structures in the null mice were not discrete or separated from the nerve layer, hence appearing immature – more like the protoglomeruli in wild type mice at E17 (compare Fig. 5D with Fig. 5A). By PND2, wild type glomeruli appeared to have further coalesced and to contain a high density of synapses (Fig. 5E). In contrast, null glomeruli at PND2 did not appear as tightly coalesced and continue to express and irregular outline (Fig. 56F), appearing more like PND0 wild type glomeruli (c.f. Fig. 5C). At PND4, wild type (Fig. 5G) and null (Fig. 5H) glomeruli were indistinguishable.
To determine if differences existed across the rostro-caudal axis of the OB, we examined sections every 100μm along the rostro-caudal extent of the OB (data not shown). To quantify the differences we observed, we measured the diameter of glomeruli in null and wild type mice from PND0 – PND4. Glomeruli were defined using 3 measures: 1) Vglut2 staining, 2) NCAM staining and 3) a nuclear stain (Draq5). Collectively, these defined the boundaries of developing glomeruli in these mice. Glomerular diameter was measured in the plane parallel to the ONL on the medial surface of OB using Metamorph software. Statistical differences were determined using an unpaired Students t test (Fig. 6A). We could not perform this analysis at E17 since even protoglomeruli were not yet readily distinguished from the ONL and because Vglut2 staining appeared as a continuous layer without evidence of the hemicircles indicative of protoglomeruli.
Figure 6. Quantification of glomerular development in Tnc −/− mice.

(A) Glomerular diameter was measured (parallel to the ONL) using Metamorph software on the medial surface of OB of Tnc+/+ and Tnc−/− mice at PNDs 0, 2 and 4. Glomeruli were identified as being both NCAM (red) and Vglut2 (green) positive and glomerular boundaries confirmed with DAPI staining (see Figure 6). At PND0, glomeruli were observed to have a significantly larger diameter (50.75 μm ± 1.46, n=217) in null mice compared to wildtype controls (37.47 μm ± 1.23, n=253) with P<0.0001 using an unpaired Students t-test. At PND2, glomeruli have coalesced in the null mice to 41.28μm ± 1.05 (n=303), which is still significantly larger compared to wildtype glomeruli which have a relatively unchanged diameter of 38.03μm ± 0.95 (n=343), with P= 0.0217 using an unpaired Students t-test. By PND4, both Tnc+/+and Tnc−/− glomeruli have increased in size from PND2, and are not significantly different from each other (P value = 0.4709; wildtype 42.44 μm ± 0.99 (n=298) and null 43.62 μm ± 1.35 (n=212)). (B) Histogram of glomerular diameter at PND0. In Tnc+/+ mice, the peak of the curve was located between bins 20 and 30μm, with 54.6% of glomeruli residing in these bins. In contrast, in Tnc−/− mice, the peak was located at 50μm, with 23% glomeruli residing in this bin. Thus the frequency distribution was clearly shifted to the left indicating larger glomerular diameter size. (C) At PND2, the Tnc−/− frequency distribution curve had shifted more to the right, as compared to PND0 and was much closer to the Tnc+/+ distribution curve. The peak of the Tnc−/− curve occurs at 40μm (bin contains 22.4% of glomeruli), while the peak of the Tnc+/+ curve is around 30μm (bin contains 23.3% of glomeruli). (D) By PND4, both Tnc−/− and Tnc+/+ curves have peaks that occur around 40μm (bins contain 27.8% and 24.2% glomeruli respectively).
At PND0, glomeruli had a significantly larger diameter 50.75 μm ± 1.46 (n=217) in null mice compared to wild type controls 37.47 μm ± 1.23 (n=253). At PND2, glomeruli have decreased (or coalesced) to an average diameter of 41.28μm ± 1.05 (n=303) in the Tnc null mice, but this is still significantly larger compared to wild type glomeruli with an average diameter of 38.03μm ± 0.95 (n=343). However, by PND4 both wild type and null glomeruli had increased in size from PND2, but were no longer significantly different from each other (null 43.62 μm ± 1.35 (n=212) and wild type 42.44 μm ± 0.99 (n=298)).
This analysis averaged glomerular diameter across the whole bulb, and therefore may have missed subtle changes within the population of glomeruli. Therefore, to more fully characterize the phenotype, we examined the frequency distributions (histograms) of glomerular diameter. At PND0 (Fig. 6B) the Tnc null histogram is skewed to the left of the wild type curve, with the peak (23% of glomeruli) around 50μm as compared to the wild type with a peak (27.7% of glomeruli) at 30μm (54.6% occur in bins 20μm and 30μm). By PND 2, the null histogram has moved towards the right, closer to the wild type curve (Fig. 6C). The peak (22.4% of glomeruli) of the null is around 40μm, while the peak of the wild type is around 30μm (23.3% of glomeruli). By PND4, both null and wild type have peaks (27.8% and 24.2% respectively) that occur around 40μm (Fig. 6D). These data demonstrate that glomeruli have a larger diameter in younger Tnc null mice but as development continues, coalescence of axons continues until glomeruli are indistinguishable from wild type controls.
Topography
As axon coalescence is initially impaired in these animals, we also investigated whether appropriate topography between epithelium (OE) and bulb was maintained. In preliminary studies we utilized antibodies against the odor receptor MOR28 (Barnea et al., 2004). However, while these antibodies did identify MOR28 expressing OSNs in the OE, they only did so using peroxidase detection, not immunofluorescence, and staining for MOR28 was not observed in OSN axons via either method (data not shown). Therefore, we turned to an alternate marker of a subset of OSN axons that project topographically to the OB. The plant lectin dolichos biflorus (DBA) labels a subset of OSN axons that project predominantly to the dorso-medial OB (Key and Akeson, 1993), and has previously proved useful to assess changes in topographic projections (Treloar et al., 1996a; 1997). We performed this analysis at multiple ages, but present here only PND0 (Fig. 7), the age with the most pronounced deficit in glomerular development (see above). In wild type mice, DBA (red, Fig. 7A) bound to OSN axons that target predominantly the dorsal and medial OB. These sections were matched in the rostro-caudal axis for both wild type and Tnc null mice as closely as possible, using anatomical features of the nasal cavity and surrounding tissue landmarks as guides. In null mice, axons bound by DBA (red, Fig. 7B) targeted the same regions of the OB when compared to wild type controls (c.f. Fig. 7A). While fine targeting deficits may not be revealed using this approach, it should be noted that wild type mice axons expressing the same odor receptor show small variations in their relative position (Strotmann et al., 2000). Thus, we conclude that at least the gross topographic projection of OSN axons from the OE to the OB appears largely intact in Tnc null mice.
Figure 7. Topography in neonatal Tnc −/− mice.
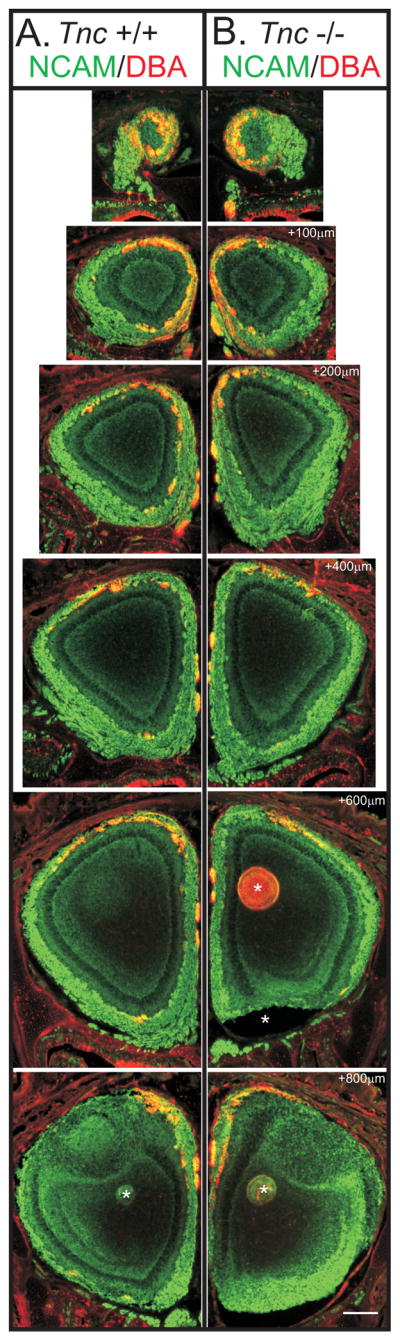
Coronal serial sections taken every 100μm from rostral to caudal of olfactory bulb of PND0 Tnc+/+ and Tnc−/− mice, stained for Ncam (green) and with the plant lectin dolichos biflorus agglutinin, DBA (red). DBA binds a subset of OSN axons which project predominantly to the dorsomedial OB (Key and Akeson, 1993). As expected, in Tnc+/+ mice, DBA+ OSN axons were found predominantly in the dorsal and medial OB. In null mice, DBA+ axons were also observed to target the dorsomedial OB. No obvious differences were observed in the topography of this subset of OSN axons.
Scale bar = 250μm.
*artifact from tissue sectioning.
Phosphacan
Tnc interacts with many components of the ECM. Complex and frequently overlapping patterns of expression have been reported with phosphacan, a chondroitin sulfate proteoglycan (CSPG) (Garwood et al, 2001). To determine whether these interactions were also occurring in the developing OB, we performed double label immunofluorescence localization studies using antibodies against Tnc and phosphacan (Fig 8). As is evident by colocalization (yellow), Tnc and phosphacn expression patterns partially overlap in the developing OB at all ages examined. This finding was somewhat surprising in light of our report that 6-sulfated CSPGs are not detected in the developing OB until E17 (Shay et al., 2008). We therefore conclude that phosphacan does not carry 6-CS sidechains until at least E17, when sulfation may change. Regardless, these data demonstrate that phosphacn, like Tnc, is also present in a boundary like pattern early in olfactory pathway development and may influence OSN axons. However, it is interesting to note that phsophacan is found more extensively within glomerular structures than TNC (arrowheads at PND2 and PND4).
Discussion
Here, we show that Tnc is an inhibitory boundary molecule developmentally regulated in the olfactory system. Our data support the hypothesis that Tnc within the OB is a regulatory mechanism that governs both the spatial and temporal parameters of OSN outgrowth and glomerulogenesis. Further, we show that the role of Tnc is ubiquitous across all OSNs, and does not differentially affect the topography between the OE and the OB. To our knowledge, this is the first identification of a molecular “stopwatch” regulating OB glomerulogenesis.
OSN axons emerge from the OE, coalesce into fascicles and approach the presumptive OB before achieving molecular heterogeneity. As they form the ONL, the axons reorganize, coalesce into molecularly defined fascicles from cells expressing the same OR, and penetrate the dendritic zone of the OB where they initially appear as protoglomeruli (Treloar et al., 1996b, Treloar et al., 1999). Within protoglomeruli the OSN axons establish excitatory synapses with both projection neurons, mitral/tufted cells, as well as subpopulations of interneurons, the periglomerular cells. By birth glomeruli are discrete structures, separated from the ONL (Treloar et al., 1999). Though glomerular development continues postnatally (Kim and Greer, 2000) during the early perinatal period responses to odors are easily demonstrated behaviorally (de Chevigny et al., 2006) and physiologically (Greer et al., 1982).
Our current data are consistent with this model, and show that protoglomeruli are apparent in wildtype mice at E17. As we previously described, protoglomeruli, although not yet distinct from the ONL, appear as hemicircles protruding from the ONL and into the underlying dendritic zone (Treloar et al., 1999). In contrast, in the absence of Tnc, while there is evidence of regions of increased density of Vglut2 puncta at the interface of the ONL, there are no protoglomeruli until PND0. Even as late as PND2, we found significant differences between the diameter of glomeruli in Tnc−/− and Tnc+/+ mice. Given our in vitro assays showing the boundary effect of Tnc on OSN axon outgrowth, our data are consistent with the hypothesis that Tnc plays a pivotal role in glomerulogenesis, in both initiation and refinement.
When initially generated Tnc−/− mice were reported to have no phenotype (Saga et al., 1992). More recently, Tnc deficient mice generated by Evers et al.(2002) showed many subtle phenotypes. For example, in the hippocampus Tnc has been implicated in, synaptic plasticity. Tnc−/− mice also have impaired low-frequency induced LTP (Evers et al., 2002) and deficits in hippocampus-dependent contextual memory (Strekalova et al., 2002). Tnc here may be acting, at least in part, through regulation of L-type voltage dependent calcium channels or sodium channels, both of which can bind Tnc (Srinivasan et al., 1998; for review see: Dityatev and Schachner, 2006).
Similar to the boundary-like pattern in the OB, Tnc defines the boundaries of barrels in mouse somatosensory cortex during the first postnatal week (Steindler et al., 1989). Cybulska-Klosowicz and colleagues (2004) used 2-deoxyglucose activity mapping to examine barrel fields in Tnc−/− mice. Similar to the decreased synaptic plasticity in the adult Tnc−/− hippocampus, the plasticity was also diminished in the cortical barrel fields with significantly less lesion-induced expansion of vibrissae cortical representation compared to controls. Decreased functional plasticity in somatosensory cortex after vibrissectomy highlights the point that the barrel cortex appears normal in adult Tnc−/− mice, but is less effective in remodeling of synaptic connectivity than controls. In light of our developmental data showing delays in glomerulogensis, it would be interesting to see if similar delays occur in barrel formation in Tnc−/− mice. Likewise, it would be equally interesting to see if reduced functional plasticity (i.e. odor induced learning) occurs in adult Tnc−/− mice.
Tnc−/− mice do display delayed onset of odor detection (de Chevigny et al., 2006), a discrete phenotype not unlike that described above for the hippocampus. However, the mechanisms underlying delays in the onset of odor detection were not clear. Our data now demonstrate that the delay in the acquisition of this odor-directed behavioral task most likely reflects the parallel delay in the formation of OB glomeruli. The slight temporal shift seen in their odor-detection data is consistent with a further retardation in the formation of the glomerular synaptic circuits, including primary afferent as well as local circuit connections (Kim et al., 2000). Similar to our data, they also show that the delayed acquisition of the odor preference is transient and is corrected as development continues.
What is the mechanism by which Tnc regulates glomerulogenesis? The cellular distribution of Tnc likely contributes to a mechanism that would underlie the earliest steps of glomerular formation, when axons begin exiting the ONL and coalescing within the dendritic zone. As discussed in the Introduction, myriad mechanisms are implicated in the coalescence of axons and glomerulogenesis. The data presented here are consistent with a model in which Tnc contributes to a combinatorial code governing these events, as proposed by Key and St John (2002). We suggest that the Tnc associated delay reflects an imbalance of cues affecting OSN axons. The later resolution of glomerular targeting/structure indicates that the loss of a single cue is insufficient to prevent the complete formation of this sensory pathway. This is consistent with perturbations in functional activity (CNG2A, ACIII, Golf), guidance molecules (Kirrel2, Kirrel3, Sema 3A, Npn-1, Plexin-A1, OCAM, ephrin-A5/EphA5, Big2) and cell surface carbohydrates (β3GnT1) (for review see Imai and Sakano, 2007; 2008).
We cannot discount the possibility that the effects observed in the Tnc−/− are secondary to postsynaptic mechanisms. For example, Tnc is expressed developmentally by radial glia (Bartsch et al., 1992; Stoykova et al., 1997; Götz et al., 1998) which could affect the migratory behavior of OB cells. Moreover, Tnc is highly expressed in the ventricular and subventricular zones and is a regulator of embryonic neural stem cell behavior, but apparently not that of adult stem cells (Garcion et al., 2004; Kazanis et al., 2007). Moreover, it does not appear that migration of neuroblasts into the OB from the rostral migratory stream is altered in adult Tnc null mice (de Chevigny et al., 2006). Consequently, given our in vitro data showing Tnc acting as a strong boundary molecule for OSN axons, we believe the most plausible mechanism is a primary effect on the OSN axons,
During development, a waiting period for axons targeting specific regions occurs throughout the brain and is thought to be important for the formation of proper neural networks (Schreyer and Jones, 1982; Ghosh and Shatz, 1992; Ozaki and Snider, 1997; Wang and Scott, 2000). For example, the projection pattern of dorsal root ganglion axons shows a delay between the formation of the dorsal funiculus and the extension of collaterals into the dorsal mantle layer (Ozaki and Snider, 1997). OSN axons have a similar waiting period when they first grow into the OB and form an ONL, prior to extending into the DZ and initiating glomerulogenesis (Treloar et al.,1999; Renzi et al., 2000). Inhibitory guidance cues have been identified which transiently prevent sensory afferents from penetrating the dorsal spinal cord during the waiting period (Watanabe et al., 2006). In the chick OB, class 3 semaphorins were identified as repellants which prevent OSN axons from prematurely entering the OB (Renzi et al., 2000). Here, we demonstrate delayed glomerular development in mice lacking Tnc, providing the first evidence in the mammalian olfactory system of an inhibitory guidance cue necessary for glomerular formation, and therefore the formation of the primary afferent synaptic circuit.
Interestingly, we did not observe the premature entry of OSN axons into the deeper layers of the OB in the absence of Tnc, as we expected. In chick, OSN axons overshoot the OB and enter cortex in the absence of Sema3A (Renzi et al., 2000) and thus, we hypothesized a similar phenotype would be seen in the absence of Tnc. However, there are reports of phosphacan, a chondroitin sulphate proteoglycan, present in the developing mouse OB in a boundary pattern similar to Tnc (Clarriss et al, 2000). We have confirmed that Tnc and phosphacan are present in largely overlapping spatio-temporal patterns in the developing OB. Tnc and phosphacan also share multiple molecular interaction sites, with each other and with many of the same cell surface receptors, including cell adhesion molecules, other matrix proteins, and growth factors (reviewed in Garwood et al., 2001). The data we present here suggests that other inhibitory cues like phosphacan, or other proteoglycans, are likely candidates to act in combination with Tnc in the developing OB to regulate the ingrowth of OSN axons. Regardless of the full nature of this combinatorial set of cues, our data clearly show that other molecules cannot fully compensate for the loss of Tnc (cf. Key and St. John, 2002). Thus, we contend, in addition to the milieu of cues that allow OSN axons to sort and coalesce into functional glomeruli, another class of cues regulates the timing of OB development. Within the olfactory system, these global cues, which affect all OSNs, are necessary to coordinate developmental events like glomerulogenesis.
In summary, the present study demonstrates that Tnc regulates OSN axon growth, likely by inhibiting growth into the OB prior the period of glomerular formation. In the absence of this molecule, glomerulogenesis is delayed, which results in delayed onset of odor responsiveness.
Acknowledgments
This work was support in part by NIH DC005706 and DC007600 to HBT, HHMI and NIH-NHLBI Fellowships to LVD, Deutsche Forschungsgemeinschaft to MS, and NIH DC00210 to CAG. The authors express their thanks to Christine Kaliszewski, Mike Akins, Diego Rodrigez Gil and Dolores Montoya for technical help, and Janice Mitchell for administrative support
References
- Barnea G, O’Donnell S, Mancia F, Sun X, Nemes A, Mendelsohn M, Axel R. Odorant receptors on axon termini in the brain. Science. 2004;304:1468. doi: 10.1126/science.1096146. [DOI] [PubMed] [Google Scholar]
- Bartsch S, Bartsch U, Dörries U, Faissner A, Weller A, Ekblom P, Schachner M. Expression of tenascin in the developing and adult cerebellar cortex. J Neurosci. 1992;12:736–49. doi: 10.1523/JNEUROSCI.12-03-00736.1992. [DOI] [PMC free article] [PubMed] [Google Scholar]
- Chesler AT, Zou DJ, Le Pichon CE, Peterlin ZA, Matthews GA, Pei X, Miller MC, Firestein S. A G protein/cAMP signal cascade is required for axonal convergence into olfactory glomeruli. Proc Natl Acad Sci U S A. 2007;104(3):1039–44. doi: 10.1073/pnas.0609215104. [DOI] [PMC free article] [PubMed] [Google Scholar]
- Clarris HJ, Rauch U, Key B. Dynamic spatiotemporal expression patterns of neurocan and phosphacan indicate diverse roles in the developing and adult mouse olfactory system. J Comp Neurol. 2000;423:99–111. doi: 10.1002/1096-9861(20000717)423:1<99::aid-cne8>3.0.co;2-i. [DOI] [PubMed] [Google Scholar]
- Cutforth T, Moring L, Mendelsohn M, Nemes A, Shah NM, Kim MM, Frisen J, Axel R. Axonal ephrin-As and odorant receptors: coordinate determination of the olfactory sensory map. Cell. 2003;114:311–322. doi: 10.1016/s0092-8674(03)00568-3. [DOI] [PubMed] [Google Scholar]
- Cybulska-Klosowicz A, Zakrzewska R, Pyza E, Kossut M, Schachner M. Reduced plasticity of cortical whisker representation in adult tenascin-C-deficient mice after vibrissectomy. Eur J Neurosci. 2004;20:1538–44. doi: 10.1111/j.1460-9568.2004.03605.x. [DOI] [PubMed] [Google Scholar]
- de Chevigny A, Lemasson M, Saghatelyan A, Sibbe M, Schachner M, Lledo PM. Delayed onset of odor detection in neonatal mice lacking tenascin-C. Mol Cell Neurosci. 2006;32:174–86. doi: 10.1016/j.mcn.2006.04.002. [DOI] [PubMed] [Google Scholar]
- Evers MR, Salmen B, Bukal O, Rollenhagen A, Bosl MR, Morellini F, Bartsch U, Dityatev A, Schachner M. Impairment of L-type Ca2+ channel-dependent forms of hippocampal synaptic plasticity in mice deficient in the extracellular matrix glycoprotein tenascin-C. J Neurosci. 2002;22:7177–7194. doi: 10.1523/JNEUROSCI.22-16-07177.2002. [DOI] [PMC free article] [PubMed] [Google Scholar]
- Garcion E, Halilagic A, Faissner A, ffrench-Constant C. Generation of an environmental niche for neural stem cell development by the extracellular matrix molecule tenascin C. Development. 2004;131:3423–32. doi: 10.1242/dev.01202. [DOI] [PubMed] [Google Scholar]
- Garwood J, Rigato F, Heck N, Faissner A. Tenascin glycoproteins and the complementary ligand DSD-1-PG/ phosphacan--structuring the neural extracellular matrix during development and repair. Restor Neurol Neurosci. 2001;19:51–64. [PubMed] [Google Scholar]
- Ghosh A, Shatz CJ. Pathfinding and target selection by developing geniculocortical axons. J Neurosci. 1992;12:39–55. doi: 10.1523/JNEUROSCI.12-01-00039.1992. [DOI] [PMC free article] [PubMed] [Google Scholar]
- Götz M, Stoykova A, Gruss P. Pax6 controls radial glia differentiation in the cerebral cortex. Neuron. 1998;21:1031–44. doi: 10.1016/s0896-6273(00)80621-2. [DOI] [PubMed] [Google Scholar]
- Greer CA, Stewart WB, Teicher MH, Shepherd GM. Functional development of the olfactory bulb and a unique glomerular complex in the neonatal rat. J Neurosci. 1982;1982 doi: 10.1523/JNEUROSCI.02-12-01744.1982. [DOI] [PMC free article] [PubMed] [Google Scholar]
- Imai T, Sakano H. Roles of odorant receptors in projecting axons in the mouse olfactory system. Curr Opin Neurobiol. 2007;17:507–15. doi: 10.1016/j.conb.2007.08.002. [DOI] [PubMed] [Google Scholar]
- Imai T, Sakano H. Odorant receptor-mediated signaling in the mouse. Curr Opin Neurobiol. 2008;18:251–60. doi: 10.1016/j.conb.2008.07.009. [DOI] [PubMed] [Google Scholar]
- Imai T, Suzuki M, Sakano H. Odorant receptor-derived cAMP signals direct axonal targeting. Science. 2006;314:657–61. doi: 10.1126/science.1131794. [DOI] [PubMed] [Google Scholar]
- Joester A, Faissner A. Evidence for combinatorial variability of tenascin-C isoforms and developmental regulation in the mouse central nervous system. J Biol Chem. 1999;274:17144–51. doi: 10.1074/jbc.274.24.17144. [DOI] [PubMed] [Google Scholar]
- Kafitz KW, Greer CA. The influence of ensheathing cells on olfactory receptor cell neurite outgrowth in vitro. Ann N Y Acad Sci. 1998;855:266–269. doi: 10.1111/j.1749-6632.1998.tb10580.x. [DOI] [PubMed] [Google Scholar]
- Kaneko-Goto T, Yoshihara S, Miyazaki H, Yoshihara Y. BIG-2 mediates olfactory axon convergence to target glomeruli. Neuron. 2008;57:834–46. doi: 10.1016/j.neuron.2008.01.023. [DOI] [PubMed] [Google Scholar]
- Key B, Akeson RA. Distinct subsets of sensory olfactory neurons in mouse: possible role in the formation of the mosaic olfactory projection. J Comp Neurol. 1993;335:355–68. doi: 10.1002/cne.903350306. [DOI] [PubMed] [Google Scholar]
- Key B, St John J. 0 Axon navigation in the mammalian primary olfactory pathway: where to next? Chem Senses. 2002;27(3):245–260. doi: 10.1093/chemse/27.3.245. [DOI] [PubMed] [Google Scholar]
- Kim H, Greer CA. The emergence of compartmental organization in olfactory bulb glomeruli during postnatal development. J Comp Neurol. 422:297–311. [PubMed] [Google Scholar]
- Klenoff JR, Greer CA. Postnatal development of olfactory receptor cell axonal arbors. J Comp Neurol. 1998;390:256–67. [PubMed] [Google Scholar]
- Knöll B, Weinl C, Nordheim A, Bonhoeffer F. Stripe assay to examine axonal guidance and cell migration. Nat Protoc. 2007;2:1216–24. doi: 10.1038/nprot.2007.157. [DOI] [PubMed] [Google Scholar]
- Lochter A, Vaughan L, Kaplony A, Prochiantz A, Schachner A, Faissner A. J1/tenascin displays dual, opposite effects on neurite outgrowth. J Cell Biol. 1991;113:1159–1171. doi: 10.1083/jcb.113.5.1159. [DOI] [PMC free article] [PubMed] [Google Scholar]
- Meiners S, Geller HM. Long and short splice variants of human tenascin differentially regulate neurite outgrowth. Mol Cell Neurosci. 1997;10:100–116. doi: 10.1006/mcne.1997.0643. [DOI] [PubMed] [Google Scholar]
- Mombaerts P, Wang F, Dulac C, Chao SK, Nemes A, Mendelsohn M, Edmondson J, Axel R. Visualizing an olfactory sensory map. Cell. 1996;87:675–86. doi: 10.1016/s0092-8674(00)81387-2. [DOI] [PubMed] [Google Scholar]
- Nakamura K, Hioki H, Fujiyama F, Kaneko T. Postnatal changes of vesicular glutamate transporter (VGluT)1 and VGluT2 immunoreactivities and their colocalization in the mouse forebrain. J Comp Neurol. 2005;492:263–88. doi: 10.1002/cne.20705. [DOI] [PubMed] [Google Scholar]
- Ozaki S, Snider WD. Initial trajectories of sensory axons toward laminar targets in the developing mouse spinal cord. J Comp Neurol. 1997;380:215–229. [PubMed] [Google Scholar]
- Renzi MJ, Wexler TL, Raper JA. Olfactory sensory axons expressing a dominant-negative semaphorin receptor enter the CNS early and overshoot their target. Neuron. 2000;28:437–447. doi: 10.1016/s0896-6273(00)00123-9. [DOI] [PubMed] [Google Scholar]
- Saga Y, Yagi T, Ikawa Y, Sakakura T, Aizawa S. Mice develop normally without tenascin. Genes Dev. 2002;6:1821–31. doi: 10.1101/gad.6.10.1821. [DOI] [PubMed] [Google Scholar]
- Saghatelyan A, de Chevigny A, Schachner M, Lledo PM. Tenascin-R mediates activity-dependent recruitment of neuroblasts in the adult mouse forebrain. Nat Neurosci. 2004;4:347–56. doi: 10.1038/nn1211. [DOI] [PubMed] [Google Scholar]
- Schreyer DJ, Jones EG. Growth and target finding by axons of the corticospinal tract in prenatal and postnatal rats. Neuroscience. 1982;7:1837–1853. doi: 10.1016/0306-4522(82)90001-x. [DOI] [PubMed] [Google Scholar]
- Schwarting GA, Raitcheva D, Crandall JE, Burkhardt C, Puschel AW. Semaphorin 3Amediated axon guidance regulates convergence and targeting of P2 odorant receptor axons. Eur J Neurosci. 2004;19:1800–1810. doi: 10.1111/j.1460-9568.2004.03304.x. [DOI] [PubMed] [Google Scholar]
- Serizawa S, Miyamichi K, Takeuchi H, Yamagishi Y, Suzuki M, Sakano H. A neuronal identity code for the odorant receptor-specific and activity-dependent axon sorting. Cell. 2006;127:1057–69. doi: 10.1016/j.cell.2006.10.031. [DOI] [PubMed] [Google Scholar]
- Shay EL, Greer CA, Treloar HB. Dynamic expression patterns of ECM molecules in the developing mouse olfactory pathway. Dev Dyn. 2008;237(7):1837–50. doi: 10.1002/dvdy.21595. [DOI] [PMC free article] [PubMed] [Google Scholar]
- Steindler DA, Cooper NGF, Faissner A, Schachner M. Boundaries defined by addhesion molecules during development of the cerebral cortex: the J1 / tenascin glycoprotein in the mouse somatosensory cortical barrel field. Dev Biol. 1989;131:243–260. doi: 10.1016/s0012-1606(89)80056-9. [DOI] [PubMed] [Google Scholar]
- Stoykova A, Götz M, Gruss P, Price J. Pax6-dependent regulation of adhesive patterning, R-cadherin expression and boundary formation in developing forebrain. Development. 1997;124:3765–77. doi: 10.1242/dev.124.19.3765. [DOI] [PubMed] [Google Scholar]
- Strekalova T, Sun M, Sibbe M, Evers M, Dityatev A, Gass P, Schachner M. Fibronectin domains of extracellular matrix molecule tenascin-C modulate hippocampal learning and synaptic plasticity. Mol Cell Neurosci. 2002;21:173–87. doi: 10.1006/mcne.2002.1172. [DOI] [PubMed] [Google Scholar]
- Strotmann J, Conzelmann S, Beck A, Feinstein P, Breer H, Mombaerts P. Local permutations in the glomerular array of the mouse olfactory bulb. J Neurosci. 2000;20:6927–38. doi: 10.1523/JNEUROSCI.20-18-06927.2000. [DOI] [PMC free article] [PubMed] [Google Scholar]
- Taylor J, Pesheva P, Schachner M. Influence of janusin and tenascin on growth cone behavior in vitro. J Neurosci Res. 1993;35:347–62. doi: 10.1002/jnr.490350402. [DOI] [PubMed] [Google Scholar]
- Treloar H, Tomasiewicz H, Magnuson T, Key B. The central pathway of primary olfactory axons is abnormal in mice lacking the N-CAM-180 isoform. J Neurobiol. 1997;32:643–58. doi: 10.1002/(sici)1097-4695(19970620)32:7<643::aid-neu1>3.0.co;2-4. [DOI] [PubMed] [Google Scholar]
- Treloar H, Walters E, Margolis F, Key B. Olfactory glomeruli are innervated by more than one distinct subset of primary sensory olfactory neurons in mice. J Comp Neurol. 1996a;367:550–62. doi: 10.1002/(SICI)1096-9861(19960415)367:4<550::AID-CNE6>3.0.CO;2-3. [DOI] [PubMed] [Google Scholar]
- Treloar HB, Nurcombe V, Key B. Expression of extracellular matrix molecules in the embryonic rat olfactory pathway. J Neurobiol. 1996b;31:41–55. doi: 10.1002/(SICI)1097-4695(199609)31:1<41::AID-NEU4>3.0.CO;2-F. [DOI] [PubMed] [Google Scholar]
- Treloar HB, Purcell AL, Greer CA. Glomerular formation in the developing rat olfactory bulb. J Comp Neurol. 1999;413:289–304. [PubMed] [Google Scholar]
- von Holst A, Egbers U, Prochiantz A, Faissner A. Neural stem/progenitor cells express 20 tenascin C isoforms that are differentially regulated by Pax6. J Biol Chem. 2007;282:9172–81. doi: 10.1074/jbc.M608067200. [DOI] [PubMed] [Google Scholar]
- Wang F, Nemes A, Mendelsohn M, Axel R. Odorant receptors govern the formation of a precise topographic map. Cell. 1998;93(1):47–60. doi: 10.1016/s0092-8674(00)81145-9. [DOI] [PubMed] [Google Scholar]
- Wang G, Scott SA. The “waiting period” of sensory and motor axons in early chick hindlimb: its role in axon pathfinding and neuronal maturation. J Neurosci. 2000;20:5358–5366. doi: 10.1523/JNEUROSCI.20-14-05358.2000. [DOI] [PMC free article] [PubMed] [Google Scholar]
- Watanabe K, Tamamaki N, Furuta T, Ackerman SL, Ikenaka K, Ono K. Dorsally derived netrin 1 provides an inhibitory cue and elaborates the ‘waiting period’ for primary sensory axons in the developing spinal cord. Development. 2006;133:1379–87. doi: 10.1242/dev.02312. [DOI] [PubMed] [Google Scholar]
- Weber P, Ferber P, Fischer R, Winterhalter KH, Vaughan L. Binding of contactin/F11 to the fibronectin type III domains 5 and 6 of tenascin is inhibited by heparin. FEBS Lett. 1996;389:304–308. doi: 10.1016/0014-5793(96)00609-6. [DOI] [PubMed] [Google Scholar]