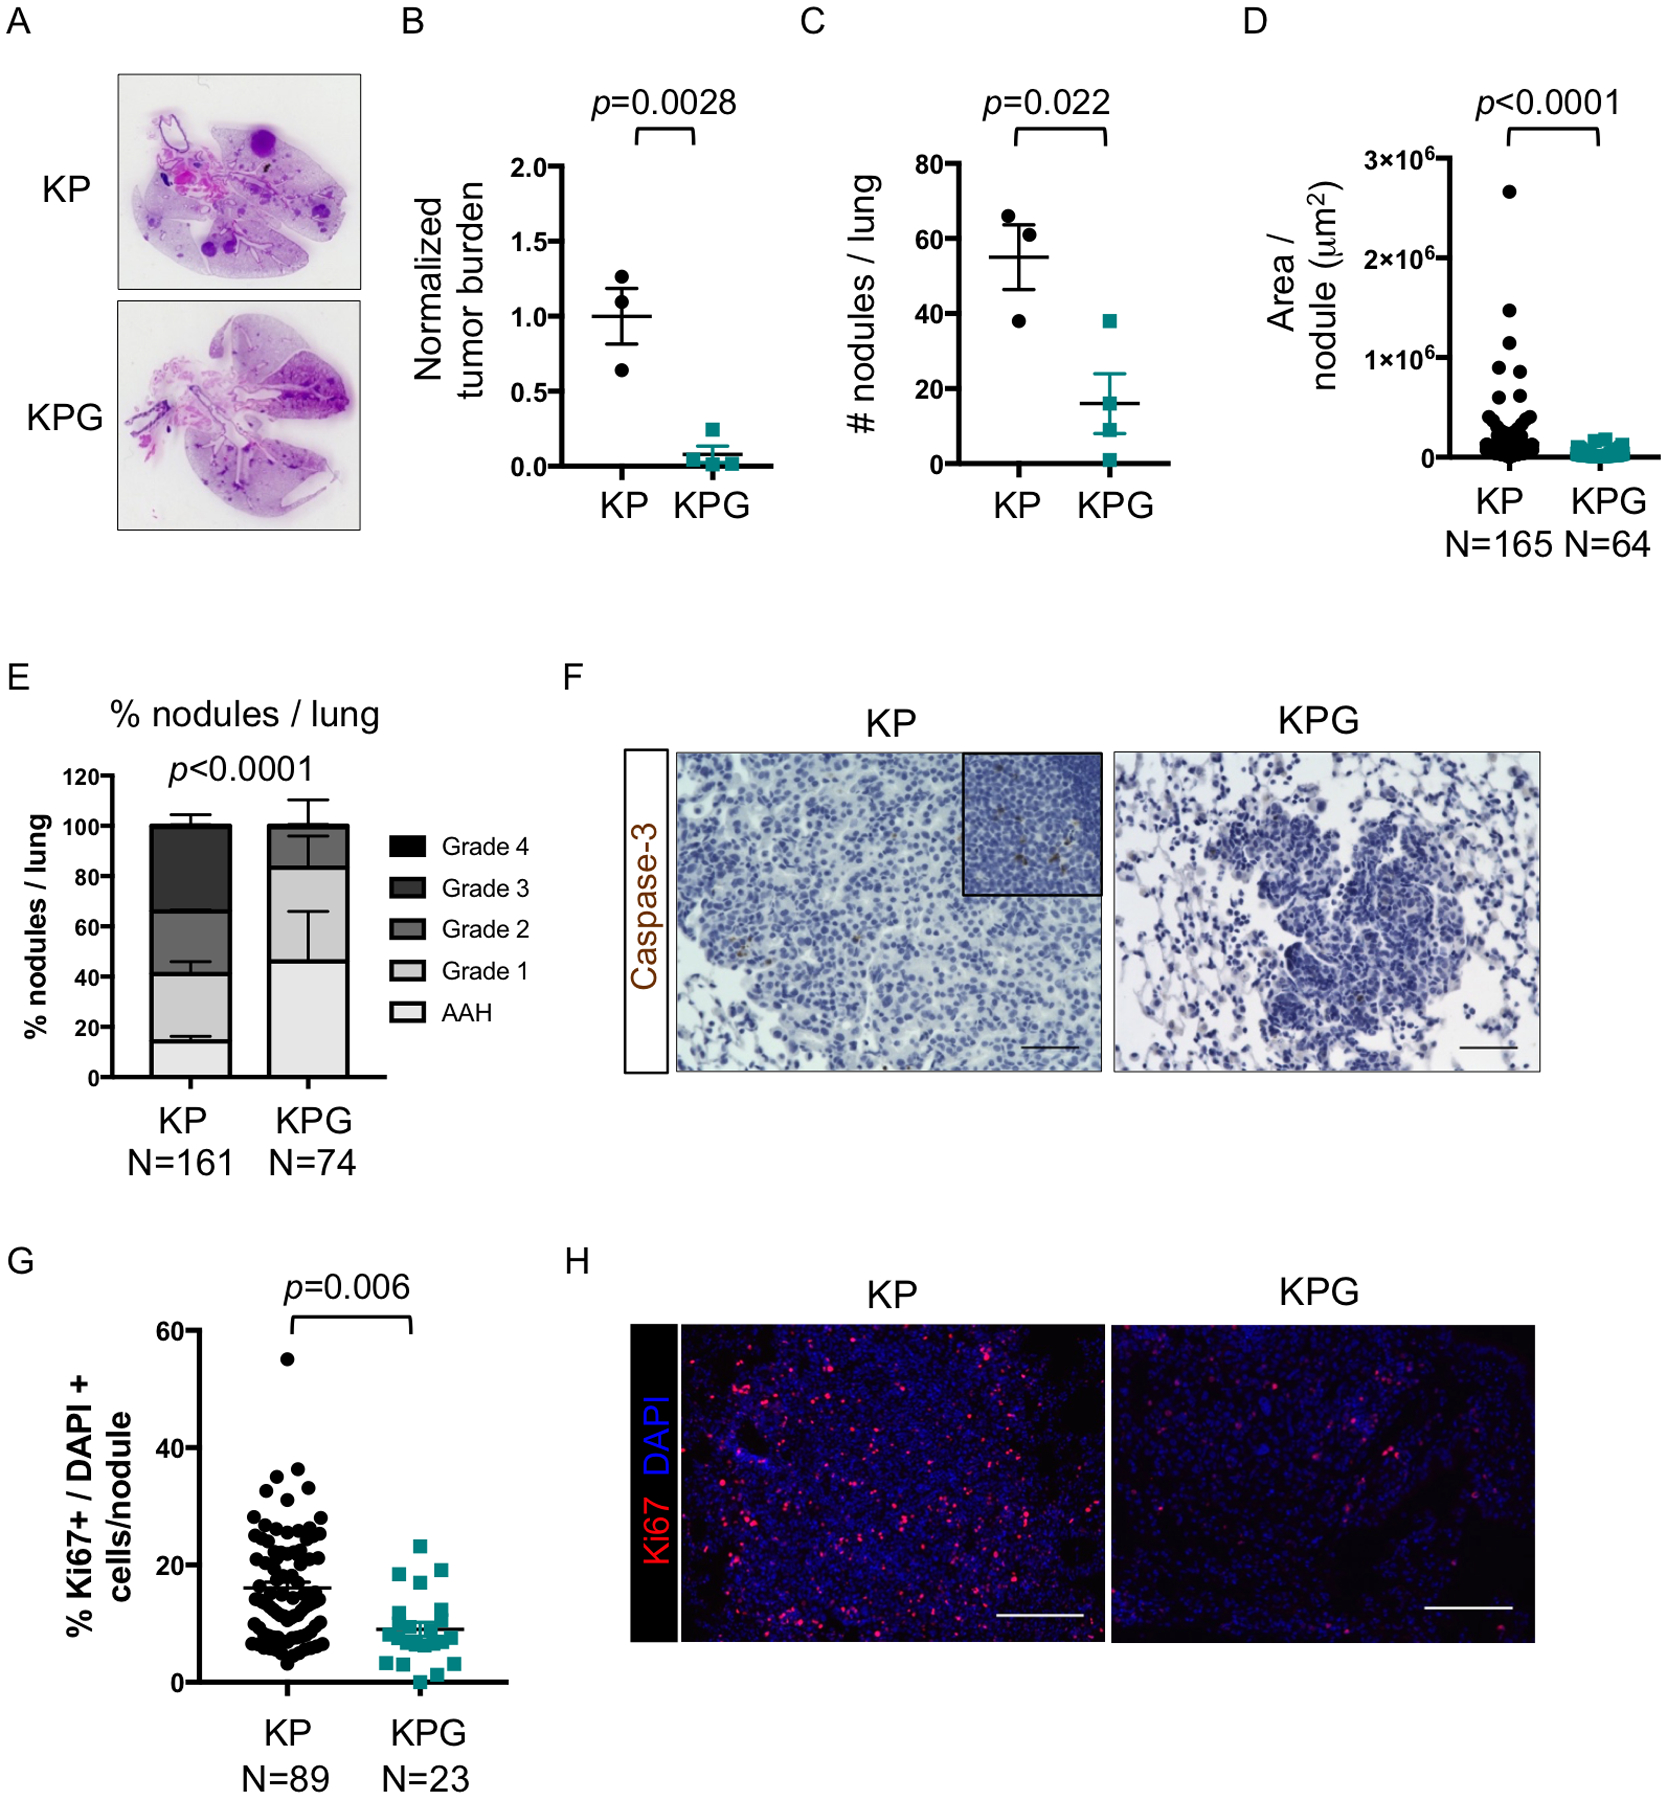
Fig. 2.

Gata6 loss impairs cell proliferation and tumor grade of KP tumors. a H&E of tumor-bearing lungs from KP and KPG mice from Fig. 1e. b-d Quantification/measurement of tumor nodules of mice from Fig. 1e (n = 3–4 mice). b Tumor burden was quantified by measuring the total tumor area per lung and normalized to the KP group. c Number of nodules per lung was quantified. d Nodule area was measured for each individual nodule (n = 64–165 nodules). e Tumors from Fig. 1e were graded as previously described42 (n = 74–161 nodules). AAH = atypical adenomatous hyperplasia. P-value by Chi-square. f Representative images of cleaved caspase-3 immunohistochemistry in mice from Fig. 1e. Top inset shows staining in the thymus as a positive control for Caspase-3+ apoptotic cells. Scale bar=50μm. g The percentage of Ki67+ cells relative to all DAPI+ cells was calculated per nodule from animals in Fig. 1e (n = 23–89 nodules). h Representative immunofluorescence of Ki67 (red) and DAPI (blue) from each group quantified in g. Scale bar=100μm. Unless indicated, data was plotted with standard error of the mean (SEM). P-value was calculated by unpaired t-test, except for d, where P-value was calculated by Mann Whitney.
