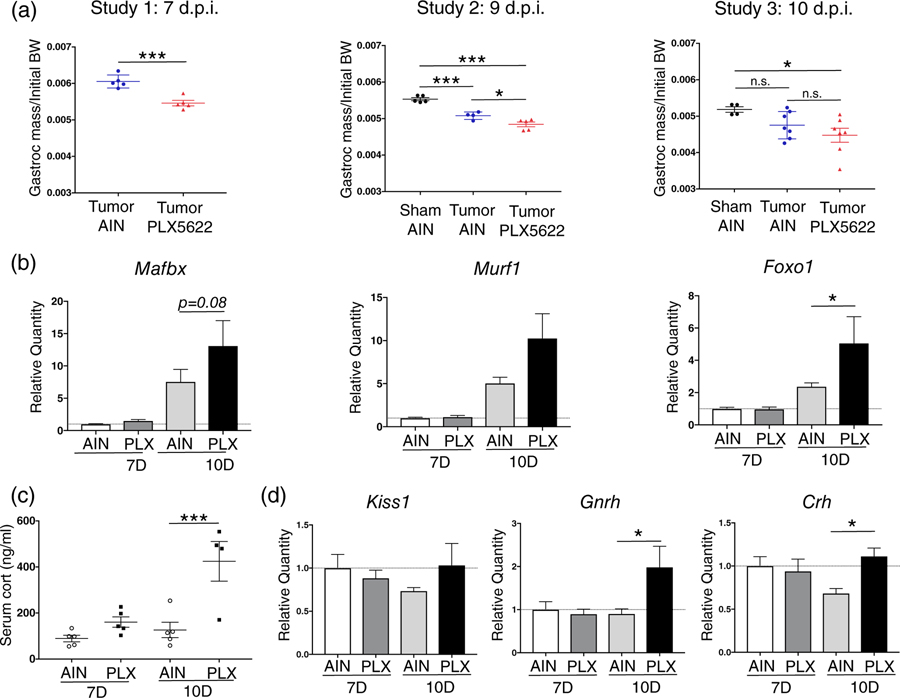
FIGURE 5.
Microglia depletion worsens muscle catabolism and is associated with increased HPA axis activity during PDAC. (a) Muscle catabolism, determined by gastrocnemius mass normalized to initial body weight. Studies were not pooled since normalized muscle mass varied between study. n.s. = not significant. For study 1 (as described in Figure 4), ***p < .001 in Student’s t-test. For studies 2 and 3, ***p < .001, *p < .05 in one-way ANOVA analysis. (b) qRT-PCR analysis of Mafbx, Murf1, and Foxo1 from RNA extracted from gastrocnemii. Values normalized to those from AIN 7d. PLX = PLX5622. n = 4–5/group. *p < .05 relative to AIN 10d comparing ΔCt values in Bonferroni post hoc analysis in two-way ANOVA. (c) Serum corticosterone, measured by ELISA, at 7 and 10 dpi in PLX5622- and AIN-treated tumor bearing mice. ***p < .001 in Bonferroni post hoc analysis in two-way ANOVA. Cort = corticosterone. n = 4–5/group. (d) qRT-PCR analysis of Kiss1, Gnrh, and Crh from RNA extracted from hypothalamic blocks at 7 and 10 dpi. Values normalized to those from AIN 7d. *p < .05 relative to AIN 10d comparing dCT values in Bonferroni post hoc analysis in two-way ANOVA. n = 4–5/group

