

Abstract
Accumulation of amyloid-beta (Aβ) into senile plaques in Alzheimer’s disease (AD) is a hallmark neuropathological feature of the disorder, which likely contributes to alterations in neuronal structure and function. Recent work has revealed changes in neurite architecture associated with plaques and functional changes in cortical signaling in amyloid precursor protein (APP) expressing mouse models of AD. Here we developed a method using gene transfer techniques to introduce GFP into neurons allowing the investigation of neuronal processes in the vicinity of plaques. Multiphoton imaging of GFP-labeled neurons in living Tg2576 APP mice revealed disrupted neurite trajectories and reductions in dendritic spine density compared to age-matched control mice. A profound deficit in spine density (∼50%) extends approximately 20 μm from plaque edges. Importantly, a robust decrement (∼25%) also occurs on dendrites not associated with plaques, suggesting widespread loss of postsynaptic apparatus. Plaques and dendrites remained stable over the course of weeks of imaging. Post-mortem analysis of axonal immunostaining and co-localization of synaptophysin and postsynaptic density 95 (PSD-95) protein staining around plaques indicate a parallel loss of pre- and postsynaptic partners. These results show considerable changes in dendrites and dendritic spines in APP transgenic mice, demonstrating a dramatic synaptotoxic effect of dense core plaques. Decreased spine density will likely contribute to altered neural system function and behavioral impairments observed in Tg2576 mice.
Keywords: Alzheimer, dendritic spine, senile plaque, Tg2576, dystrophic neurite, multiphoton
During the course of Alzheimer’s disease (AD), neuropil in vulnerable brain regions undergoes extensive degeneration including changes in neurite morphology and dramatic synapse and dendritic spine loss (reviewed by Spires and Hyman, 2004). Synapse loss appears particularly relevant since it closely correlates with degree of cognitive impairment (Terry et al., 1991; DeKosky et al., 1996; Coleman and Yao, 2003). The cause of synaptic loss in AD remains uncertain, in that it could be secondary to neuronal loss (Gomez-Isla et al., 1996), neurofibrillary tangles (Ingelsson et al., 2004), or the postulated synaptotoxic effect of Aβ (Walsh et al., 2002b).
Mouse models that overexpress APP develop plaques remarkably similar to those observed in AD, but do not recapitulate neurofibrillary pathology or widespread neuronal loss (Games et al., 1995; Hsiao et al., 1996; Irizarry et al., 1997a; Urbanc et al., 2002), allowing interpretation of results in the context of amyloid-related pathologies. Studies of these transgenic mice demonstrate plaque-associated dystrophic neurites with disrupted trajectories, glial activation, and free radical generation near plaques, each of which is also observed in AD brain (Le et al., 2001; D’Amore et al., 2003; McLellan et al., 2003). Dendritic spine loss occurs in APP transgenic models (Lanz et al., 2003; Moolman et al., 2004; Tsai et al., 2004), an important observation since spines form the postsynaptic element of the vast majority of cortical synapses and are the proposed site of synaptic plasticity underlying learning and memory (Segal, 2002). In a recent study using in vivo electrophysiology in the Tg2576 mouse model of AD, we observed disrupted cortical synaptic integration, which correlated with plaque formation (Stern et al., 2004).
The amyloid hypothesis holds that disrupted amyloid processing leads to neuron dysfunction and death in AD (Hardy and Selkoe, 2002). Much of the previous work has focused on axonal neuritic dystrophies and loss of presynaptic markers like synaptophysin (Masliah et al., 2001; Scheff and Price, 2003; Yao et al., 2003). In this study, we tested whether accumulation of amyloid in plaques in the mouse brain perturbs synaptic connections. To this end, we developed a method using gene transfer techniques to introduce GFP into cortical neurons allowing longitudinal observation of the fine structure of processes with in vivo 3-dimensional multiphoton microscopy. Observation of plaques and neurons in the living brain and post mortem analysis of immunostaining were used to address the questions of whether dense plaques cause local disruptions of dendrites, axons, and dendritic spines. Further, we compared neurons in control animals to those in Tg2576 cortex proximal to and distal from plaques to examine the effects of amyloid deposition on cortical microarchitecture. We found a striking focal synaptotoxic effect of plaques and importantly an overall loss of dendritic spines even quite far from plaques. To the extent that dendrite morphology and dendritic spines reflect fundamental structures necessary for the integration of signals in neocortical neurons, these changes likely contribute to the breakdown in electrophysiological integrity and behavioral abnormalities previously documented in Tg2576 mice (Hsiao et al., 1996; Stern et al., 2004).
Materials and Methods
Animals and surgery
Tg2576 mice transgenic for a 695-amino acid isoform of APP containing the Swedish mutation (Hsiao et al., 1996) and non-transgenic control mice between 21 and 24 months of age were used in this study (12 transgenic, 4 control). A younger cohort of mice between 8 and 10 months old was also used for analysis of presynaptic marker density (3 transgenic, 3 control). All animal work conformed to NIH and institutional guidelines. For intracortical injections of adeno-associated virus containing the gene for enhanced green fluorescent protein (GFP), mice were anesthetized with avertin (1.3% 2,2,2-tribromoethanol, 0.8% tert-pentylalcohol; 250 mg/kg) and placed in a stereotaxic apparatus. The surgical site was sterilized with betadyne and isopropyl alcohol and a 2-3 mm incision made in the scalp along the midline between the ears. Burr holes were drilled in the skull, 1 mm lateral to Bregma bilaterally. Using a Hamilton syringe, 4 μL of virus (titer 4.2×10¹² viral genomes/mL) was injected 1.2 mm deep in somatosensory cortex at a rate of 0.2 μL per minute. Following one injection in each burr hole, the scalp was sutured and the mouse recovered from anesthesia on a heating pad. In our hands, injection of GFP-AAV is not neurotoxic. Immediately around the needle track from the injection, we do observe some gliosis, but the images in vivo were captured away from the needle track to avoid any confound from damage due to the injection.
After a 2-3 week incubation period to allow expression of GFP in neurons, mice received an i.p. injection of methoxyX-O4 (10 mg/kg), a fluorescent compound that crosses the blood-brain barrier and binds to amyloid plaques (Klunk et al., 2002). The following day, a cranial window 6 mm in diameter was installed under avertin anesthesia as described previously (Bacskai et al., 2002; Klunk et al., 2002; Lombardo et al., 2003; Skoch et al., 2004). To facilitate finding the same sites in the brain between sessions, Texas Red dextran (70,000 Daltons molecular weight, 12.5 mg/mL in sterile phosphate-buffered saline, Molecular Probes, Eugene, OR) was injected into a lateral tail vein to provide a fluorescent angiogram.
Adeno-associated virus-construct and purification
In these experiments, the construct rAAV-CBA-EGFP-WPRE was used. The plasmid contains the AAV terminal repeats (TRs), the only remaining feature (and 4%) of the wild-type AAV genome. Flanked by the TRs, the expression cassette includes the following components, in (5'-3') order: (1) a 1.7-kb sequence containing the hybrid cytomegalovirus (CMV) immediate-early enhancer/chicken β-actin promoter/exon1/intron (Niwa et al., 1991); (2) the internal ribosome entry site (IRES) from poliovirus, which provides for bicistronic expression (Dirks et al., 1993); (3) enhanced green fluorescent protein cDNA (EGFP); (4) woodchuck hepatitis virus posttranslational regulatory element (WPRE) (Donello et al., 1998); and (5) the poly (A) tail from bovine growth hormone.
High titer AAV virus (serotype 2) was produced using plasmid triple-transfection, according to established protocols (Zolotukhin et al., 1999). Briefly, ten 15-cm dishes were seeded with HEK293 cells at a density of 1.7×10⁷ cells/dish the day before transfection in 25 ml DMEM containing 10% FBS. Cells were transfected with calcium phosphate/Hepes containing 180 ug of AAV-RC (Rep/Cap expression plasmid), 180 ug vector plasmid (e.g. pAAV-GFP), and 540 ug pHelper (Ad miniplasmid). The medium was exchanged after 30-40 minutes, and the cells were harvested after 48 hours. AAV was purified via gravity-flow column chromatography using Heparin-agarose suspension to bind the virus as follows: Harvested cells were resuspended in 25 ml DMEM. Cells were lysed using two freeze-thaw cycles in dry ice/ethanol. The lysate was incubated with 250 U/ml Benzonase at 37°C for 30 minutes and cleared by centrifugation at 8000 rpm for 10 minutes. The supernatant was incubated with 0.5% DOC for 37°C for 30 minutes. The lysate was then loaded onto a heparin column containing 3 ml of packed resin equilibrated with PBS, pH 7.4. The column was washed with PBS, pH 7.4, + 0.1 M NaCl. The virus was then eluted with PBS, pH 7.4, + 1M NaCl. Eluates were dialyzed into PBS using Pierce 10,000 MWCO cassettes, or concentrated and dialyzed using Amicon Ultra-15 centrifugal concentrators. Titers of purified virus were determined by quantitative real-time PCR (qPCR). The qPCR assay uses primers directed to the CBA promoter region of the vector genome. A standard curve of the vector plasmid was generated using a 5-log spanning serial dilution between 106 and 102 and copies/μl. The viral samples were serially diluted as necessary to fall within the range of the standard curve. PCR was performed using a Bio-Rad I-Cycler Real-time PCR. The reaction was carried out in a final volume of 50 μL, containing 200 fmol/μL of each primer, 25 μL of Master Mix (containing reaction buffer, Taq polymerase, and DNA double-strand specific SYBR Green I dye), and 1 μL of the template. Samples (standards and unknowns) are subjected to a 6 min incubation at 95°C, followed by 50 cycles of 30 sec at 95°C, 60 sec at 58.5°C, and 90 sec at 72°C. PCR products were subjected to melt curve analysis to exclude the possibility of amplification of unwanted products. Results were analyzed using the I-Cycler Software (Bio-Rad).
Multiphoton Imaging
Images of GFP-filled neuronal processes, amyloid pathology, and blood vessels were obtained using a Bio-Rad 1024ES multiphoton microscope (Bio-Rad Laboratories, Hercules, CA), mounted on an Olympus BX50WI upright microscope (Olympus Optical, Tokyo, Japan). A wax ring was placed on the edges of the coverslip of the cortical window and filled with distilled water to create a well for an Olympus 20x dipping objective (numerical aperture 0.95). A mode-locked Ti:Saphire laser (Tsunami, Spectra-Physics) generated 2-photon fluorescence with 800 nm excitation, and detectors containing 3 photomultiplier tubes (Hamamatsu, Ichinocho, Japan) collected emitted light in the range of 380-480, 500-540, and 560-650 nm (Bacskai et al., 2002). During each imaging session, low resolution images (614 μm x 614 μm x 5 μm sections; 20-60 sections per stack) around the GFP injection site were acquired to provide a map of the area. Higher resolution images were captured using the zoom feature in the Bio-Rad multiphoton software (approximately 150 x 150 x 0.8 μm sections; 10-70 sections per stack). Observations of the same dendrites and plaques over time were made using the 4D stack acquisition feature within imaging sessions and by taking images of the same dendrites and plaques in subsequent weekly imaging sessions.
At the end of imaging sessions, mice were allowed to recover and placed singly in their home cage. For subsequent weekly imaging sessions, mice were again injected with methoxy-XO4 the day before imaging, then anaesthetized with avertin, injected with Texas Red dextran iv, and observed under the 2-photon microscope as described above.
Immunohistochemisty
After completion of in vivo imaging experiments, animals were euthanized with an overdose of avertin (400 mg/kg) and the brain fixed in 4% paraformaldehyde in phosphate buffer with 15% glycerol cryoprotectant. Sections of 50 μm were cut on a freezing microtome and immunostained with primary antibodies to SMI312 (mouse monoclonal, 1:200; Sternberger Monoclonals, Baltimore, MD) and secondary anti-mouse conjugated to Cy3 (1:200; Jackson ImmunoResearch, West Grove, PA); or double stained with PSD-95 (guinea pig, 1:3,000; courtesy of Dr Morgan Sheng, Massachusetts Institute of Technology) and synaptophysin (rabbit polyclonal, 1:1000; Dako, Glostrup, Denmark) and secondary anti-guinea pig conjugated to Cy3 (1:1500) and anti-rabbit conjugated to Alexa 488 (1:500, Molecular Probes, Eugene, OR). For synaptophysin quantification, sections were stained with primary antibody to synaptophysin (1:1000, Dako) and secondary anti-rabbit antibody conjugated to Cy3 (1:500). Sections were counterstained with 0.2% Thioflavine S (ThioS) to label dense plaques. Micrographs of immunostaining were obtained on an upright Olympus BX51 fluorescence microscope with an Olympus DP70 camera, and images were processed to enhance contrast for figures in Adobe Photoshop.
Image processing and Data Analysis
To correct for motion artifacts induced by heartbeat and breathing, image stacks from in vivo experiments were aligned using AutoDeblur software (AutoQuant, Watervliet, NY). Images from the green channel with GFP-filled dendrites were further processed with the blind 3-dimensional (3D) deconvolution function in AutoDeblur to remove background noise. 2D projections of stacks from each of the three channels were combined in Adobe Photoshop (Adobe, San Jose, CA). Reconstructions of dendrites, plaques, and amyloid angiopathy in 3D were carried out using reconstruct software from synapse web at the Medical College of Georgia (www.synapses.mcg.edu).
GFP-filled dendrites that could be followed for more than 20 μm and that had identifiable dendritic spine protrusions were chosen for analysis. Dendrites and dendritic spines were traced on 2D projections of the green channel using the 3D image stack as a reference to follow protrusions and ensure that each spine counted connected to the dendritic shaft. The green channel alone was used for analyses to avoid bias since plaques are not visible in this channel. Measurements were carried out in Image J or Adobe Photoshop. The distance of each dendrite segment from the nearest plaque (if present) was measured on 3 channel images. The distance from the plaque edge was determined as the average of the distance measured from each end and the midpoint of the dendrite segment. Dendritic shaft diameters were measured at each end and the midpoint of each segment to provide an average diameter. Dendritic segments and dendritic spine lengths were also measured. Dendritic spine density was calculated as spines per μm along the dendritic shaft. Each spine was classified by morphology as mushroom, thin, or stubby as previously described (Nimchinsky et al., 2002; Spires et al., 2005). Cross-sectional areas of plaques were measured using Image J.
Dendrite curvature ratios were calculated by dividing the end-to-end distance of a dendrite segment by the total length between the two segment ends (Knowles et al., 1999; D’Amore et al., 2003). The number of dystrophies on each dendrite analyzed for spine density was also counted. Swellings with a diameter greater than 2.5 μm were classified as dystrophic.
The ratio of GFP intensity above plaques to intensity in the same plane as plaques was calculated as an estimate of relative neurite density in these areas. On image stacks from the green channel, a 20 μm x 20 μm region of interest was outlined in a z-image located 20 μm above a plaque and an identical region of interest was placed 20 μm lateral to the edge of the plaque in the same z-section as the plaque center. In Image J, a mean gray value was calculated for each region of interest and the ratio of GFP intensity above the plaque to lateral from the plaque was calculated. The ratio of SMI312 density and synaptophysin density near a plaque to distant from a plaque was similarly calculated using Image J. The mean gray value of staining was obtained in a square region of 50 μm x 50 μm adjacent to a plaque and another 50 μm x 50 μm region 100 μm from the same plaque in the same image. A phantom plaque was placed in young animals and control animals. Synaptophysin images were thresholded in Image J to remove background before optical density ratios were measured. The ratio of gray values adjacent to a plaque (or phantom) and 100 μm from a plaque was calculated.
Data are reported as mean ± standard deviation from the mean. Group means were compared using analysis of variance and Bonferroni post-hoc comparisons, and correlations were calculated in the StatView program (SAS Institute, Inc, Cary, NC).
Results
Synapse loss, often assessed using synaptophysin immunostaining, is consistently observed in AD and correlates with cognitive impairment (DeKosky and Scheff, 1990; Terry et al., 1991; Masliah et al., 2001). In the Tg2576 AD mouse model, qualitative light microscopy analysis of synaptophysin staining revealed no difference in synaptophysin immunoreactivity compared to control animals either at an age before amyloid deposition (8-10 months), or at a late stage with extensive plaque deposition (21-25 months). These observations concur with previous data in Tg2576 mice (Takeuchi et al., 2000; King and Arendash, 2002) and APP23 mice (Boncristiano et al., 2005) showing no change in synaptophysin immunoreactivity up to 19 and 24 months of age, respectively. However, we observed a qualitative decrease in density near Thioflavine S positive plaques in the older mice. Quantitative optical density analysis confirmed these observations. We compared optical density of synaptophysin immunoreactivity adjacent to plaques to that over 100 μm from the edge of a plaque (or phantom plaque in the case of young animals and controls). In the older age group, there was a trend toward a decrease in synaptophysin density near plaques of 44% (post-hoc test, p=0.1), even in this small sample.
The interesting local effect of plaques on synaptic apparatus was further examined in this older age group using in vivo multiphoton microscopy. An adeno-associated virus introduced the gene for enhanced green fluorescent protein into neurons in somatosensory cortex, methoxy-XO4 labeled amyloid plaques and cerebral amyloid angiopathy, and Texas red dextran provided a fluorescent angiogram for finding the same site in subsequent imaging sessions. A total of 12 Tg2576 mice and 4 non-transgenic mice were used in these experiments. Of those mice, 3 non-transgenic and 4 transgenic animals were followed through 2-3 weekly imaging sessions to observe changes in plaques and dendrites over time, and 6 transgenic and 4 control brains were utilized post-mortem for qualitative and quantitative immunostaining.
Amyloid plaques disrupt dendrite trajectories and are associated with dystrophic neurites
Dystrophic neurites form in the AD brain (Probst et al., 1983; Benzing et al., 1993; Su et al., 1993) and in APP transgenic mice (Games et al., 1995; Masliah et al., 1996); they are usually associated with amyloid plaques. We confirmed that dystrophic neurites, defined as areas of swelling greater than 2.5 μm in diameter, associate with plaques in Tg2576 cortex in vivo (Figure 1). The number of dystrophic neurites per plaque (an average of 6 per plaque) correlated with the plaque area (Pearson’s correlation coefficient 0.55, p = 0.005), possibly because larger plaques physically interact with more neurites than smaller plaques. The average area of the dystrophies is 18.8 μm2 and this area does not correlate with plaque size. Several groups have reported that these dystrophic swellings are both axonal and dendritic in origin (Su et al., 1993; Teter and Ashford, 2002; Stokin et al., 2005). Of 158 dystrophic neurites observed around plaques, 20 could be clearly identified as occurring on spiny dendrites (14.5%), implying that approximately 85% of observed dystrophies are axonal, arise from non-spiny dendrites, or from small spiny dendrites that were difficult to identify. Out of the 60 spiny dendrites analyzed for spine density, 5% had dystrophic swellings, whereas in non-transgenic mice, 0% of observed dendrites were dystrophic (Table 1).
Figure 1.
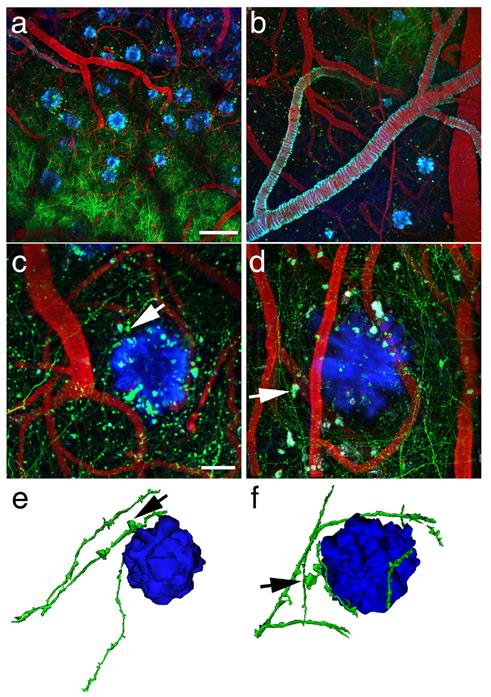
Amyloid plaques alter the morphology and trajectory of neurites in vivo. Low magnification images (a and b) provide an overview of the GFP-AAV injection site containing GFP-filled neurites (green), blood vessels containing Texas red, and amyloid deposition stained with methoxy-XO4 (blue). The angiogram, plaques, and cerebral amyloid angiopathy (seen coating a large vessel in b) are easily identified from week to week allowing re-imaging of the same sites over different imaging sessions. At higher magnification (c and d), we observe dystrophic neurites (arrows) associated with plaques. We also confirm that dendrites do not penetrate plaques, rather their trajectory curves around plaque edges. Three-dimensional reconstructions of plaques and neurites (e and f) clearly show this curvature around plaques and highlight dystrophies near plaques (arrows). Scale bars a and b 100 μm, c and d 20 μm.
Table 1.
| n (dendrites) | dendrite curvature ratio | % dystrophic dendrites | shaft diameter (μm) | |
|---|---|---|---|---|
| Control | 18 | 0.989±0.013 | 0 | 1.11±0.41 |
| Tg2576total | 56 | 0.963±0.041* | 5.1 | 0.90±0.21* |
p < 0.05 compared to control
Observations of GFP-filled neurites in vivo in Tg2576 cortex, followed by 3D reconstruction of the image sets, also revealed that neurites do not penetrate dense-cored plaques. Instead, the trajectories of neurites curved around plaques, sometimes becoming remarkably tortuous. This curvature becomes particularly evident when viewing rotating 3D reconstructions of plaques and surrounding dendrites (Figure 1 and supplementary figure 1). The curvature ratio of each dendrite segment was calculated as the end-to-end length of the segment divided by the total segment length (Knowles et al., 1999; D’Amore et al., 2003). Curvature Ratios of the dendrites analyzed in Tg2576 averaged 0.963±0.041 and in non-transgenic cortex 0.989±0.013 indicating that dendrites were more curved on average in APP transgenic mice (table 1: ANOVA F=6.710, p=0.0117). This is in close accord with previous work in another strain of transgenic APP mice (PDAPP) (D’Amore et al., 2003; Lombardo et al., 2003), and with analogous measures in human AD (Knowles et al., 1999). Previous work on younger, 12 month old Tg2576 mice showed that curvature ratios were affected near plaques but not distant from plaques (Le et al., 2001). The data presented here show the effect of plaques on neurite curvature extends beyond the immediate vicinity of the plaque at later stages of pathological progression.
In control animals, dendritic shaft diameter is 1.11±0.41 μm. Dendritic shaft diameter is 22% smaller in aged Tg2576 animals compared to controls (Table 1: ANOVA F[1,72]=11.436, p = 0.0012). There was no significant difference between dendritic shaft diameter within 15 μm of a plaque and those further away, and there was no correlation between distance from a plaque (measured as a continuous variable) and shaft diameter (Pearson’s correlation coefficient -0.190, p = 0.161), which indicates a general effect of plaques on dendrite diameter and not a focal toxicity that leads to a reduction of dendrite diameter.
Dendritic spine density decreases near plaques
We used high-resolution images obtained on the multiphoton microscope to analyze the effects of dense-cored amyloid plaques on dendritic spines. Spiny dendrites were traced on image stacks obtained in the green channel, which showed GFP-filled neurites (Figure 2). Dendritic spine density was determined for each dendrite segment, and the segments were then categorized based on their distance from a plaque edge, as observed in the 3 channel image. We observed that Tg2576 mice exhibit a 27.3% decrease in density along dendrites when compared to non-transgenic control mice (Figure 3, ANOVA F[1,72]=12.371, p = 0.0008). Furthermore, in the Tg2576 mice, dendrites within 15 μm of a plaque edge had 38.4% lower spine density than those farther away (Bonferroni post-hoc p < 0.0001) and 54.3% decrease compared to control animals (Bonferroni post-hoc p < 0.0001), indicating a focal toxicity of dense-cored amyloid plaques. Distance from plaque in microns correlates with increasing spine density (Pearson’s correlation coefficient 0.411, p = 0.0015). Plaque area does not affect the decrease in spine density (Pearson’s correlation coefficient -0.105, p = 0.432), i.e. small plaques appear as deleterious as larger plaques, at least over the size range of 23 to 8,147 μm2 cross-sectional area. The correlation is strongest over the first 20 microns from the surface of the plaque (Figure 3, R2 = 0.40) but it is important to note that even at distances of 50 to 100 microns away from the surface-relatively remote from the physical disruption of plaques which average 32.2±33.0 μm in diameter (n=392) -the density of spines is ∼25% less than in controls. As mentioned above, 5% of dendrites analyzed had dystrophic swellings. Although this is a small sample size, it is interesting to note that the spine density on the handful of dendrites with swellings was not lower than that of other dendrites within 15 μm of a plaque.
Figure 2.
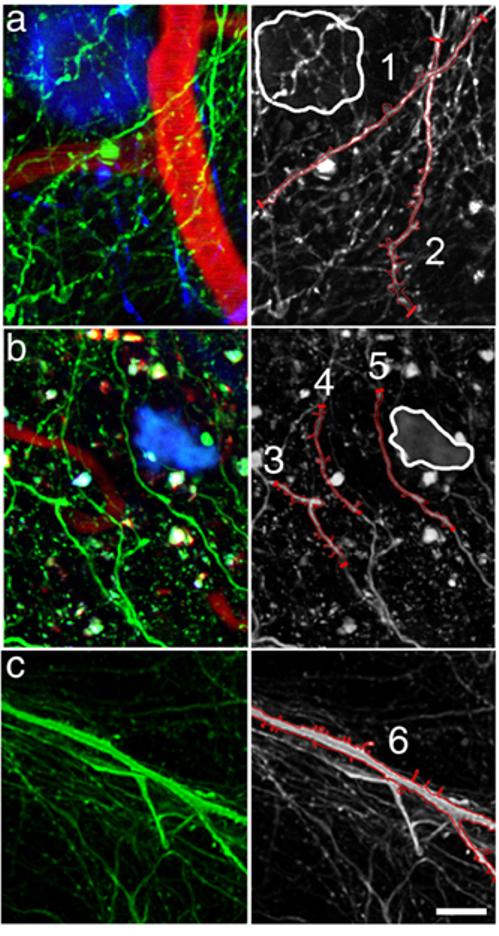
Dendrites in close proximity to plaques exhibit reduced spine density. Analysis of dendritic spine density in high-resolution multiphoton images of Tg2576 cortex (examples shown in a and b) revealed a decrease in dendritic spine density on dendrites within 15 μm of a plaque edge and an overall decrease in spine density when compared to non-transgenic control mice (example shown in c). The left column shows 3-channel images with neurites (green), plaques (blue), and blood vessels (red). The right column shows only the neurites-some of which have been outlined in red on the 2D projection to show the dendritic spines. Dendrite 1, which is within 15 μm of a plaque edge (outlined in white), has a lower spine density than dendrite 2 which is farther away from the plaque. Interestingly, the spine density on dendrite 2 is lower at the top which is nearer to the plaque. Similarly in part b, dendrites 3 and 4 have more spines than dendrite 5 that is closest to the plaque. Dendrite 6 is a spiny dendrite from a non-transgenic mouse. Scale bar 10 μm.
Figure 3.

Dendritic spine loss is most pronounced near amyloid plaques. Analysis of dendritic spine density in 12 Tg2576 and 4 control animals shows an overall reduction of 27.7% in Tg2576 cortex compared to control. Spine loss is even more dramatic near plaques with a 54.3% decrease in spine density within 15 μm of a plaque edge compared to control and a 37.5% decrease compared to dendrites farther from plaques (a). Spine densities are reported as the mean±standard deviation from the mean (* ANOVA F[1,72]=12.371, p = 0.0008; ** Bonferroni post-hoc test p < 0.0001). A scatter plot of spine density data from Tg2576 mice (b) shows a positive correlation between density and distance from a plaque (Pearson’s correlation coefficient 0.411, p = 0.0015). Even at great distances from a plaque edge, dendritic spine density is reduced compared to control density (dotted line).
Despite marked loss of spines, dendritic spine morphology and length, which affect post-synaptic integration of signals, were not changed by dense-cored amyloid plaques (Figure 4, Table 2). Analysis of spine length revealed no difference in average length or length of each morphological sub-group between control and transgenic cortex (n = 220 control spines, 364 transgenic). Dendritic spines averaged 1.6±0.6 μm in length. Similarly, there was no difference between spines on dendrites within 15 μm of a plaque edge and farther than 15 μm from a plaque in Tg2576 cortex. The proportion of spines exhibiting each of three morphological sub-groups was not significantly affected by transgenic status or by proximity to a plaque (Table 2). In all groups analyzed, approximately 55% of spines had thin morphology, 25% mushroom, and 20% stubby.
Figure 4.
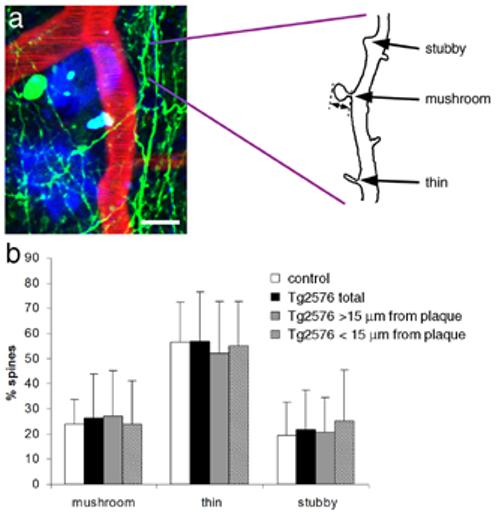
Dendritic spine length and morphology are not affected by amyloid plaques. Dendritic spines were analyzed on tracings of dendrite segments (a). The length of each dendritic spine was measured from the base where it meets the dendritic shaft to the spine tip (double-headed arrow). Spines were classified by morphology as mushroom, thin, or stubby (examples shown in a). There was no effect of the APP transgene or proximity to dense-cored plaques on the proportion of spines with each morphology (b). Scale bar 10 μm.
Table 2.
| n(spines) | spine density (spines/mm) | spine length(mm) | mushroom(length,% total) | thin (length,% total) | stubby(length,% total) | |
|---|---|---|---|---|---|---|
| Control | 220 | 0.33±0.12 | 1.25±0.54 | 1.47±0.60,23.9±9.7% | 1.26±0.49,56.6±15.8% | 0.74±0.21,19.3±13.5% |
| Tg2576 total | 364 | 0.24±0.08** | 1.24±0.64 | 1.51±0.74,26.3±17.6% | 1.25±0.57,56.9±19.7% | 0.69±0.25,21.8±15.7% |
| Tg2576 < 15μm from plaque | 76 | 0.16±0.07** | 1.19±0.58 | 1.33±0.62,24.0±17.1% | 1.16±0.56,55.0±17.8% | 0.65±0.22,25.3±20.2% |
| Tg2576 > 15μm from plaque | 288 | 0.27±0.07** | 1.25±0.66 | 1.58±0.78 27.2±18% | 1.28±0.57, 52.1±20.6% | 0.69±0.25, 20.8±13.6% |
p < 0.001 compared to control
Presynaptic bouton loss parallels spine loss
Sections stained with antibodies to PSD-95, a postsynaptic density protein, and synaptophysin, a presynaptic vesicle protein, showed co-localized puncta in control cortex and in Tg2576 cortex. In the Tg2576 brain, these markers are nearly absent within plaques, but show similar co-localization in neuropil to that seen in control, even in close proximity to Thioflavine S-positive plaques (Figure 5). The loss of synaptic marker staining around dense core plaques seen in figure 5 could represent both inhibitory and excitatory synapse loss, but the co-localization of pre and postsynaptic markers sheds some light on the presumed excitatory synapse loss implied by the loss of dendritic spines near plaques. Loss of spines suggests three hypotheses; loss of excitatory synapses (both spines and presynaptic elements), retraction of spines with a synapse remaining on the dendritic shaft, or loss of spines leaving behind a presynaptic bouton with no postsynaptic partner. The qualitative immunostaining data showing similar amounts of co-localization of pre- and postsynaptic elements indicate that presynaptic boutons are not left without a postsynaptic partner, which eliminates the third hypothesis. There were also qualitatively fewer synaptic puncta near plaques in the Tg2576 cortex compared to control cortex, indicating that spine loss reflects a loss of excitatory synapses and not a retraction of spines to form shaft synapses.
Figure 5.
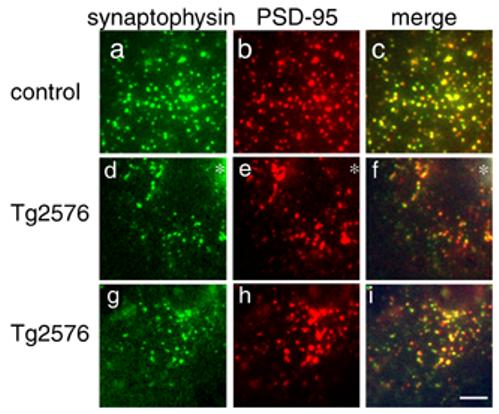
Spine loss reflects loss of excitatory synapses. Immunostaining for synaptophysin (a, d, g) and PSD-95 (b, e, h) reveals similar levels of co-localization (c, f, i) of these pre and postsynaptic markers in control cortex, Tg2576 cortex near the edge of dense plaques (asterisks in d, e, f), and in Tg2576 cortex distant from plaques (g, h, i). Similar amounts of co-localization indicate that dendritic spine loss in Tg2576 cortex is accompanied by loss of the presynaptic element, and not retraction of spines leaving a solitary presynaptic element. There are also qualitatively fewer synapses in Tg2576 cortex near plaques than in control, implying a loss of excitatory synapses concomitant with spine loss. Scale bar 5 μm.
Quantification of SMI312 neurofilament immunostaining of axons showed that axons are also excluded from the plaque but have a normal density around plaques (Figure 6). The ratio of SMI312 staining adjacent to a plaque to that 100 μm from a plaque is 1.03±0.10, a value close to 1, indicating no difference in axon density. Similarly, in control animals, the ratio of SMI312 density at a phantom plaque (randomly placed on the micrograph) and a site 100 μm away is 1.05±0.05. No filaments were visible within plaques, indicating an absence of axons within the dense cores of plaques. These data show that spines are lost near plaques despite no loss of axons. Importantly, this indicates that there may be a focal de-stabilization of synapses around plaques.
Figure 6.
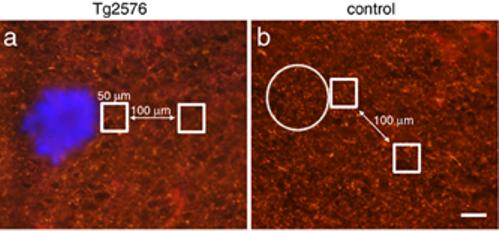
Axon density is not reduced near plaques. SMI312-positive axon immunoreactivity was quantified in Tg2576 cortex and control cortex. The ratio of staining intensity was compared in a 50x50 μm square region of interest adjacent to a plaque (stained blue with thioflavine S) and in an identical region 100 μm away. In control images, SMI312 immunoreactivity was measured adjacent to a phantom plaque (circle) and a site 100 μm away. There is no difference in this ratio between Tg2576 (a) and control cortex (b). In both conditions, the ratio is very close to 1 (1.03±0.10 in Tg2576 cortex, 1.05±0.05 in control cortex), indicating no difference in SMI32-positive axon density near plaques. Scale bar 50 μm.
Longitudinal imaging of plaques and dendrites in vivo
Observations of the same dense-cored amyloid plaques over the course of weeks demonstrate that in these aged Tg2576 mice, plaque size is very stable (Figure 7). Crosssectional plaque area varied widely ranging from 23 to 8,147 μm2. As seen in figure 7, the same plaques could be followed over several weeks of imaging. 3D reconstructions of the image stacks allowed rotation of the images to find plaques that would otherwise be obscured by CAA.
Figure 7.
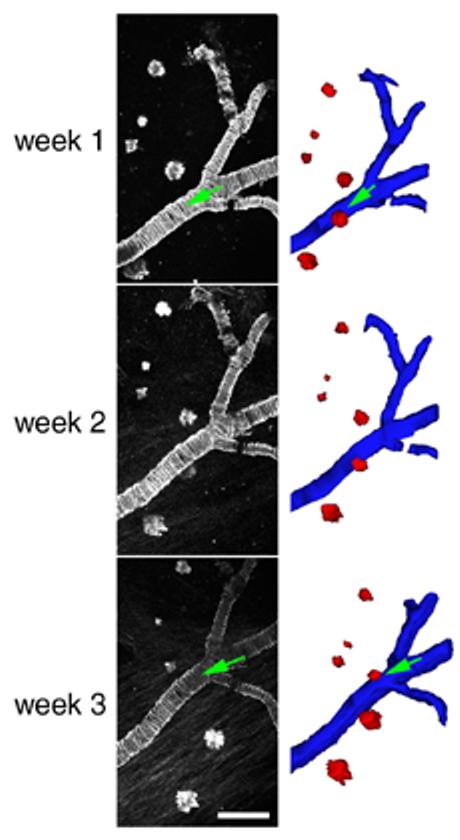
Dense-cored amyloid plaques are stable over time in 21-23 month-old Tg2576 mice. Most plaques observed did not change over the course of weeks. Cross-sectional area of plaques varied widely as seen in the examples above. Individual plaques followed over one week did not significantly change size (n = 169 plaques). Three-dimensional reconstruction of plaques (red) and cerebral amyloid angiopathy (blue) allowed rotation of the data sets in three dimensions and ensured that errors in analysis due to obstruction of plaques in 2D projections (green arrows) would not occur. Scale bar 100 μm.
Dendrites could also be followed over time in different imaging sessions (Figure 8). In contrast to the report of Tsai et al. (2004) who observed that over 10% of dendrites near a plaque disappear within 2 weeks, we did not see any dendrites disappear or change drastically over periods of up to two weeks. When looking at 2D projections of image stacks from different weeks, some dendrites seemed to change or disappear between imaging sessions due to slightly differing alignments of the animal in the stereotax.
Figure 8.
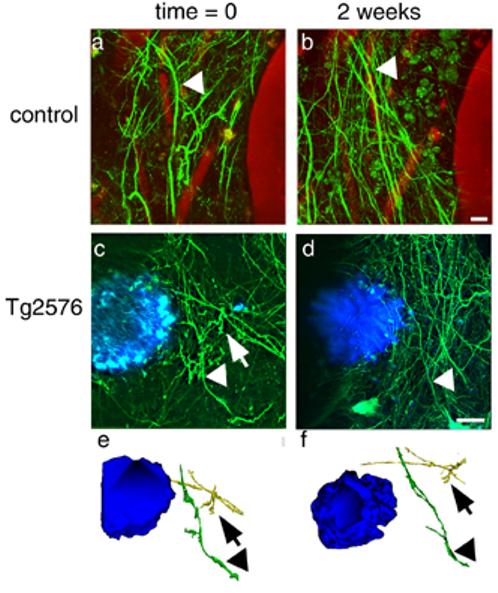
Dendrites are stable over time in control (a,b) and Tg2576 (c,d) cortex. The same dendrites could be identified in different weekly imaging sessions (arrowheads). In 2D projections of image stacks, some dendrites seemed to disappear over the course of 2 weeks (arrows), but examination of 3D reconstructions always showed that the dendrites were still present (e, f). Scale bars 10 μm.
Examination of the z-series of image stacks and 3D reconstructions always revealed that the dendrites were stable over time. To investigate the possibility of ascending dendrites breaking or terminating at the plaque as they ascend from GFP-filled cells (usually located in lower cortical layers 4-6), the intensity of GFP labeling in areas directly superior to plaques to those lateral to plaques was compared. If neurites were to break at the intersection with the plaque, one would expect the ratio of intensity above the plaque to the intensity next to the plaque to be <1 or for this ratio to decrease over time. We found that the intensity of GFP above plaques was higher than in the same plane as plaques (ratio superior/lateral = 1.41±0.52) and further that this ratio did not change over one week (second week 1.40±0.51, n = 3 animals, 30 plaques). This indicates that dendrites are not breaking at plaques in these mice.
Discussion
Synapse and dendritic spine loss are common factors in neurodegenerative diseases. Dementia in AD, Pick’s, Parkinson’s, Huntington’s, and ALS are all associated with loss of spines (reviewed by Fiala et al., 2002). In AD, synapses and dendritic spines are lost in the cortex and the hippocampus (Davies et al., 1987; de Ruiter and Uylings, 1987; Catala et al., 1988; Scheff et al., 1990; Scheff et al., 1996), and decreased cortical synapse density correlates with cognitive decline in patients (Terry et al., 1991; DeKosky et al., 1996). In mouse models of AD, our data and previous studies have shown that overexpression of mutant human APP causes synapse and dendritic spine loss, despite little or no cell death and no neurofibrillary pathology in the Tg2576, PDAPP, J20, and APP/PS1 models (Irizarry et al., 1997a; Irizarry et al., 1997b; Takeuchi et al., 2000; Lanz et al., 2003; Moolman et al., 2004).
In 8-10 month old Tg2576 mice, an age when plaque deposition is minimal, we observed no alterations in presynaptic marker staining. These data concur with previous studies of evoked synaptic responses showing no electrophysiological abnormalities in mice of the same age and significant alterations at 14 months, an age with substantial plaque deposition (Stern et al., 2004). In 21-25 month old mice, we observed a decrease in synaptophysin immunoreactivity only associated with plaques. To further investigate the hypothesis that dense plaques alter synaptic apparatus, we combined gene transfer approaches to introduce GFP into neurons in the adult cortex with in vivo 3-dimensional multiphoton microscopy to examine the fine structure of neuritic processes during a neurodegenerative process. The technique complements studies performed using mice transgenic for YFP in a subset of cortical neurons (Tsai et al., 2004; Holtmaat et al., 2005). Introduction of the gene for GFP using AAV has the advantages that the label is anatomically discrete, it can be introduced at any age into any animal model (including rats, etc.) and does not involve breeding to another strain of mice. The latter point is important in that some transgene arrays, like Tg2576, are sensitive to background strain influences, and some experiments (involving, for example, sensitivity to excitotoxicity or immune responses) are also highly dependent on background strain. This technique allowed us to further characterize the effect of plaques on the neuropil, and to test the hypothesis that a disruption of synaptic integrity near plaques contributes to the functional abnormalities observed in aged Tg2576 mice.
Our data show several dramatic alterations: (1) 3-dimensional reconstructions of plaques and neurites reveal an exclusion zone within the volume of the dense core plaques and dramatic changes in dendritic trajectory and morphology near plaques; (2) dendrites in Tg2576 mice are thin compared to controls, with a diameter about 20% smaller, corresponding to a cross sectional area only 65% of controls; (3) in the immediate vicinity of plaques there is a linear decrement in dendritic spine density; (4) dendritic spine loss does not affect the colocalization of pre and postsynaptic markers around plaques, indicating that spine loss is concomitant with presynaptic bouton loss and does not reflect a loss of spines leaving solitary presynaptic boutons.
Here we show that spine loss is most pronounced near plaques, indicating focal toxicity, however, the effect also extends beyond plaques leading to a more general disruption of cortical architecture. The changes are linearly related to distance from a plaque’s surface over the first 20 microns. Thus, these data clearly show that plaque effects go beyond those of a simple space-occupying lesion. Since axons are not lost near plaques, we know that the loss of dendritic spines is not simply due to a loss of axonal input. Further, the toxic effect of the plaques is specific to destabilizing synapses without destroying axons or dendrites to the same drastic extent. The identity of the synaptotoxic mediator around plaques remains uncertain. Plaques could be a source of toxic oligomeric species of Aβ (reviewed by Walsh et al., 2002a), toxic plaque-associated free radicals (El Khoury et al., 1998; McLellan et al., 2003), or cytokines and other bioactive substances generated by the activated astrocytes and microglia associated with plaques. The current results suggest an approach to test these hypotheses.
Two recent studies have used similar technologies to study dendritic spine structure in GFP or YFP overexpressing mice. Holtmatt et al (2005) showed that the density of spines on layer V pyramidal neurons in somatosensory cortex reached a stable value of 0.32/micrometer after postnatal day 26, comparable to our observation of ∼0.30/micrometer in the same brain area of aged nontransgenic mice. Tsai et al (2004) measured dendritic spines in tissue slices as well as in vivo imaging in YFP/APP-PS1 transgenic mice and observed a decrement in spine density of 46% compared to dendrites distant to a plaque, quite comparable to our observations of a 52% loss of spine density within 15 microns of a plaque compared to control animals. Tsai et al measured a dendrite diameter of ∼1.0 micron distant from a plaque and a plaque-associated decrease in dendritic shaft diameter of 20%; again comparable to our measures of ∼1.1 micrometer diameter and a decrease in dendritic shaft diameter of 18% compared to controls. One discrepancy between the studies is that Tsai et al measured a dendritic spine density of ∼1.0/micrometer in dendrites distant from a plaque -a substantially higher value than observed in our study or that of Holtmatt et al (Tsai et al did not include measures on control animals in their report). This difference may reflect use of DiI labeled dendrites in fixed brain slices rather than intravital microscopy used in the other studies. Tsai et al also reported that dendrites within a plaque abruptly ended and disappeared in subsequent imaging sessions, leading to the conclusion that dendritic breakage contributed strongly to the pathology. By contrast, we have not observed dendritic breakage either in our current studies or in previous multiphoton investigations of plaque/neurite interactions using fluorescent dextrans or YFP as the marker for the neurites (Brendza et al., 2003b; Brendza et al., 2003a; D’Amore et al., 2003). In our current study, we did frequently observe dendrites near plaques that were extremely tortuous and left the focal plane, but could be seen to be contiguous in 3 dimensional reconstructions of the Z series. Serial imaging weeks apart did not reveal any dendrites to be broken. While there is no doubt that the density of dendrites is diminished within the space occupied by a plaque (Knowles et al., 1998), the density of ascending dendrites is not diminished above plaques, arguing against widespread breakage of dendrites in the neocortex. The discrepancies between this work and that of Tsai et al. may be due to technical factors involved in imaging, to differences in stages of pathology examined (they looked at younger mice), or to a difference in model since we used APP transgenic mice and Tsai et al used mice that overexpress both mutant presenilin 1 and APP. Mutant PS1 may play a role in neurite stability (Berezovska et al., 1999).
Regardless of whether plaques cause dendrites to end abruptly or to simply become extremely tortuous, the marked change in dendritic structure and loss of spine density in a pattern that centers on, and radiates outward from a plaque implies a remarkable synaptotoxic effect of plaques and provides additional evidence that amyloid deposition per se is detrimental to neuronal circuitry. This “halo” effect, observed both in terms of neurite trajectories (Le et al., 2001; D’Amore et al., 2003) and in terms of spine density, greatly amplifies the effective region that each plaque disrupts and provides a possible morphological correlate for the dramatic alterations in synaptic integration that has been observed using electrophysiological recordings in mice with modest plaque burdens (Stern et al., 2004). The reduced dendritic spine density in Tg2576 mice is also consistent with findings in AD and mouse models of AD that showed decreases in mRNA for multiple synaptic genes (Chow et al., 1998; Coleman and Yao, 2003; Dickey et al., 2003). Insofar as dendritic diameter is thought to be an important contributor to signal integration and transduction in dendrites (Sorra and Harris, 2000; Holthoff et al., 2002), dendritic tortuosity is thought to alter temporal integration of convergent afferents (Knowles et al., 1999), and dendritic spines are the primary postsynaptic functional unit of the dendrite, these data strongly suggest that plaques provide the morphological underpinnings of functional impairments in Tg2576 cortex, and by extension, in AD.
We have recently demonstrated that treatment with anti-Aβ antibodies in APP transgenic mice can remove plaques (Bacskai et al., 2002), straighten the trajectory of neurites (Lombardo et al., 2003) and even rapidly resolve some of the neuritic swellings near plaques (Brendza et al., 2005). Our ongoing studies seek to determine if such therapies can also restore dendritic spine densities and neural system function. Moreover, the development of long term gene expression strategies using viral vectors combined with in vivo imaging promises a variety of potentially exciting applications for the study of neurodegeneration and other neuropathological and physiological processes.
Acknowledgements
This work was supported by NIA grant AG08487, Alzheimer Association Pioneer Award, EB00768, AG020570, NIA 5 T32 AG00277. We would also like to thank Phill Jones, Monica Garcia-Alloza, Greg Hickey, Jennifer Orne and Alix de Calignon for their contributions.
References
- Bacskai BJ, Kajdasz ST, McLellan ME, Games D, Seubert P, Schenk D, Hyman BT. Non-Fc-mediated mechanisms are involved in clearance of amyloid-beta in vivo by immunotherapy. J Neurosci. 2002;22:7873–7878. doi: 10.1523/JNEUROSCI.22-18-07873.2002. [DOI] [PMC free article] [PubMed] [Google Scholar]
- Benzing WC, Mufson EJ, Armstrong DM. Alzheimer’s disease-like dystrophic neurites characteristically associated with senile plaques are not found within other neurodegenerative diseases unless amyloid beta-protein deposition is present. Brain Res. 1993;606:10–18. doi: 10.1016/0006-8993(93)91563-8. [DOI] [PubMed] [Google Scholar]
- Berezovska O, Frosch M, McLean P, Knowles R, Koo E, Kang D, Shen J, Lu FM, Lux SE, Tonegawa S, Hyman BT. The Alzheimer-related gene presenilin 1 facilitates notch 1 in primary mammalian neurons. Brain Res Mol Brain Res. 1999;69:273–280. doi: 10.1016/s0169-328x(99)00119-9. [DOI] [PubMed] [Google Scholar]
- Boncristiano S, Calhoun ME, Howard V, Bondolfi L, Kaeser SA, Wiederhold KH, Staufenbiel M, Jucker M. Neocortical synaptic bouton number is maintained despite robust amyloid deposition in APP23 transgenic mice. Neurobiol Aging. 2005;26:607–613. doi: 10.1016/j.neurobiolaging.2004.06.010. [DOI] [PubMed] [Google Scholar]
- Brendza RP, Simmons K, Bales KR, Paul SM, Goldberg MP, Holtzman DM. Use of YFP to study amyloid-beta associated neurite alterations in live brain slices. Neurobiol Aging. 2003a;24:1071–1077. doi: 10.1016/j.neurobiolaging.2003.04.008. [DOI] [PubMed] [Google Scholar]
- Brendza RP, O’Brien C, Simmons K, McKeel DW, Bales KR, Paul SM, Olney JW, Sanes JR, Holtzman DM. PDAPP; YFP double transgenic mice: a tool to study amyloid-beta associated changes in axonal, dendritic, and synaptic structures. J Comp Neurol. 2003b;456:375–383. doi: 10.1002/cne.10536. [DOI] [PubMed] [Google Scholar]
- Brendza RP, Bacskai BJ, Cirrito JR, Simmons KA, Skoch JM, Klunk WE, Mathis CA, Bales KR, Paul SM, Hyman BT, Holtzman DM. Anti-Abeta antibody treatment promotes the rapid recovery of amyloid-associated neuritic dystrophy in PDAPP transgenic mice. J Clin Invest. 2005;115:428–433. doi: 10.1172/JCI23269. [DOI] [PMC free article] [PubMed] [Google Scholar]
- Catala I, Ferrer I, Galofre E, Fabregues I. Decreased numbers of dendritic spines on cortical pyramidal neurons in dementia. A quantitative Golgi study on biopsy samples. Hum Neurobiol. 1988;6:255–259. [PubMed] [Google Scholar]
- Chow N, Cox C, Callahan LM, Weimer JM, Guo L, Coleman PD. Expression profiles of multiple genes in single neurons of Alzheimer’s disease. Proc Natl Acad Sci U S A. 1998;95:9620–9625. doi: 10.1073/pnas.95.16.9620. [DOI] [PMC free article] [PubMed] [Google Scholar]
- Coleman PD, Yao PJ. Synaptic slaughter in Alzheimer’s disease. Neurobiol Aging. 2003;24:1023–1027. doi: 10.1016/j.neurobiolaging.2003.09.001. [DOI] [PubMed] [Google Scholar]
- D’Amore JD, Kajdasz ST, McLellan ME, Bacskai BJ, Stern EA, Hyman BT. In vivo multiphoton imaging of a transgenic mouse model of Alzheimer disease reveals marked thioflavine-S-associated alterations in neurite trajectories. J Neuropathol Exp Neurol. 2003;62:137–145. doi: 10.1093/jnen/62.2.137. [DOI] [PubMed] [Google Scholar]
- Davies CA, Mann DM, Sumpter PQ, Yates PO. A quantitative morphometric analysis of the neuronal and synaptic content of the frontal and temporal cortex in patients with Alzheimer’s disease. J Neurol Sci. 1987;78:151–164. doi: 10.1016/0022-510x(87)90057-8. [DOI] [PubMed] [Google Scholar]
- de Ruiter JP, Uylings HB. Morphometric and dendritic analysis of fascia dentata granule cells in human aging and senile dementia. Brain Res. 1987;402:217–229. doi: 10.1016/0006-8993(87)90028-x. [DOI] [PubMed] [Google Scholar]
- DeKosky ST, Scheff SW. Synapse loss in frontal cortex biopsies in Alzheimer’s disease: correlation with cognitive severity. Ann Neurol. 1990;27:457–464. doi: 10.1002/ana.410270502. [DOI] [PubMed] [Google Scholar]
- DeKosky ST, Scheff SW, Styren SD. Structural correlates of cognition in dementia: quantification and assessment of synapse change. Neurodegeneration. 1996;5:417–421. doi: 10.1006/neur.1996.0056. [DOI] [PubMed] [Google Scholar]
- Dickey CA, Loring JF, Montgomery J, Gordon MN, Eastman PS, Morgan D. Selectively reduced expression of synaptic plasticity-related genes in amyloid precursor protein + presenilin-1 transgenic mice. J Neurosci. 2003;23:5219–5226. doi: 10.1523/JNEUROSCI.23-12-05219.2003. [DOI] [PMC free article] [PubMed] [Google Scholar]
- Dirks W, Wirth M, Hauser H. Dicistronic transcription units for gene expression in mammalian cells. Gene. 1993;128:247–249. doi: 10.1016/0378-1119(93)90569-o. [DOI] [PubMed] [Google Scholar]
- Donello JE, Loeb JE, Hope TJ. Woodchuck hepatitis virus contains a tripartite posttranscriptional regulatory element. J Virol. 1998;72:5085–5092. doi: 10.1128/jvi.72.6.5085-5092.1998. [DOI] [PMC free article] [PubMed] [Google Scholar]
- El Khoury J, Hickman SE, Thomas CA, Loike JD, Silverstein SC. Microglia, scavenger receptors, and the pathogenesis of Alzheimer’s disease. Neurobiol Aging. 1998;19:S81–84. doi: 10.1016/s0197-4580(98)00036-0. [DOI] [PubMed] [Google Scholar]
- Fiala JC, Spacek J, Harris KM. Dendritic spine pathology: cause or consequence of neurological disorders? Brain Res Brain Res Rev. 2002;39:29–54. doi: 10.1016/s0165-0173(02)00158-3. [DOI] [PubMed] [Google Scholar]
- Games D, Adams D, Alessandrini R, Barbour R, Berthelette P, Blackwell C, Carr T, Clemens J, Donaldson T, Gillespie F, et al. Alzheimer-type neuropathology in transgenic mice overexpressing V717F beta-amyloid precursor protein. Nature. 1995;373:523–527. doi: 10.1038/373523a0. [DOI] [PubMed] [Google Scholar]
- Gomez-Isla T, Price JL, McKeel DW, Jr., Morris JC, Growdon JH, Hyman BT. Profound loss of layer II entorhinal cortex neurons occurs in very mild Alzheimer’s disease. J Neurosci. 1996;16:4491–4500. doi: 10.1523/JNEUROSCI.16-14-04491.1996. [DOI] [PMC free article] [PubMed] [Google Scholar]
- Hardy J, Selkoe DJ. The amyloid hypothesis of Alzheimer’s disease: progress and problems on the road to therapeutics. Science. 2002;297:353–356. doi: 10.1126/science.1072994. [DOI] [PubMed] [Google Scholar]
- Holthoff K, Tsay D, Yuste R. Calcium dynamics of spines depend on their dendritic location. Neuron. 2002;33:425–437. doi: 10.1016/s0896-6273(02)00576-7. [DOI] [PubMed] [Google Scholar]
- Holtmaat AJ, Trachtenberg JT, Wilbrecht L, Shepherd GM, Zhang X, Knott GW, Svoboda K. Transient and persistent dendritic spines in the neocortex in vivo. Neuron. 2005;45:279–291. doi: 10.1016/j.neuron.2005.01.003. [DOI] [PubMed] [Google Scholar]
- Hsiao K, Chapman P, Nilsen S, Eckman C, Harigaya Y, Younkin S, Yang F, Cole G. Correlative memory deficits, Abeta elevation, and amyloid plaques in transgenic mice. Science. 1996;274:99–102. doi: 10.1126/science.274.5284.99. [DOI] [PubMed] [Google Scholar]
- Ingelsson M, Fukumoto H, Newell KL, Growdon JH, Hedley-Whyte ET, Frosch MP, Albert MS, Hyman BT, Irizarry MC. Early Abeta accumulation and progressive synaptic loss, gliosis, and tangle formation in AD brain. Neurology. 2004;62:925–931. doi: 10.1212/01.wnl.0000115115.98960.37. [DOI] [PubMed] [Google Scholar]
- Irizarry MC, McNamara M, Fedorchak K, Hsiao K, Hyman BT. APPSw transgenic mice develop age-related A beta deposits and neuropil abnormalities, but no neuronal loss in CA1. J Neuropathol Exp Neurol. 1997a;56:965–973. doi: 10.1097/00005072-199709000-00002. [DOI] [PubMed] [Google Scholar]
- Irizarry MC, Soriano F, McNamara M, Page KJ, Schenk D, Games D, Hyman BT. Abeta deposition is associated with neuropil changes, but not with overt neuronal loss in the human amyloid precursor protein V717F (PDAPP) transgenic mouse. J Neurosci. 1997b;17:7053–7059. doi: 10.1523/JNEUROSCI.17-18-07053.1997. [DOI] [PMC free article] [PubMed] [Google Scholar]
- King DL, Arendash GW. Maintained synaptophysin immunoreactivity in Tg2576 transgenic mice during aging: correlations with cognitive impairment. Brain Res. 2002;926:58–68. doi: 10.1016/s0006-8993(01)03294-2. [DOI] [PubMed] [Google Scholar]
- Klunk WE, Bacskai BJ, Mathis CA, Kajdasz ST, McLellan ME, Frosch MP, Debnath ML, Holt DP, Wang Y, Hyman BT. Imaging Abeta plaques in living transgenic mice with multiphoton microscopy and methoxy-X04, a systemically administered Congo red derivative. J Neuropathol Exp Neurol. 2002;61:797–805. doi: 10.1093/jnen/61.9.797. [DOI] [PubMed] [Google Scholar]
- Knowles RB, Gomez-Isla T, Hyman BT. Abeta associated neuropil changes: correlation with neuronal loss and dementia. J Neuropathol Exp Neurol. 1998;57:1122–1130. doi: 10.1097/00005072-199812000-00003. [DOI] [PubMed] [Google Scholar]
- Knowles RB, Wyart C, Buldyrev SV, Cruz L, Urbanc B, Hasselmo ME, Stanley HE, Hyman BT. Plaque-induced neurite abnormalities: implications for disruption of neural networks in Alzheimer’s disease. Proc Natl Acad Sci U S A. 1999;96:5274–5279. doi: 10.1073/pnas.96.9.5274. [DOI] [PMC free article] [PubMed] [Google Scholar]
- Lanz TA, Carter DB, Merchant KM. Dendritic spine loss in the hippocampus of young PDAPP and Tg2576 mice and its prevention by the ApoE2 genotype. Neurobiol Dis. 2003;13:246–253. doi: 10.1016/s0969-9961(03)00079-2. [DOI] [PubMed] [Google Scholar]
- Le R, Cruz L, Urbanc B, Knowles RB, Hsiao-Ashe K, Duff K, Irizarry MC, Stanley HE, Hyman BT. Plaque-induced abnormalities in neurite geometry in transgenic models of Alzheimer disease: implications for neural system disruption. J Neuropathol Exp Neurol. 2001;60:753–758. doi: 10.1093/jnen/60.8.753. [DOI] [PubMed] [Google Scholar]
- Lombardo JA, Stern EA, McLellan ME, Kajdasz ST, Hickey GA, Bacskai BJ, Hyman BT. Amyloid-beta antibody treatment leads to rapid normalization of plaque-induced neuritic alterations. J Neurosci. 2003;23:10879–10883. doi: 10.1523/JNEUROSCI.23-34-10879.2003. [DOI] [PMC free article] [PubMed] [Google Scholar]
- Masliah E, Sisk A, Mallory M, Mucke L, Schenk D, Games D. Comparison of neurodegenerative pathology in transgenic mice overexpressing V717F beta-amyloid precursor protein and Alzheimer’s disease. J Neurosci. 1996;16:5795–5811. doi: 10.1523/JNEUROSCI.16-18-05795.1996. [DOI] [PMC free article] [PubMed] [Google Scholar]
- Masliah E, Mallory M, Alford M, DeTeresa R, Hansen LA, McKeel DW, Jr., Morris JC. Altered expression of synaptic proteins occurs early during progression of Alzheimer’s disease. Neurology. 2001;56:127–129. doi: 10.1212/wnl.56.1.127. [DOI] [PubMed] [Google Scholar]
- McLellan ME, Kajdasz ST, Hyman BT, Bacskai BJ. In vivo imaging of reactive oxygen species specifically associated with thioflavine S-positive amyloid plaques by multiphoton microscopy. J Neurosci. 2003;23:2212–2217. doi: 10.1523/JNEUROSCI.23-06-02212.2003. [DOI] [PMC free article] [PubMed] [Google Scholar]
- Moolman DL, Vitolo OV, Vonsattel JP, Shelanski ML. Dendrite and dendritic spine alterations in alzheimer models. J Neurocytol. 2004;33:377–387. doi: 10.1023/B:NEUR.0000044197.83514.64. [DOI] [PubMed] [Google Scholar]
- Nimchinsky EA, Sabatini BL, Svoboda K. Structure and function of dendritic spines. Annu Rev Physiol. 2002;64:313–353. doi: 10.1146/annurev.physiol.64.081501.160008. [DOI] [PubMed] [Google Scholar]
- Niwa H, Yamamura K, Miyazaki J. Efficient selection for high-expression transfectants with a novel eukaryotic vector. Gene. 1991;108:193–199. doi: 10.1016/0378-1119(91)90434-d. [DOI] [PubMed] [Google Scholar]
- Probst A, Basler V, Bron B, Ulrich J. Neuritic plaques in senile dementia of Alzheimer type: a Golgi analysis in the hippocampal region. Brain Res. 1983;268:249–254. doi: 10.1016/0006-8993(83)90490-0. [DOI] [PubMed] [Google Scholar]
- Scheff SW, Price DA. Synaptic pathology in Alzheimer’s disease: a review of ultrastructural studies. Neurobiol Aging. 2003;24:1029–1046. doi: 10.1016/j.neurobiolaging.2003.08.002. [DOI] [PubMed] [Google Scholar]
- Scheff SW, DeKosky ST, Price DA. Quantitative assessment of cortical synaptic density in Alzheimer’s disease. Neurobiol Aging. 1990;11:29–37. doi: 10.1016/0197-4580(90)90059-9. [DOI] [PubMed] [Google Scholar]
- Scheff SW, Sparks DL, Price DA. Quantitative assessment of synaptic density in the outer molecular layer of the hippocampal dentate gyrus in Alzheimer’s disease. Dementia. 1996;7:226–232. doi: 10.1159/000106884. [DOI] [PubMed] [Google Scholar]
- Segal M. Changing views of Cajal’s neuron: the case of the dendritic spine. Prog Brain Res. 2002;136:101–107. doi: 10.1016/s0079-6123(02)36011-4. [DOI] [PubMed] [Google Scholar]
- Skoch J, Hickey GA, Kajdasz ST, Hyman BT, Bacskai BJ. In vivo imaging of amyloid-beta deposits in mouse brain with multiphoton microscopy. In: Sigurdsson EM, editor. Amyloid proteins: methods and protocols. Humana Press; Totowa: 2004. pp. 349–364. [DOI] [PubMed] [Google Scholar]
- Sorra KE, Harris KM. Overview on the structure, composition, function, development, and plasticity of hippocampal dendritic spines. Hippocampus. 2000;10:501–511. doi: 10.1002/1098-1063(2000)10:5<501::AID-HIPO1>3.0.CO;2-T. [DOI] [PubMed] [Google Scholar]
- Spires TL, Hyman BT. Neuronal structure is altered by amyloid plaques. Rev Neurosci. 2004;15:267–278. doi: 10.1515/revneuro.2004.15.4.267. [DOI] [PubMed] [Google Scholar]
- Spires TL, Molnar Z, Kind PC, Cordery PM, Upton AL, Blakemore C, Hannan AJ. Activity-dependent regulation of synapse and dendritic spine morphology in developing barrel cortex requires phospholipase C-beta1 signalling. Cereb Cortex. 2005;15:385–393. doi: 10.1093/cercor/bhh141. [DOI] [PubMed] [Google Scholar]
- Stern EA, Bacskai BJ, Hickey GA, Attenello FJ, Lombardo JA, Hyman BT. Cortical synaptic integration in vivo is disrupted by amyloid-beta plaques. J Neurosci. 2004;24:4535–4540. doi: 10.1523/JNEUROSCI.0462-04.2004. [DOI] [PMC free article] [PubMed] [Google Scholar]
- Stokin GB, Lillo C, Falzone TL, Brusch RG, Rockenstein E, Mount SL, Raman R, Davies P, Masliah E, Williams DS, Goldstein LS. Axonopathy and transport deficits early in the pathogenesis of Alzheimer’s disease. Science. 2005;307:1282–1288. doi: 10.1126/science.1105681. [DOI] [PubMed] [Google Scholar]
- Su JH, Cummings BJ, Cotman CW. Identification and distribution of axonal dystrophic neurites in Alzheimer’s disease. Brain Res. 1993;625:228–237. doi: 10.1016/0006-8993(93)91063-x. [DOI] [PubMed] [Google Scholar]
- Takeuchi A, Irizarry MC, Duff K, Saido TC, Hsiao Ashe K, Hasegawa M, Mann DM, Hyman BT, Iwatsubo T. Age-related amyloid beta deposition in transgenic mice overexpressing both Alzheimer mutant presenilin 1 and amyloid beta precursor protein Swedish mutant is not associated with global neuronal loss. Am J Pathol. 2000;157:331–339. doi: 10.1016/s0002-9440(10)64544-0. [DOI] [PMC free article] [PubMed] [Google Scholar]
- Terry RD, Masliah E, Salmon DP, Butters N, DeTeresa R, Hill R, Hansen LA, Katzman R. Physical basis of cognitive alterations in Alzheimer’s disease: synapse loss is the major correlate of cognitive impairment. Ann Neurol. 1991;30:572–580. doi: 10.1002/ana.410300410. [DOI] [PubMed] [Google Scholar]
- Teter B, Ashford JW. Neuroplasticity in Alzheimer’s disease. J Neurosci Res. 2002;70:402–437. doi: 10.1002/jnr.10441. [DOI] [PubMed] [Google Scholar]
- Tsai J, Grutzendler J, Duff K, Gan WB. Fibrillar amyloid deposition leads to local synaptic abnormalities and breakage of neuronal branches. Nat Neurosci. 2004;7:1181–1183. doi: 10.1038/nn1335. [DOI] [PubMed] [Google Scholar]
- Urbanc B, Cruz L, Le R, Sanders J, Ashe KH, Duff K, Stanley HE, Irizarry MC, Hyman BT. Neurotoxic effects of thioflavin S-positive amyloid deposits in transgenic mice and Alzheimer’s disease. Proc Natl Acad Sci U S A. 2002;99:13990–13995. doi: 10.1073/pnas.222433299. [DOI] [PMC free article] [PubMed] [Google Scholar]
- Walsh DM, Klyubin I, Fadeeva JV, Rowan MJ, Selkoe DJ. Amyloid-beta oligomers: their production, toxicity and therapeutic inhibition. Biochem Soc Trans. 2002a;30:552–557. doi: 10.1042/bst0300552. [DOI] [PubMed] [Google Scholar]
- Walsh DM, Klyubin I, Fadeeva JV, Cullen WK, Anwyl R, Wolfe MS, Rowan MJ, Selkoe DJ. Naturally secreted oligomers of amyloid beta protein potently inhibit hippocampal long-term potentiation in vivo. Nature. 2002b;416:535–539. doi: 10.1038/416535a. [DOI] [PubMed] [Google Scholar]
- Yao PJ, Zhu M, Pyun EI, Brooks AI, Therianos S, Meyers VE, Coleman PD. Defects in expression of genes related to synaptic vesicle trafficking in frontal cortex of Alzheimer’s disease. Neurobiol Dis. 2003;12:97–109. doi: 10.1016/s0969-9961(02)00009-8. [DOI] [PubMed] [Google Scholar]
- Zolotukhin S, Byrne BJ, Mason E, Zolotukhin I, Potter M, Chesnut K, Summerford C, Samulski RJ, Muzyczka N. Recombinant adeno-associated virus purification using novel methods improves infectious titer and yield. Gene Ther. 1999;6:973–985. doi: 10.1038/sj.gt.3300938. [DOI] [PubMed] [Google Scholar]