

Abstract
Background:
The optimal approach to screening and diagnosis of prediabetes and diabetes in children and adolescents is uncertain.
Methods:
We conducted a cross-sectional analysis of 14,119 youth aged 10–19 years in the 1999–2016 National Health and Nutrition Examination Survey (NHANES). First, we examined the performance of ADA risk-based screening criteria for identifying prediabetes and diabetes in the population. Second, we evaluated the performance of current clinical definitions of prediabetes and diabetes based on elevated hemoglobin A1c (HbA1c), elevated fasting glucose (FPG), either HbA1c or FPG elevated, or both HbA1c and FPG elevated (confirmatory definition) to identify youth at high cardiometabolic risk.
Results:
Overall, 25.5% of US youth (10.6 million in 2016) were eligible for diabetes screening. Sensitivity and specificity of the screening criteria for detecting any hyperglycemia were low for both HbA1c ≥5.7% (sensitivity = 55.5%, specificity = 76.3%) and FPG ≥100 mg/dL (sensitivity = 35.8%, specificity = 77.1%). Confirmed undiagnosed diabetes (HbA1c ≥6.5% and FPG ≥126 mg/dL) was rare, <0.5% of youth. Most (>85%) of cases of diabetes in youth were diagnosed. Associations with cardiometabolic risk were consistently stronger and more specific for HbA1c-defined prediabetes (specificity = 98.6%; sensitivity = 4.0%) compared to FPG-defined prediabetes (specificity = 90.1%; sensitivity = 19.4%).
Conclusions:
A large number of children and adolescents are eligible for screening for diabetes and prediabetes; however, few will test positive, especially for diabetes. Most cases of diabetes in US youth have been diagnosed. Regardless of screening eligibility, we found that HbA1c is a specific and useful non-fasting test to identify high-risk youth who could benefit from lifestyle interventions to prevent diabetes and cardiovascular risk in adulthood.
Table of Contents Summary
This study evaluates the performance of current American Diabetes Association screening and diagnostic criteria to identify prediabetes and type 2 diabetes in youth.
INTRODUCTION
Childhood obesity in the US has increased dramatically since the late 1980s, with corresponding increases in prediabetes and type 2 diabetes mellitus1,2,3. While there is limited evidence on the long-term effects of hyperglycemia in children4, studies in adults have shown that earlier onset of diabetes and longer duration of the disease are associated with worse outcomes5. Evidence from adults demonstrates that early interventions can delay or prevent complications6. There is evidence that intensive lifestyle modification in obese children with prediabetes can improve markers of insulin resistance7.
In 2000, the American Diabetes Association (ADA) and American Academy of Pediatrics (AAP) first recommended8 general screening for type 2 diabetes in asymptomatic youth ages 10 and older (or after onset of puberty). Until 2018, these recommendations were to screen only in high-risk youth, defined as being overweight and with at least 2 of the following risk factors: non-white race, family history of type 2 diabetes, maternal gestational diabetes, or signs of insulin resistance. Beginning in 20189, the ADA expanded this recommendation to include all overweight youth with any one or more of these risk factors. The implications of this change are uncharacterized; it is unknown how many US children and adolescents are eligible for screening by these new guidelines.
Among those who are eligible for screening, there are multiple criteria used to define diabetes and prediabetes in clinical practice. It is unclear which approach might be optimal in children and adolescents. Hemoglobin A1c (HbA1c), fasting plasma glucose (FPG), and 2-hour plasma glucose (2hPG) are all recommended for screening for diabetes in youth and adults10. The three tests do not always identify the same subpopulations, particularly in younger age groups11. The use of HbA1c in pediatric populations is particularly controversial12,13, with at least one major guideline organization recommending against its use in children and adolescents14.
Our objectives were to evaluate the performance of current ADA guidelines for screening of diabetes and prediabetes in youth and characterize the performance of clinical definitions of prediabetes and diabetes based on HbA1c and/or fasting glucose to identify US children and adolescents at high cardiometabolic risk.
METHODS
Study Population
The National Health and Nutrition Examination Survey (NHANES) is a cross-sectional, nationally representative sample of the civilian noninstitutionalized US population conducted by the National Center for Health Statistics (NCHS) of the Centers for Disease Control and Prevention (CDC). The surveys, which have been conducted in 2-year cycles since 1999, consist of interviews and standardized physical exams in-home and at a mobile examination center, including laboratory tests. The health questionnaires are answered by an adult proxy for children under age 16. A random subsample of participants ages 12 and older who attended the morning exam and are asked to fast the night before. Detailed information on the protocols and procedures for NHANES are available elsewhere15.
All protocols for NHANES were approved by the research ethics board of the NCHS. Written informed consent was obtained from all participants or their parents/guardians if <18 years old.
We combined data from nine cycles (1999–2016) of NHANES. For estimates of screening eligibility (full sample), we included the population for whom the ADA guidelines would be applicable. There were 19,714 children and adolescents ages 10–19 years who attended the medical examination session. There were 94 individuals aged 10–19 with diagnosed diabetes who were excluded from our main analyses. We also excluded individuals missing HbA1c (N=5,051), leaving us with a sample of 14,119 youths. For analyses incorporating any of the fasting laboratory tests (plasma glucose, triglycerides, or low-density lipoprotein (LDL)-cholesterol), we were limited to the random subsample of participants ages 12–19 without diagnosed diabetes who attended the morning fasting exam (N = 7,426). Of these, we excluded participants who fasted for less than 9 hours (N=839) who were missing data on glucose (N=352) or HbA1c (N=10). This left us with 6,225 participants in the fasting subsample.
Diabetes and Prediabetes Screening Criteria
Current ADA guidelines recommend screening for type 2 diabetes of prediabetes in all asymptomatic children and adolescents ages 10 and older (or after the onset of puberty) who are overweight or obese who have at least one of the following risk factor for diabetes: maternal history of gestational diabetes during the child’s gestation; family history of type 2 diabetes in first or second degree relatives; Native American, African American, Latino, Asian American, or Pacific Islander race/ethnicity; or signs of insulin resistance or conditions associated with insulin resistance, specifically acanthosis nigricans, hypertension, dyslipidemia, polycystic ovarian syndrome, or small-for-gestational-age birth weight10
Based on the available data in NHANES, we used the following risk factors to determine eligibility for screening: (1) non-white race/ethnicity, (2) self-report of being told by a health professional that the participant had medical or family history that put them at increased risk for diabetes, or (3) hypertension (systolic (SBP) or diastolic blood pressure (DBP) ≥ 95th percentile for age, sex, and height (ages 10–12) or SBP ≥ 130 mmHg or DBP ≥ 80 mmHg (ages 13–19))16 or dyslipidemia (total cholesterol ≥ 200 mg/dL, LDL-cholesterol ≥ 130 mg/dL, triglycerides ≥ 130 mg/dL, or high-density lipoprotein (HDL)-cholesterol < 40 mg/dL)17. Screening eligibility was defined as being overweight or obese (body mass index (BMI) ≥ 85th percentile for age and sex, based on CDC growth charts18) and having at least one of the three risk factors for diabetes.
Definitions of Undiagnosed Diabetes and Prediabetes
We evaluated the performance of current clinically used definitions of prediabetes and undiagnosed diabetes to identify youth at high cardiometabolic risk. We considered four definitions of prediabetes: HbA1c 5.7%−6.4%, fasting glucose 100–125 mg/dL, elevations in either test, or elevations in both tests. We evaluated four definitions for undiagnosed diabetes: HbA1c ≥ 6.5%, as fasting glucose ≥126 mg/dL, elevations in either test, or elevations in both tests. Since the number of adolescents with undiagnosed diabetes was small, we also evaluated total hyperglycemia (prediabetes plus undiagnosed diabetes), defined as HbA1c ≥ 5.7%, fasting glucose ≥100 mg/dL, elevations in either test, or elevations in both tests.
To account for changes in laboratory methods over the study period, plasma glucose measurements were calibrated using regression equations recommended by the NCHS15 and HbA1c measurements were calibrated using an equipercentile equating approach19.
Cardiometabolic Risk
We evaluated the metabolic syndrome and its components to characterize cardiometabolic risk in this population of children and adolescents. To define high cardiometabolic risk, we used a modification of the pediatric International Diabetes Federation definition of the metabolic syndrome20: waist circumference ≥ 90th percentile for age, sex and ethnicity, and one of (1) triglycerides ≥ 150 mg/dL, (2) HDL-C <40 mg/dL (HDL-C <50 mg/dL for girls 16–19), or (3) systolic blood pressure ≥ 130 mmHg or diastolic blood pressure ≥ 85 mmHg.
Statistical Analyses
We calculated the percentage of US youths without diagnosed diabetes who were eligible for screening by current ADA criteria and used US Census counts from 2016 to estimate the number of US children and adolescents. We then calculated the percentage of US youth who met each definition of prediabetes and undiagnosed diabetes, according to screening eligibility and calculated the sensitivity, specificity, positive predictive value (PPV), and negative predictive value (NPV) of the screening criteria to identify youth with undiagnosed diabetes or prediabetes in the population.
We evaluated the prevalence of cardiometabolic risk factors, comparing those with and without prediabetes or diabetes according to each clinical definition. We used multivariable logistic regression to estimate the age-sex-race-adjusted prevalence odds ratios (ORs) for the associations of definitions of hyperglycemia with each risk factor. We also calculated the sensitivity, specificity, PPV, and NPV to evaluate the performance of each definition to identify youth at high cardiometabolic risk based on metabolic syndrome criteria.
All statistical analyses were conducted using survey estimation procedures and sampling weights recommended by the NCHS to account for the complex sample design and non-response15. Analyses were performed in 2019 using Stata version 15.0 and the svy suite of commands (StataCorp, College Station, TX). P-values <0.05 were considered statistically significant, and all tests were two sided. Estimates with poor precision (SE >30% of the estimate) were not reported.
RESULTS
Approximately one-quarter of US children and adolescents, 10.6 million in 2016, were overweight or obese and had at least one risk factor for diabetes, making them eligible for screening for diabetes by the 2018 criteria (Table 1). In comparison, less than 10% of US children and adolescents, 3.6 million in 2016, would have been eligible for screening by the pre-2018 criteria. Undiagnosed diabetes was uncommon, regardless of screening eligibility (2018 criteria) or the definition of diabetes used. Unconfirmed cases of undiagnosed diabetes defined by a single HbA1c ≥ 6.5%, were seen in 0.3% (95% CI: 0.1–0.5%) of screening eligible youth and <0.1% in non-screening eligible youth. The prevalence of undiagnosed diabetes using a single elevated FPG, the clinical confirmatory definition (both tests elevated), and prevalence by all definitions in the non-screening eligible population, were too small to estimate with precision. Diagnosed diabetes was seen in 0.5% (95% CI: 0.4–0.7%) of youth (0.2 million), equating to more than 85% of total diabetes cases.
Table 1.
Prevalence of prediabetes and undiagnosed diabetes by screening eligibility in US children and adolescents aged 10 to 19 years, NHANES 1999–2016
| Screen Eligible Weighted % = 25.5% US Pop N. = 10.5 M |
Not Screen Eligible Weighted % = 74.5% US Pop N. = 31.1 M |
Diagnostic Performance of Screening | ||||||||
|---|---|---|---|---|---|---|---|---|---|---|
| Unweighted N | Weighted % (95% CI) | US Pop. N (millions) | Unweighted N | Weighted % (95% CI) | US Pop. N (millions) | Sensitivity | Specificity | PPV | NPV | |
| Diagnosed Diabetes* | - | - | - | 94 | 0.5% (0.4–0.7%) | 0.2 | ||||
| Undiagnosed Diabetes | ||||||||||
| HbA1c ≥6.5%† | 17 | 0.3% (0.1–0.5%) | 0.03 | 4 | <0.1%§ | –§ | 85.7% (71.0%, 100%) | 74.6% (73.4%, 75.8%) | 0.3% | ~100% |
| HbA1c ≥6.5%‡ | 7 | <0.5%§ | –§ | 1 | <0.1%§ | –§ | 90.7% (72.5%, 100%) | 75.8% (74.2%, 77.4%) | 0.4% | ~100% |
| FPG ≥126 mg/dL‡ | 8 | <0.5%§ | –§ | 4 | <0.1%§ | –§ | 78.4% (55.1%, 100%) | 75.8% (74.2%, 77.4%) | 0.5% | ~100% |
| Either‡ | 9 | <0.5%§ | –§ | 4 | <0.1%§ | –§ | 78.7% (55.8%, 100%) | 75.8% (74.2%, 77.4%) | 0.5% | ~100% |
| Both‡ | 6 | <0.5%§ | –§ | 1 | <0.1%§ | –§ | 90.5% (71.9%, 100%) | 75.8% (74.2%, 77.4%) | 0.4% | ~100% |
| Prediabetes | ||||||||||
| HbA1c 5.7–6.4%† | 226 | 3.8% (3.1–4.5%) | 0.4 | 166 | 1.1% (0.9–1.3%) | 0.3 | 54.5% (47.3%, 61.7%) | 75.1% (73.9%, 76.3%) | 3.8% (3.1%, 4.5%) | 98.9% (98.7%, 99.1%) |
| HbA1c 5.7–6.4%‡ | 84 | 3.4% (2.3–4.6%) | 0.3 | 70 | 1.0% (0.7–1.3%) | 0.2 | 53.2% (41.8%, 64.5%) | 76.3% (74.7%, 77.8%) | 3.4% (2.3%, 4.6%) | 99.0% (98.7%, 99.3%) |
| FPG 100–125 mg/dL‡ | 300 | 15.6% (13.0–18.3%) | 1.3 | 401 | 9.2% (7.8–10.5%) | 2.3 | 35.2% (29.6%, 40.9%) | 77.1% (75.6%, 78.7%) | 15.6% (13.0%, 18.3%) | 90.8% (89.5%, 92.2%) |
| Either‡ | 350 | 17.5% (14.7–20.4%) | 1.4 | 458 | 9.9% (8.6–11.3%) | 2.5 | 36.0% (30.6%, 41.5%) | 77.4% (75.9%, 78.9%) | 17.5% (14.7%, 20.4%) | 90.1% (88.7%, 91.4%) |
| Both‡ | 34 | 1.5% (0.8–2.2%) | 0.1 | 13 | <0.5%§ | –§ | 71.1% (54.1%, 88.0%) | 76.0% (74.5%, 77.6%) | 1.5% (0.8%, 2.2%) | ~100% |
| Total Hyperglycemia (prediabetes or undiagnosed diabetes) | ||||||||||
| HbA1c ≥5.7% (full sample)† | 243 | 4.1% (3.4–4.9%) | 0.4 | 170 | 1.1% (0.9–1.3%) | 0.3 | 56.2% (49.2%, 63.2%) | 75.1% (73.9%, 76.3%) | 4.1% (3.4%, 4.9%) | 98.9% (98.7%, 99.1%) |
| HbA1c ≥5.7%‡ | 91 | 3.8% (2.7–5.0%) | 0.3 | 71 | 1.0% (0.7–1.3%) | 0.2 | 55.5% (44.7%, 66.3%) | 76.3% (74.7%, 77.8%) | 3.8% (2.7%, 5.0%) | 99% (98.7%, 99.3%) |
| FPG ≥100 mg/dL‡ | 308 | 16.0% (13.4–18.6%) | 1.3 | 405 | 9.2% (7.9–10.6%) | 2.3 | 35.8% (30.2%, 41.5%) | 77.1% (75.6%, 78.7%) | 16.0% (13.4%, 18.6%) | 90.8% (89.4%, 92.1%) |
| Either‡ | 359 | 17.9% (15.1–20.8%) | 1.5 | 461 | 10.0% (8.6–11.3%) | 2.5 | 36.6% (31.2%, 42%) | 77.4% (75.9%, 78.9%) | 17.9% (15.1%, 20.8%) | 90.0% (88.7%, 91.4%) |
| Both‡ | 40 | 1.9% (1.1–2.7%) | 0.2 | 15 | <0.5%§ | –§ | 73.6% (59.1%, 88.1%) | 76% (74.5%, 77.6%) | 1.9% (1.1%, 2.7%) | ~100% |
Estimates based on sample of all participants ages 10–19, N=19,620
Estimates based on sample of non-diabetic participants ages 10–19 with non-missing HbA1c data, N=14,119
Estimates are based on participants ages 12–19 who attended the morning fasting exam with non-missing HbA1c and FPG data, N=6,225
Sample size was too small to estimate with precision (SE ≥ 30% of estimate).
The prevalence of prediabetes varied depending on the definition used, ranging from 1.5% to 17.5% in the screening eligible population and from <0.5% to 9.9% in the non-eligible population. Similarly, the prevalence of total hyperglycemia (prediabetes plus undiagnosed diabetes) among screen eligible youth was higher than prevalence among non-screen eligible youth, but the yield varied substantially by hyperglycemia definition. Approximately 4% of the overall screening eligible population had HbA1c-defined hyperglycemia (≥5.7%) whereas 17.9% of the screening eligible population had hyperglycemia defined by either HbA1c or FPG. However, a larger absolute number of youths not eligible for screening had FPG ≥ 100 mg/dL as compared to screen eligible youth: 2.3 million vs. 1.3 million, respectively (Figure 1).
Figure 1. Number (in millions) of US adolescents with hyperglycemia (prediabetes or undiagnosed diabetes) in 2016, by diabetes screening eligibility status.
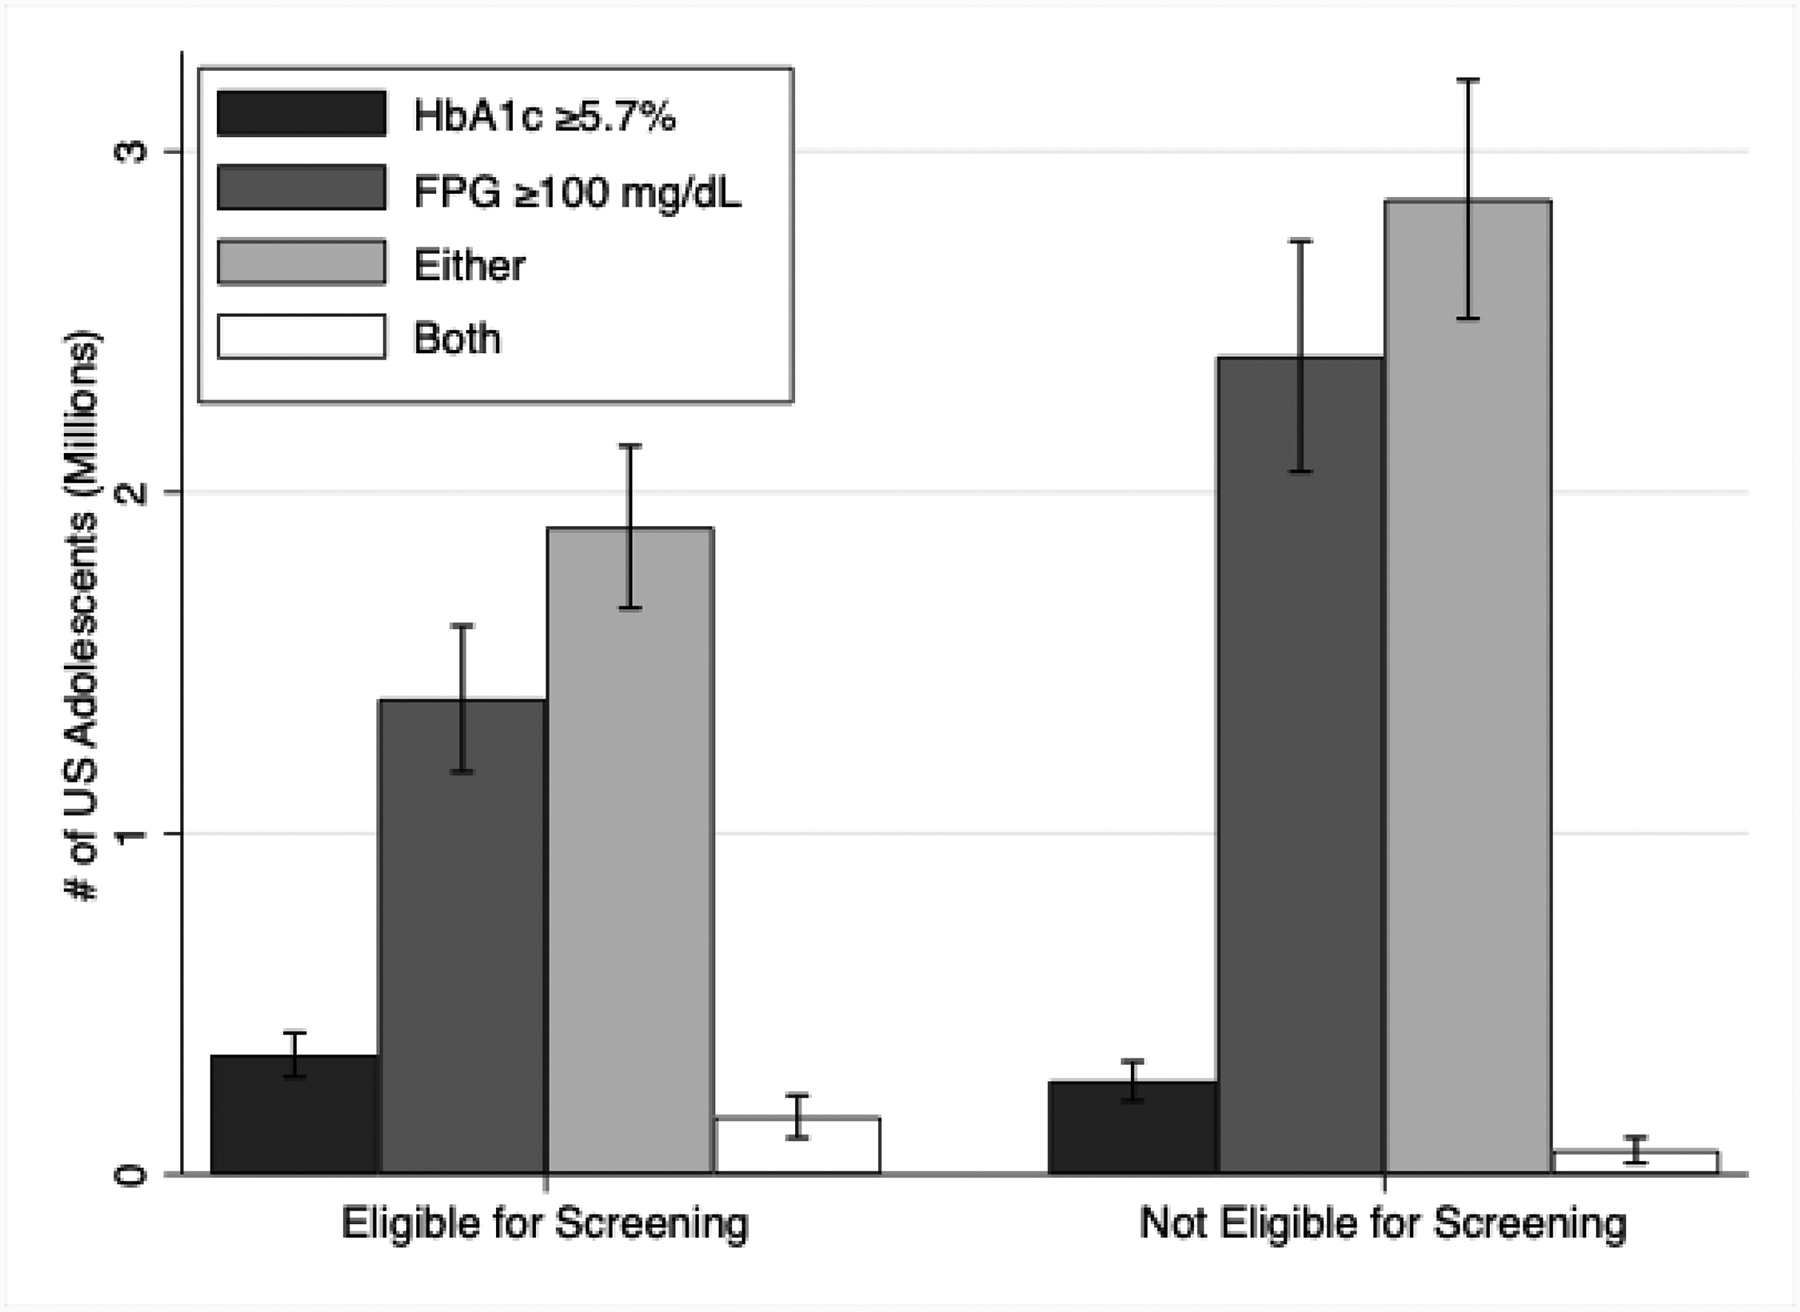
Number (in millions) of US adolescents with hyperglycemia (prediabetes or undiagnosed diabetes) in 2016, by diabetes screening eligibility status
The performance of current ADA screening criteria to identify youth with prediabetes or diabetes was poor. The sensitivity and specificity for detecting HbA1c-defined hyperglycemia (≥5.7%) were 55.5% and 76.3%, respectively; the sensitivity for detecting FPG-defined hyperglycemia (≥ 100 mg/dL) was 35.8%, and the specificity was 77.1% (Table 1).
In the total population (ignoring screening eligibility), cardiometabolic risk factors (obesity, metabolic syndrome, and hypercholesterolemia) were common in youth with hyperglycemia by either single-test definition (HbA1c ≥5.7%) or (FPG ≥100 mg/dL) (Table 2) or for the combined definition (eTable 1). However, risk factor associations were consistently stronger for HbA1c-defined hyperglycemia, with ORs ranging from 2.6 to 4.1, compared to FPG-defined hyperglycemia where ORs ranged from 1.5 to 3.0. The prevalence of obesity and abdominal obesity were higher in youth with HbA1c-defined hyperglycemia than in youth with FPG-defined hyperglycemia, 50.7% vs. 28.5% and 52.6% vs. 35.0%, respectively. Risk factor associations were strongest when hyperglycemia was defined using a confirmatory definition (HbA1c≥5.7% and FPG ≥100mg/dl) (eTable 2). Diagnostic performance of hyperglycemia definitions for detecting metabolic syndrome was more specific for HbA1c≥5.7% (specificity = 98.6%) than for FPG ≥100mg/dL (specificity = 90.1%) (Table 3), but sensitivity was higher for FPG-defined hyperglycemia (19.4%) than HbA1c-defined hyperglycemia (4.0%) (Table 3). The confirmatory definition (HbA1c≥5.7% and FPG ≥100mg/dl) had the highest specificity, 99.6%, (eTable 4), while hyperglycemia by either single-test definition had the highest sensitivity, 20.9%, (eTable 3).
Table 2.
Prevalence of cardiometabolic risk factors and odds ratios (95% confidence intervals) according to HbA1c category (<5.7% vs. ≥5.7%) and FPG category (<100 vs. ≥100mg/dL), US children and adolescents without diagnosed diabetes, NHANES 1999–2016
| HbA1c <5.7% | HbA1c ≥5.7% | Adjusted* OR (95% CI) (HbA1c ≥5.7% vs <5.7%) | FPG < 100mg/dL | FPG ≥ 100mg/dL | Adjusted* OR (95%) (FPG ≥100 vs. <100mg/dL) | |
|---|---|---|---|---|---|---|
| Obese (≥95th percentile for age/sex) | 18.5% (17.0–20.0%) | 50.7% (38.6–62.8%) | 4.1 (2.5–6.6) | 17.9% (16.4–19.5%) | 28.5% (23.2–33.8%) | 1.8 (1.4–2.4) |
| Metabolic Syndrome† | 10.6% (9.5–11.7%) | 25.7% (16.1–35.2%) | 3.5 (2.1–5.9) | 9.8% (8.7–10.8%) | 19.5% (14.9–24.2%) | 2.2 (1.6–3.0) |
| Waist Circumference ≥90th | 31.7% (29.9–33.5%) | 52.6% (40.7–64.5%) | 3.3 (1.9–5.7) | 31.7% (29.8–33.5%) | 35.0% (29.6–40.4%) | 1.6 (1.2–2.0) |
| Hypertension (≥130/≥85) | 3.6% (2.9–4.4%) | 14.4% (6.4–22.5%) | 3.5 (1.7–6.9) | 3.0% (2.2–3.7%) | 10.7% (7.1–14.3%) | 3.4 (2.2–5.5) |
| Triglycerides ≥150 mg/dL | 9.1% (8.0–10.2%) | 17.3% (7.5–27.1%) | –‡ | 8.4% (7.4–9.5%) | 15.9% (12.0–19.7%) | 2.0 (1.4–2.7) |
| HDL-cholesterol < 40mg/dL | 13.8% (12.6–15.1%) | 26.1% (15.1–37.0%) | 2.6 (1.5–4.5) | 12.9% (11.6–14.3%) | 23.1% (18.8–27.4%) | 1.8 (1.3–2.3) |
| LDL-cholesterol ≥130 mg/dL | 7.4% (6.4–8.3%) | –‡ | –‡ | 7.2% (6.2–8.1%) | 9.9% (6.4–13.4%) | –‡ |
Adjusted for age, sex and race
Metabolic syndrome is defined as waist circumference ≥90th percentile for age/sex/race and one of hypertension, hypertriglyceridemia, or hypoalphalipoproteinemia.
Sample size was too small to estimate with precision (SE ≥ 30% of estimate).
Table 3:
Diagnostic Performance of HbA1c ≥ 5.7% and FPG ≥ 100mg/dL for detecting cardiometabolic risk factors, US children and adolescents without diagnosed diabetes, NHANES 1999–2016
| HbA1c ≥5.7% | FPG ≥ 100mg/dL | |||||||
|---|---|---|---|---|---|---|---|---|
| Sensitivity | Specificity | PPV | NPV | Sensitivity | Specificity | PPV | NPV | |
| Obese (≥95th percentile for age/sex) | 4.4% (2.9%, 6%) | 99% (98.7%, 99.3%) | 50.7% (38.6%, 62.8%) | 81.5% (80%, 83%) | 16.2% (13.1%, 19.3%) | 90.4% (89.1%, 91.7%) | 28.5% (23.2%, 33.8%) | 82.1% (80.5%, 83.6%) |
| Metabolic Syndrome† | 4% (2.3%, 5.7%) | 98.6% (98.3%, 98.9%) | 25.7% (16.1%, 35.2%) | 89.4% (88.3%, 90.5%) | 19.6% (15.4%, 23.9%) | 90.2% (88.9%, 91.5%) | 19.5% (14.9%, 24.2%) | 90.2% (89.2%, 91.3%) |
| Waist Circumference ≥90th | 2.8% (1.8%, 3.7%) | 98.8% (98.5%, 99.2%) | 52.6% (40.7%, 64.5%) | 68.3% (66.5%, 70.1%) | 11.9% (9.9%, 14%) | 89.5% (88.1%, 91%) | 35% (29.6%, 40.4%) | 68.3% (66.5%, 70.2%) |
| Hypertension (≥130/≥85) | 6.2% (2.9%, 9.6%) | 98.5% (98.2%, 98.9%) | 14.4% (6.4%, 22.5%) | 96.4% (95.6%, 97.1%) | 30.6% (21.7%, 39.4%) | 90% (88.7%, 91.2%) | 10.7% (7.1%, 14.3%) | 97% (96.3%, 97.8%) |
| Triglycerides ≥150 mg/dL | –‡ | –‡ | 17.3% (7.5%, 27.1%) | 90.9% (89.8%, 92%) | 18.8% (14.3%, 23.3%) | 89.8% (88.6%, 91%) | 15.9% (12%, 19.7%) | 91.6% (90.5%, 92.6%) |
| HDL-cholesterol < 40mg/dL | 3.1% (1.6%, 4.6%) | 98.6% (98.2%, 98.9%) | 26.1% (15.1%, 37%) | 86.2% (84.9%, 87.4%) | 18% (14.2%, 21.9%) | 90.2% (88.9%, 91.5%) | 23.1% (18.8%, 27.4%) | 87.1% (85.7%, 88.4%) |
| LDL-cholesterol ≥130 mg/dL | –‡ | –‡ | –‡ | 92.6% (91.7%, 93.6%) | 14.5% (9.5%, 19.4%) | 89.4% (88.1%, 90.6%) | 9.9% (6.4%, 13.4%) | 92.8% (91.9%, 93.8%) |
Metabolic syndrome is defined as waist circumference ≥90th percentile for age/sex/race and one of hypertension, hypertriglyceridemia, or hypoalphalipoproteinemia.
Sample size was too small to estimate with precision (SE ≥ 30% of estimate).
DISCUSSION
Guidelines from the ADA for screening of prediabetes and diabetes apply to a substantial proportion of the US youth population, but rates of hyperglycemia in these screening eligible youth was relatively low and varied considerably by the definition of prediabetes or diabetes used. Undiagnosed diabetes was rare; most cases of diabetes in US youth were diagnosed (>85% of total diabetes). Based on data from the SEARCH for Diabetes in Youth Study, approximately 80–90% of prevalent cases in youth 10–19 are likely to be type 1 diabetes21. While the prevalence of prediabetes and undiagnosed diabetes were higher in the population eligible for ADA screening, there were also a substantial number of youths with hyperglycemia in the non-screening eligible population – in fact, the absolute number of youths with elevated FPG was larger in the non-screening eligible population, and the majority (88.5%) of these youth were of normal weight. Current screening criteria are not highly sensitive or specific and may miss high-risk youth who should be targeted for diabetes prevention.
There is controversy regarding optimal approaches to define diabetes and prediabetes in adults and youth22,12,13,14,10. We observed substantial variability in the prevalence of undiagnosed diabetes and prediabetes depending on the definition used. This is consistent with the variation in findings from other reports using NHANES data with differing definitions of hyperglycemia3,23. Most epidemiologic studies define undiagnosed diabetes based on a single elevation in fasting glucose or HbA1c, without confirmation. In clinical practice, confirmation of any elevation of a biomarker of hyperglycemia is recommended for making a diagnosis of diabetes10. This approach enhances specificity and reduces the possibility of a false positive diagnosis. No current guidelines recommend a confirmatory definition for prediabetes. Given the biological variability of glycemic markers24 especially FPG, a larger number of individuals will always be identified as having hyperglycemia based on a single test than would be identified using a confirmatory approach (repeat testing or using a combination of elevated FPG and A1C in a single blood sample)25. There will continue to be substantial variability in estimates of undiagnosed diabetes and the prevalence of prediabetes across populations as long as multiple definitions are in use.
Adolescents with at least 1 elevated measure of hyperglycemia have been previously shown to have higher prevalence of cardiometabolic risk factors26,27. We demonstrated here that there are substantial differences in cardiometabolic risk profiles depending on how hyperglycemia was defined. HbA1c-defined hyperglycemia identifies a smaller, but higher risk population than FPG-defined hyperglycemia; this is consistent with prior studies in adults22, limited studies in children4, and the known specificity of current HbA1c cut-points28
Prior reports have stated that HbA1c is not appropriate in children, largely due to limited research on long-term prognostic value of HbA1c in this population and the discordance between HbA1c and glucose measures in youth12,13,14. Regardless of screening eligibility, both FPG and HbA1c-defined hyperglycemia identified youth with a high burden of cardiometabolic risk factors, but using a confirmatory definition (elevations in both FPG and HbA1c) provided the highest discrimination for cardiometabolic risk. HbA1c also has practical advantages; it does not require fasting, which can be difficult in children, has lower within person variability as compared to glucose29, and is the basis for diabetes treatment decisions in clinical practice. Our results suggest that HbA1c is a specific and useful test in children and adolescents.
Limitations of our study include the lack of repeat measurements and a limited sample size in certain subgroups. However, the small numbers are a function of the low prevalence of undiagnosed diabetes in the general population of adolescents and children in the US. We did not have information on all variables that make up current diabetes screening criteria in youth – in particular, even though we have information on general family history or medical risk for diabetes, we do not have explicit information on history of maternal gestational diabetes and family history of type 2 diabetes, or on presence of acanthosis nigricans or polycystic ovarian syndrome. Because of this imprecision, it is likely that we underestimated the number of US youth who would be eligible for diabetes screening. The NHANES survey questions also did not allow us to distinguish diabetes type (type 1 or type 2) in those with diagnosed diabetes. The cross-sectional design is an inherent limitation; we relied on existing cardiometabolic risk factors to identify high-risk youth. Additional studies with long-term follow-up for clinical outcomes are needed to evaluate prognosis among children and adolescents meeting criteria for prediabetes. This is a major gap in the pediatric diabetes literature. Strengths of our study include the large, nationally representative sample of children and adolescents, and rigorous and standardized measurements of both FPG and HbA1c and important cardiometabolic risk factors.
In conclusion, our results suggest that new screening guidelines may pose a high burden on the health care system given the large number of children and adolescents who are now eligible. The current screening approach targets a large number of children and adolescents whereas few will test positive for diabetes or prediabetes and a substantial number of children with hyperglycemia may be missed. Targeted approaches to diabetes screening in certain settings may be warranted. We also provided evidence that HbA1c is a useful non-fasting test in children and adolescents, regardless of screening eligibility. Youth with prediabetic levels of HbA1c or fasting glucose had a high burden of other cardiometabolic risk factors, suggesting that intensive lifestyle interventions in this high-risk population could help prevent future diabetes and cardiovascular risk in adulthood.
Supplementary Material
What’s Known on This Subject
The ADA and AAP recommend screening for type 2 diabetes and prediabetes in asymptomatic youth. It is unknown how many US youth would be eligible and which screening tests are most useful for identifying youth at high cardiometabolic risk.
What This Study Adds
We found that one-quarter of US children would be eligible for screening for type 2 diabetes, but few would meet diagnostic criteria for diabetes. Regardless of screening eligibility, the HbA1c test was an efficient approach to identify high-risk youth.
Funding:
Ms. Wallace was supported by NIH/NHLBI grant T32 HL007024. Dr. Shin was supported by NIH/NIDDK grant K01 DK121825. Dr. Selvin was supported by NIH/NIDDK grant K24 DK106414.
Abbreviations:
- HbA1c
Hemoglobin A1c
- FPG
Fasting Plasma Glucose
- 2hPG
2-hour Plasma Glucose
- NHANES
National Health and Nutrition Examination Survey
- ADA
American Diabetes Association
- AAP
American Acadamy of Pediatrics
- NCHS
National Center for Health Statistics
- CDC
Centers for Disease Control and Prevention
- LDL
Low Density Lipoprotein
- SBP
Systolic Blood Pressure
- DBP
Diastolic Blood Pressure
- BMI
Body Mass Index
- PPV
Positive Predictive Value
- NPV
Negative Predicted Value
- OR
Odds Ratio
- HDL
High Density Lipoprotein
- SE
Standard Error
Footnotes
Financial Disclosure: The authors have no financial relationships relevant to this article to disclose.
Potential Conflicts of Interest: The authors have no conflicts of interest relevant to this article to disclose.
References:
- 1.Skinner AC, Ravanbakht SN, Skelton JA, Perrin EM, Armstrong SC. Prevalence of Obesity and Severe Obesity in US Children, 1999–2016. Pediatrics. 2018;141(3):e20173459–e20173459. [DOI] [PMC free article] [PubMed] [Google Scholar]
- 2.Nadeau KJ, Anderson BJ, Berg EG, et al. Youth-Onset Type 2 Diabetes Consensus Report: Current Status, Challenges, and Priorities. Diabetes care. 2016;39(9):1635–1642. [DOI] [PMC free article] [PubMed] [Google Scholar]
- 3.Demmer RT, Zuk AM, Rosenbaum M, Desvarieux M. Prevalence of diagnosed and undiagnosed type 2 diabetes mellitus among US adolescents: results from the continuous NHANES, 1999–2010. Am J Epidemiol. 2013;178(7):1106–1113. [DOI] [PMC free article] [PubMed] [Google Scholar]
- 4.Vijayakumar P, Nelson RG, Hanson RL, Knowler WC, Sinha M. HbA1c and the Prediction of Type 2 Diabetes in Children and Adults. Diabetes care. 2017;40(1):16–21. [DOI] [PMC free article] [PubMed] [Google Scholar]
- 5.Zoungas S, Woodward M, Li Q, et al. Impact of age, age at diagnosis and duration of diabetes on the risk of macrovascular and microvascular complications and death in type 2 diabetes. Diabetologia. 2014;57(12):2465–2474. [DOI] [PubMed] [Google Scholar]
- 6.Nathan DM, Bennett PH, Crandall JP, et al. Does diabetes prevention translate into reduced long-term vascular complications of diabetes? Diabetologia. 2019;62(8):1319–1328. [DOI] [PMC free article] [PubMed] [Google Scholar]
- 7.Savoye M, Caprio S, Dziura J, et al. Reversal of early abnormalities in glucose metabolism in obese youth: results of an intensive lifestyle randomized controlled trial. Diabetes care. 2014;37(2):317–324. [DOI] [PMC free article] [PubMed] [Google Scholar]
- 8.American Diabetes Association. Type 2 diabetes in children and adolescents. American Diabetes Association. Pediatrics. 2000;105(3 Pt 1):671–680. [DOI] [PubMed] [Google Scholar]
- 9.American Diabetes Association. 2. Classification and Diagnosis of Diabetes: Standards of Medical Care in Diabetes-2018. Diabetes Care. 2018;41(Suppl 1):S13–S27. [DOI] [PubMed] [Google Scholar]
- 10.American Diabetes Association. 2. Classification and Diagnosis of Diabetes: Standards of Medical Care in Diabetes-2020. Diabetes Care. 2020;43(Suppl 1):S14–S31. [DOI] [PubMed] [Google Scholar]
- 11.Menke A, Rust KF, Savage PJ, Cowie CC. Hemoglobin A1c, fasting plasma glucose, and 2-hour plasma glucose distributions in U.S. population subgroups: NHANES 2005–2010. Annals of epidemiology. 2014;24(2):83–89. [DOI] [PMC free article] [PubMed] [Google Scholar]
- 12.Vajravelu ME, Lee JM. Identifying Prediabetes and Type 2 Diabetes in Asymptomatic Youth: Should HbA1c Be Used as a Diagnostic Approach? Current Diabetes Reports. 2018;18(7):43–43. [DOI] [PMC free article] [PubMed] [Google Scholar]
- 13.Lee JM, Wu E-L, Tarini B, Herman WH, Yoon E. Diagnosis of diabetes using hemoglobin A1c: should recommendations in adults be extrapolated to adolescents? The Journal of pediatrics. 2011;158(6):947–952.e941– 943. [DOI] [PMC free article] [PubMed] [Google Scholar]
- 14.DiabetesUK. Diagnostic criteria for diabetes. https://www.diabetes.org.uk/professionals/position-statements-reports/diagnosis-ongoing-management-monitoring/new_diagnostic_criteria_for_diabetes. Accessed 31 October 2019.
- 15.Centers for Disease Control and Prevention (CDC), National Center for Health Statistics (NCHS). NHANES - About the National Health and Nutrition Examination Survey. https://www.cdc.gov/nchs/nhanes/about_nhanes.htm. Accessed 31 October 2019.
- 16.Flynn JT, Kaelber DC, Baker-Smith CM, et al. Clinical Practice Guideline for Screening and Management of High Blood Pressure in Children and Adolescents. Pediatrics. 2017;140(3):e20171904–e20171904. [DOI] [PubMed] [Google Scholar]
- 17.Grundy SM, Stone NJ, Bailey AL, et al. 2018 AHA/ACC/AACVPR/AAPA/ABC/ACPM/ADA/AGS/APhA/ASPC/NLA/PCNA Guideline on the Management of Blood Cholesterol: A Report of the American College of Cardiology/American Heart Association Task Force on Clinical Practice Guidelines. Circulation. 2019;139(25):e1082–e1143. [DOI] [PMC free article] [PubMed] [Google Scholar]
- 18.Centers for Disease Control and Prevention (CDC), National Center for Health Statistics (NCHS). Growth Charts - Clinical Growth Charts. https://www.cdc.gov/growthcharts/clinical_charts.htm. Accessed 31 October 2019.
- 19.Selvin E, Parrinello CM, Sacks DB, Coresh J. Trends in Prevalence and Control of Diabetes in the United States. Annals of Internal Medicine. 2014;160(8):517–526. [DOI] [PMC free article] [PubMed] [Google Scholar]
- 20.Zimmet P, Alberti KG, Kaufman F, et al. The metabolic syndrome in children and adolescents - an IDF consensus report. Pediatr Diabetes. 2007;8(5):299–306. [DOI] [PubMed] [Google Scholar]
- 21.Dabelea D, Mayer-Davis EJ, Saydah S, et al. Prevalence of Type 1 and Type 2 Diabetes Among Children and Adolescents From 2001 to 2009. JAMA. 2014;311(17):1778–1786. [DOI] [PMC free article] [PubMed] [Google Scholar]
- 22.Warren B, Pankow JS, Matsushita K, et al. Comparative prognostic performance of definitions of prediabetes: a prospective cohort analysis of the Atherosclerosis Risk in Communities (ARIC) study. The Lancet Diabetes & Endocrinology. 2017;5(1):34–42. [DOI] [PMC free article] [PubMed] [Google Scholar]
- 23.Kiefer MM, Silverman JB, Young BA, Nelson KM. National patterns in diabetes screening: data from the National Health and Nutrition Examination Survey (NHANES) 2005–2012. J Gen Intern Med. 2015;30(5):612–618. [DOI] [PMC free article] [PubMed] [Google Scholar]
- 24.Rohlfing C, Wiedmeyer HM, Little R, et al. Biological variation of glycohemoglobin. Clin Chem. 2002;48(7):1116–1118. [PubMed] [Google Scholar]
- 25.Selvin E, Wang D, Matsushita K, Grams ME, Coresh J. Prognostic Implications of Single-Sample Confirmatory Testing for Undiagnosed Diabetes: A Prospective Cohort Study. Ann Intern Med. 2018;169(3):156–164. [DOI] [PMC free article] [PubMed] [Google Scholar]
- 26.Casagrande SS, Menke A, Linder B, Osganian SK, Cowie CC. Cardiovascular risk factors in adolescents with prediabetes. Diabetic Medicine. 2018;35(9):1202–1209. [DOI] [PMC free article] [PubMed] [Google Scholar]
- 27.Andes LJ, Cheng YJ, Rolka DB, Gregg EW, Imperatore G. Prevalence of Prediabetes Among Adolescents and Young Adults in the United States, 2005–2016. JAMA Pediatr. 2019:e194498. [DOI] [PMC free article] [PubMed] [Google Scholar]
- 28.Selvin E, Steffes MW, Gregg E, Brancati FL, Coresh J. Performance of A1C for the classification and prediction of diabetes. Diabetes care. 2011;34(1):84–89. [DOI] [PMC free article] [PubMed] [Google Scholar]
- 29.Selvin E, Crainiceanu CM, Brancati FL, Coresh J. Short-term Variability in Measures of Glycemia and Implications for the Classification of Diabetes. Archives of Internal Medicine. 2007;167(14):1545–1545. [DOI] [PubMed] [Google Scholar]
Associated Data
This section collects any data citations, data availability statements, or supplementary materials included in this article.