Abstract
Background and Purpose
Ischemic stroke patients with large vessel occlusion (LVO) could benefit from direct transportation to an intervention center for endovascular treatment, but non-LVO patients need rapid IV thrombolysis in the nearest center. Our aim was to evaluate prehospital triage strategies for suspected stroke patients in the US.
Methods
We used a decision tree model and geographic information system to estimate outcome of suspected stroke patients transported by ambulance within 4.5 hours after symptom onset. We compared the following strategies: (1) Always to nearest center, (2) American Heart Association (AHA) algorithm (ie, directly to intervention center if a prehospital stroke scale suggests LVO and total driving time from scene to intervention center is <30 minutes, provided that the delay would not exclude from thrombolysis), (3) “modified” algorithms with a maximum additional driving time to the intervention center of <30 minutes, <60 minutes, or without time limit, and (4) always to intervention center. Primary outcome was the annual number of good outcomes, defined as modified Rankin Scale 0-2. The preferred strategy was the one that resulted in the best outcomes with an incremental “number needed to transport to intervention center” (NNTI) <100 to prevent one death or severe disability (modified Ranking Scale >2).
Results
Nationwide implementation of the AHA algorithm increased the number of good outcomes by 594 (+1.0%) compared to transportation to the nearest center. The associated number of non-LVO patients transported to the intervention center was 16,714 (NNTI 28). The modified algorithms yielded an increase of 1,013 (+1.8%) to 1,369 (+2.4%) good outcomes, with an NNTI varying between 28 and 32. The algorithm without time limit was preferred in the majority of states (n=32 (65%)), followed by the algorithm with <60 minutes delay (n=10 (20%)). Tailoring policies at county-level slightly reduced the total number of transportations to the intervention center (NNTI 31).
Conclusions
Prehospital triage strategies can greatly improve outcomes of the ischemic stroke population in the US, but increase the number of non-LVO stroke patients transported to an intervention center. The current AHA algorithm is suboptimal as a nationwide policy and should be modified to allow more delay when directly transporting LVO-suspected patients to an intervention center.
Keywords: large vessel occlusion, endovascular treatment, thrombectomy, prehospital triage, emergency medical services
Subject Terms: Ischemic Stroke
Introduction
Patients with ischemic stroke due to a proximal intracranial large vessel occlusion (LVO) are often severely affected and are more likely to have a poor outcome than ischemic stroke patients without LVO.1-3 Endovascular treatment (EVT) using thrombectomy devices can strongly improve outcome in patients with LVO stroke, but this effect is highly time-dependent and treatment should be started as soon as possible.4-6
In clinical practice, suspected stroke patients are often transported to the nearest hospital, where they will receive a diagnostic work-up and can be treated with IV alteplase (IVT). When an LVO is present on non-invasive imaging, patients need to be transferred to a specialized intervention center capable of providing EVT. These inter-hospital transfers are associated with treatment delay and a significantly lower chance of good outcome after EVT.7, 8 Patients with LVO could benefit from direct transportation to an intervention center, while non-LVO stroke patients need rapid IVT in the nearest stroke center.9 Numerous prehospital stroke scales have been developed to identify stroke patients with LVO in the prehospital setting based on their clinical symptoms, but none of these scales have both a high sensitivity and high specificity.10
Therefore, in determining the best prehospital triage strategy, the potential benefit of rapid EVT for LVO patients needs to be weighed against the harm of delaying IVT in (false-positive) non-LVO patients. Previous modeling studies showed that the harms and benefits of transportation decisions are mainly dependent on the likelihood of LVO and the geographical distribution of centers, but the optimal triage policy for suspected stroke patients is still unknown.11-16 Currently, the Mission: Lifeline® Stroke algorithm of the American Heart Association and American Stroke Association (AHA/ASA) recommends direct transportation to an intervention center when LVO is suspected (based on a positive prehospital stroke scale), the additional driving time will not disqualify for IVT, and the total transport time from scene to nearest intervention center is less than 30 minutes.17
In this study, we aim to assess the effect of alternative prehospital triage strategies and to determine the optimal policy for suspected stroke patients in the US.
Methods
We used a previously developed decision tree model for suspected stroke patients presenting to the emergency medical services within 4.5 hours after symptom onset.15 We modeled the following prehospital triage strategies: (1) transportation of all patients to the nearest stroke center, (2) triage using the original AHA algorithm (to intervention center when LVO is suspected based on a positive prehospital stroke scale and the total driving time from scene to the intervention center is <30 minutes, provided that the delay would not exclude from IVT), (3) triage using a “modified” algorithm with extended time limits for the transport of suspected LVO patients (additional driving time to the intervention center of <30 minutes, <60 minutes, and no time limit (under the condition that IVT will not be disqualified when bypassing the nearest stroke center)), and (4) transportation of all patients to the intervention center.
This study did not use individual patient data and therefore did not need approval by an ethics committee. Analytic methods and study materials that support the findings of this study are available from the corresponding author upon reasonable request.
Input parameters
We included all 48 contiguous states and the District of Columbia. As geographic input parameters, we used the 2010 US Census tracts, which are small statistical subdivisions of counties with a population of approximately 1200 to 8000 inhabitants. The annual number of ischemic stroke patients was calculated based on the number of inhabitants per Census tract, the county-specific age distribution and the national hospitalization rates of ischemic stroke patients in 2010 for age categories 25-44, 45-64, 65-84, and 85 years and older.18, 19 We estimated that 30% of these patients presented within the 4.5 hour time window.20 To assess hospital certification status, we used data from three national accreditors: The Joint Commission Quality Check Stroke Certification program, Det Norske Veritas (DNV) National Integrated Accreditation for Healthcare Organizations (NIAHO) program, and the Healthcare Facilities Accreditation Program (HFAP).21-23 When hospitals were registered by multiple accreditors, we used the highest level of certification. Hospitals capable of delivering IVT, using telemedicine if necessary, were classified as primary stroke centers. Hospitals capable of delivering both IVT and EVT were classified as intervention centers.
As prehospital stroke scale for LVO assessment, we used the prospectively validated Rapid Arterial Occlusion Evaluation (RACE) with a sensitivity of 84% and a specificity of 60% at a cutoff at ≥5 points.24, 25 This yielded a positive predictive value of 34% and a negative predictive value of 94% at the base case prevalence of 20% LVO among suspected stroke patients. We used an average time of 90 minutes between symptom onset and departure from scene. The door-to-needle time was estimated to be 60 minutes in all primary stroke centers and 50 minutes in all intervention centers.26 Door-in-door-out time in the primary stroke centers was considered to be 100 minutes; door-to-groin time in the intervention centers 85 minutes for directly admitted patients and 55 minutes for transferred patients.7 Stroke scale characteristics, LVO prevalence and workflow times were varied in the sensitivity analyses to assess their effect on the preferred strategy.
Outcome measures
For each strategy, we calculated the annual number of good outcomes (defined as a modified Rankin Scale 0–2) and the additional number of non-LVO patients transported to an intervention center (including intracranial hemorrhages and stroke mimics). The “number needed to transport to an intervention center” (NNTI) was defined as the ratio between these two measures, ie, how many non-LVO patients are transported to an intervention center to prevent death or severe disability (modified Rankin Scale >2) in one patient.
Analyses
We used origin-destination matrix analyses to calculate driving times from all Census tract population centers (n=72,263) to the nearest primary stroke center and the nearest intervention center. The population centers defined by the Census Bureau were used as the geographic center of the population in each Census tract. Hospitals were located based on the Homeland Infrastructure Foundation-Level Data (HIFLD). We allowed transportation to an intervention center in a neighboring state. In such cases, the transport strategy of the state of origin was followed. Air transportation was not considered. We entered the calculated driving times in the existing decision tree model to estimate the effect of each strategy per Census tract. Differences in outcome were only modeled for ischemic stroke patients; outcomes of patients with intracranial hemorrhage or stroke mimics were considered to be unrelated to the initial transportation policy. The probability of a good outcome (defined as modified Rankin Scale 0–2) decreased with approximately 2.5% per hour for patients receiving IVT and with 5.2% per hour for patients receiving EVT.5, 9 Further details of the decision tree model have been published previously.15
The effect of nationwide implementation of each triage strategy was assessed with the number of poor outcomes prevented compared to transportation of all patients to the nearest stroke center, and the corresponding NNTI. We also calculated the incremental benefit of each strategy compared to the previous, more restrictive, strategy. Additionally, we assessed the best strategy for each state and each county. The preferred strategy was the one that resulted in the best outcomes with an incremental NNTI <100 patients to prevent one death or severe disability. We assessed state characteristics, such as population density and local driving times, according to the preferred strategy per state. We also calculated the incremental effect of a state-level or county-level policy, when implementing the preferred strategy in each state or each county separately.
Sensitivity analyses were performed by varying the prevalence of LVO among suspected stroke patients (from 10 to 30%), the workflow times in the primary stroke center (door-to-needle time from 30 to 90 minutes and door-in-door-out time from 50 to 150 minutes), and the maximum accepted NNTI (from 25 to 400). We showed the effect of these different scenarios on the state-level and county-level distribution of preferred strategies. We also performed a sensitivity analysis using a prehospital stroke scale with a 10% absolute increase in sensitivity or specificity.
We used ESRI ArcGIS Pro (version 2.0.0) for the network analyses and visualization of the maps. R statistical software (version 3.5.1) was used for all other analyses.
Results
We found certification data for 1,644 US hospitals, of which 328 (20%) are intervention centers. In the base case scenario, nationwide implementation of the AHA algorithm increased the number of good outcomes with 594 (+1.0%) compared to transportation of all patients to the nearest stroke center. The associated number of non-LVO patients transported to the intervention center was 16,714 (NNTI 28). The modified algorithms yielded an increase of 1,013 (+1.8%) to 1,369 (+2.4%) good outcomes, with an NNTI varying between 28 and 32 (Table 1). Nationwide transportation of all suspected stroke patients to an intervention center was inferior to the universally applied algorithm without time limit, but could still be beneficial compared to transporting all patients to the nearest stroke center in several states (n=20 (41%)) and counties (n=1,346 (43%)).
Table 1.
The effect of prehospital triage strategies in the base case scenario.
| Always
to nearest stroke center |
AHA
triage algorithm (total driving time <30 min) |
Modified triage algorithm | Always
to intervention center |
|||
|---|---|---|---|---|---|---|
| Additional driving time <30 min |
Additional driving time <60 min |
No time limit |
||||
| Nationwide policy | ||||||
| Increase in number of good outcomes per year (%)* | 0 (ref) | 594 (+1.0%) | 1,013 (+1.8%) | 1,281 (+2.2%) | 1,369 (+2.4%) | 1,289 (+2.2%) |
| Incremental good outcomes† | NA | 594 | 419 | 268 | 88 | −80 |
| Additional number of non-LVO patients transported to intervention center | 0 (ref) | 16,714 | 28,549 | 37,932 | 43,249 | 140362 |
| Incremental transportations† | NA | 16,714 | 11,835 | 9,383 | 5,317 | 97,113 |
| NNTI | NA | 28 | 28 | 30 | 32 | 109 |
| Incremental NNTI† | NA | 28 | 28 | 35 | 60 | NA |
| State-level policy | ||||||
| States with benefit‡, n (%) | 0 (ref) | 42 (86%) | 46 (94%) | 45 (92%) | 45 (92%) | 20 (41%) |
| NNTI in states with benefit, median (IQR) | NA | 28 (28–28) | 28 (27–29) | 29 (29–31) | 32 (30–35) | 83 (80–89) |
| County-level policy | ||||||
| Counties with benefit‡, n (%) | 0 (ref) | 432 (14%) | 1,497 (48%) | 1,904 (61%) | 2,069 (67%) | 1,346 (43%) |
| NNTI in counties with benefit, median (IQR) | NA | 27 (26–29) | 27 (24–29) | 29 (26–33) | 30 (27–36) | 73 (66–82) |
The estimated number of good outcomes in the scenario with standard transportation to the nearest hospital is 57,660.
Compared to the previous, more restrictive, strategy.
Benefit is defined as an increase in good outcomes compared to transportation to the nearest stroke center, with a maximum “number needed to transport to the intervention center” (NNTI) of 100 non-LVO patients to prevent one death or severe disability.
The modified triage algorithm without time limit was preferred in the majority of states (n=32 (65%)), followed by the algorithm with <60 minutes delay (n=10 (20%)) (Figure 1A). Transportation of all patients to the nearest stroke center was optimal in Idaho, Montana, and Wyoming, sparsely populated states without certified intervention centers, while the current AHA algorithm was only preferred in the District of Columbia, where the average driving time to an intervention center is very short (14 minutes). Using a modified algorithm with an additional driving time of <30 minutes was favored in rural states with very large between-center distances, while a longer delay was accepted in states with shorter driving times (Table 2). On county-level, liberal triage strategies were less often beneficial compared to standard transportation to the nearest stroke center (Figure 1B). The county-specific policy was slightly more efficient but did not improve outcome compared to the nationwide application of an algorithm without time limit (1,371 versus 1,369 poor outcomes prevented, NNTI 31 versus 32). Applying the optimal policy on Census reduced the number of unnecessary transportations further to an NNTI of 30.
Figure 1.
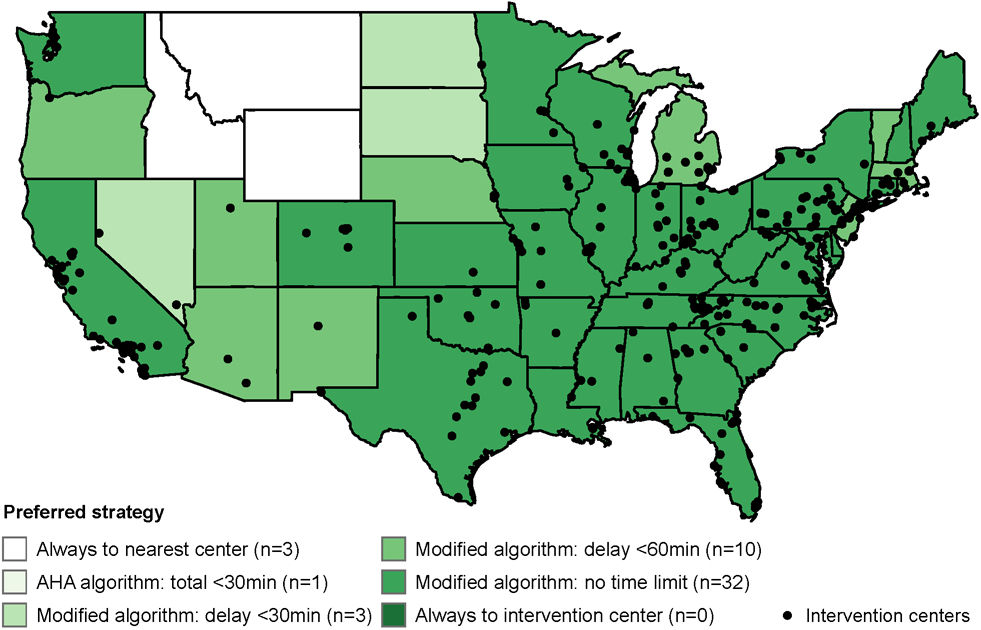
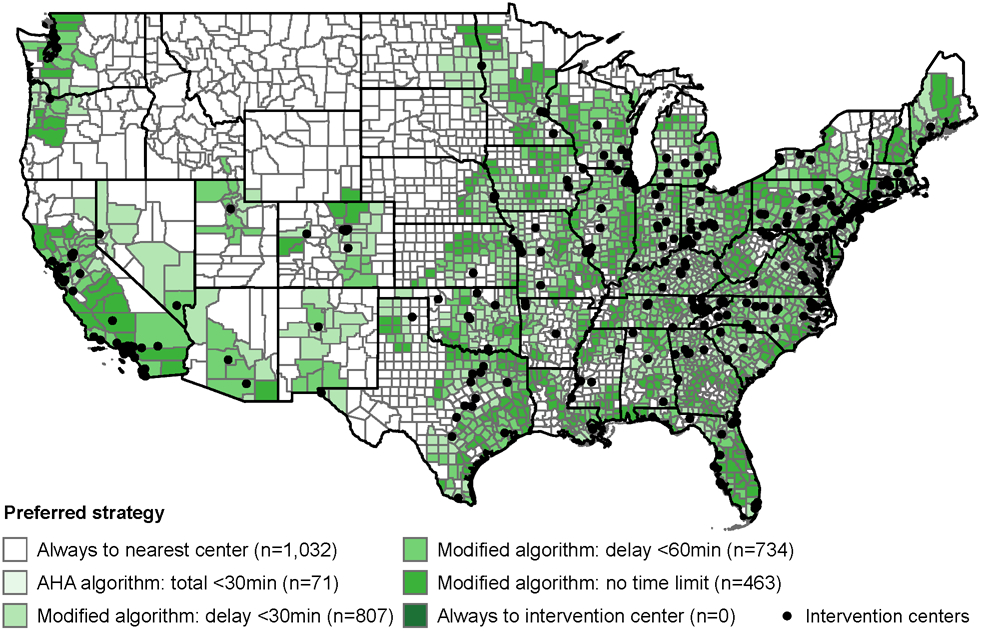
The preferred prehospital triage strategies in the base case scenario, on state-level (A; n=49) and county-level (B; n=3,107).
Table 2.
State characteristics according to the preferred prehospital triage strategy in the base case scenario.
| Always
to nearest stroke center |
AHA
triage algorithm (total driving time <30 min) |
Modified triage algorithm | ||||
|---|---|---|---|---|---|---|
| Additional driving time <30 min |
Additional driving time <60 min |
No time limit | ||||
| Number of states | 3 | 1* | 3 | 10 | 32 | |
| Population density per mi2 land area | 7 (7–14) | 11,377 | 11 (11–19) | 65 (39–704) | 131 (74–236) | |
| Total number of stroke centers per 10,000 mi2 land area | 0.03 (0.02–0.03) | 82 | 0.08 (0.06–0.1) | 0.2 (0.1–0.9) | 0.7 (0.3–1.4) | |
| Percentage of stroke centers that are intervention centers | 0% (0%–0%) | 60% | 7% (3%–0%) | 15% (10%–22%) | 16% (10%–19%) | |
| Average driving time to nearest primary stroke center, in minutes | 90 (76–104) | 11 | 61 (43–69) | 30 (26–40) | 29 (20–34) | |
| Average driving time to nearest intervention center, in minutes | 280 (261–379) | 14 | 163 (99–201) | 53 (37–87) | 49 (39–67) | |
| Average driving time between primary stroke center and nearest intervention center, in minutes | 250 (230–352) | 13 | 128 (75–167) | 38 (29–69) | 43 (34–59) | |
District of Columbia
All characteristics are expressed as median (IQR). The preferred strategy was the one that resulted in the best outcomes with an incremental “number needed to transport to intervention center” of <100 non-LVO patients to prevent one death or severe disability.
The incremental NNTI of triage strategies when using the RACE scale with a cutoff at ≥5 points varied between 28 and 60 (Figure 2A). Improving the specificity of the prehospital stroke scale with 10% decreased the number of non-LVO strokes transported to the intervention center, resulting in an incremental NNTI between 19 and 34 (Figure 2B). A 10% improvement in sensitivity led to better outcomes with an incremental NNTI between 25 and 47 (Figure 2C). Further sensitivity analyses showed that more restrictive triage strategies (ie, always to nearest stroke center or using the AHA algorithm) were preferred in scenarios with lower LVO prevalence, shorter workflow times in the primary stroke center, and when applying a maximum NNTI of 25 (Figure 3).
Figure 2.
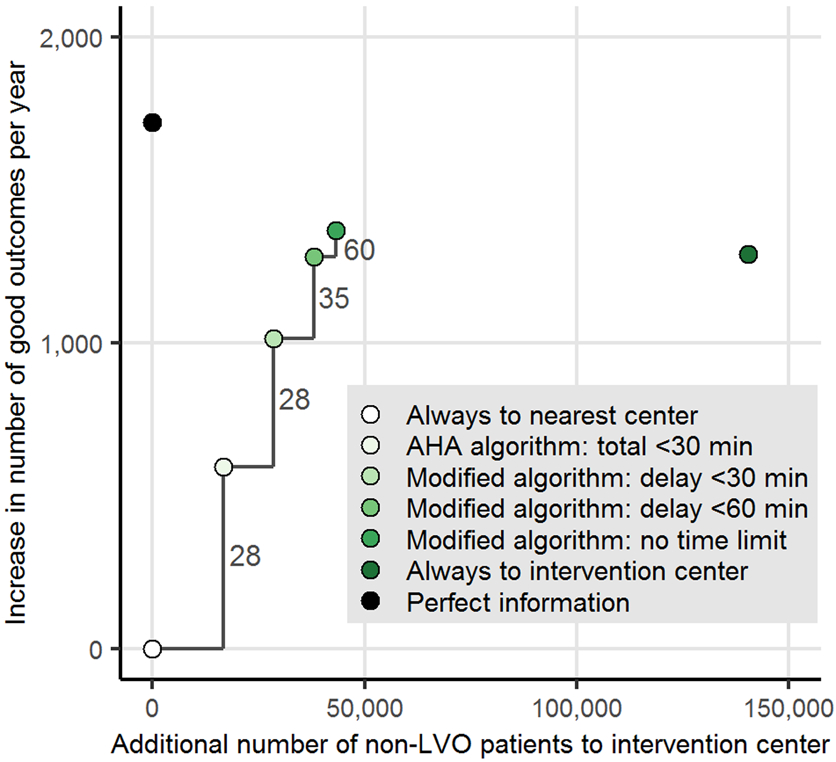
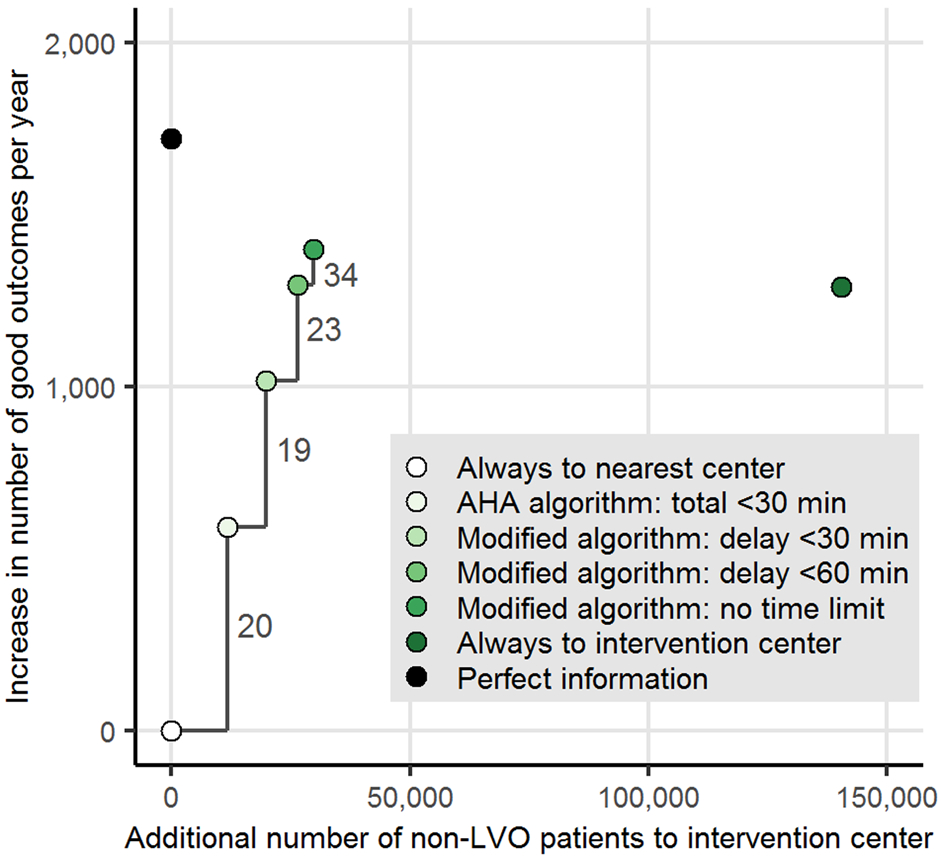
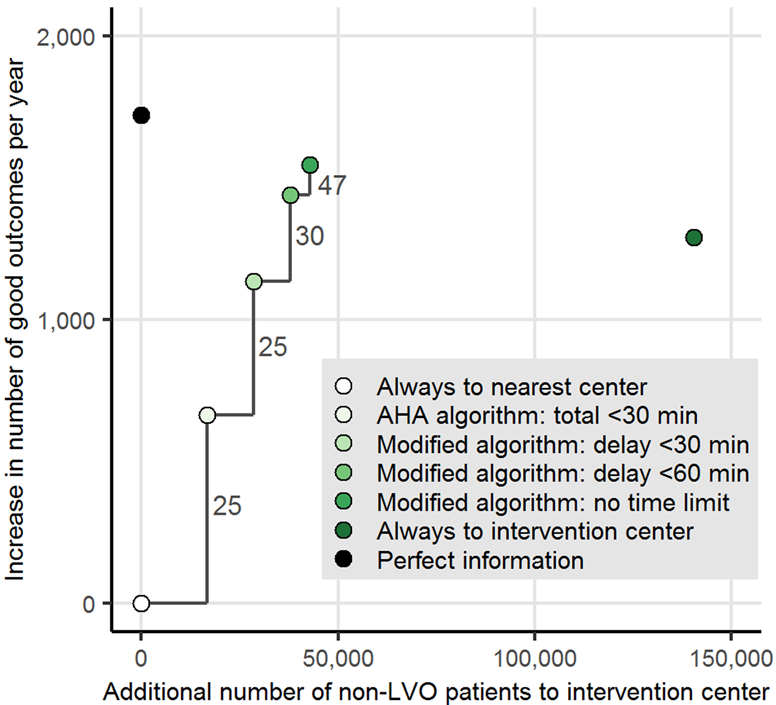
The effect of nationwide implementation of prehospital triage strategies. The increase in the number of good outcomes per year, the additional number of patients without large vessel occlusion (LVO) transported to an intervention center and the corresponding “number needed to transport to intervention center” (NNTI) to prevent death or severe disability in one patient, in scenarios with different prehospital stroke scale characteristics. In 2A, the Rapid Arterial Occlusion Evaluation (RACE) was used with a sensitivity of 84% and a specificity of 60% at a cutoff at ≥5 points; 2B, shows a 10% absolute increase in specificity (ie, sensitivity 84% and specificity 70%); 2C, a 10% absolute increase in sensitivity (ie, sensitivity 94% and specificity 60%).
Figure 3.
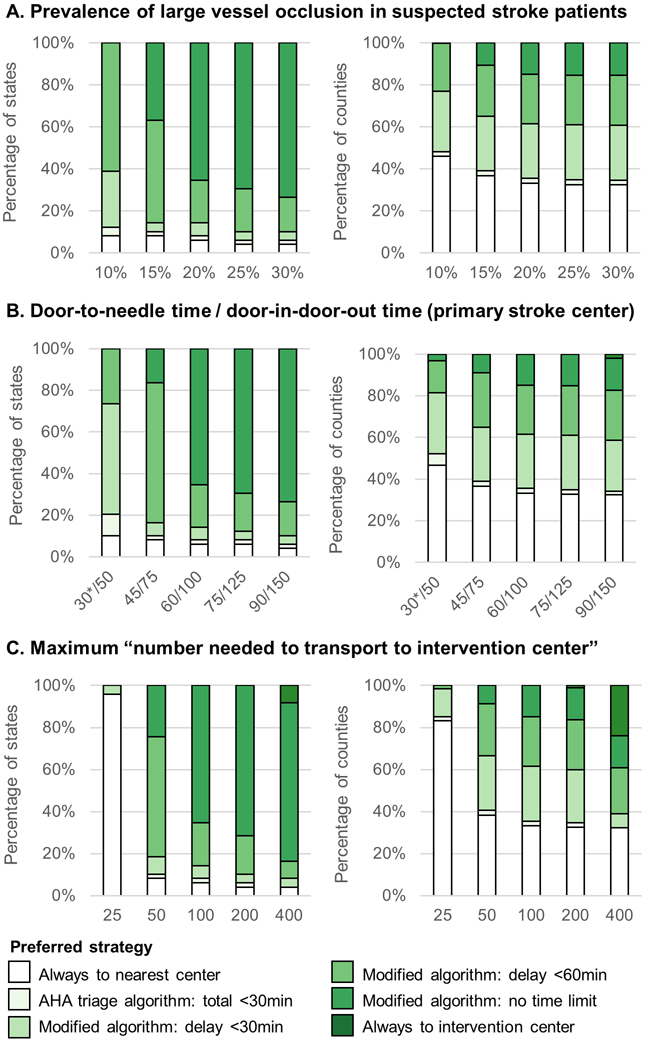
Results of the sensitivity analyses. The state-level and county-level distribution of preferred prehospital triage strategies with changing prevalence of large vessel occlusion, workflow times in the primary stroke center, and maximum accepted “number needed to transport to intervention center” to prevent one death or severe disability.
*In this scenario, the door-to-needle time in the intervention center was also adjusted to 30 minutes.
Discussion
Our major finding is that, as a nationwide policy, the AHA triage algorithm is suboptimal when compared to strategies that permit direct transport of patients with suspected LVO to an intervention center even when leading to delays of 30 minutes or beyond. The current AHA policy is only preferred for the District of Columbia, where driving times are very short, or in scenarios with a low prevalence of LVO, very efficient workflow in the primary stroke centers or a low number of additional non-LVO patients accepted in the intervention centers. An algorithm without time limit for the transportation of LVO-suspected patients would be optimal in the majority of states and could greatly improve outcomes of the ischemic stroke population. Tailoring triage policies at county-level does not increase good outcome compared to the best nationwide strategy, but slightly improves triage efficacy by reducing the number of unnecessary transportations to the intervention center.
We assessed the effect of triage strategies on functional outcome of the ischemic stroke population, thereby assuming that optimizing patient outcomes is the driving force of these decisions. However, an increasing number of patients may lead to problems with resources and crowding in the intervention centers. We therefore used the NNTI to weight the effect of triage strategies on outcome against the number of additional non-LVO stroke patients transported to an intervention center. We defined an NNTI of <100 to prevent one death or severe disability as a reasonable limit in our base case analysis. Using our decision model, we calculated that the average benefit of preventing one death or severe disability in the ischemic stroke population is 7.7 QALYs. Thus, an NNTI of 100 corresponds with approximately (100/7.7=) 13 extra non-LVO patients transported to an intervention center for each QALY gained. Given the conventional willingness-to-pay threshold of $50,000 per QALY,27 a willingness to transport 13 patients for one QALY appears reasonable compared to other widely accepted interventions. Restrictive triage strategies were only preferred when a maximum NNTI of <25 was considered.
Other criteria should also be taken into consideration when determining the optimal policy in a region. Transportation to an intervention center further away from their hometown can be inconvenient for patients and their relatives. Emergency medical services will be affected by the triage strategy: although less inter-hospital transfers will be needed, more patients will be transported directly to an intervention center further away, potentially outside the region. The shift of patient volume will also have economic consequences for primary stroke centers that will receive and treat less stroke patients. These centers need to be stimulated to improve their in-hospital workflow, because direct transportation to an intervention center becomes less favorable when the door-to-needle and door-in-door-out times in the primary stroke centers decrease. Improving the specificity of the prehospital stroke scale, either by choosing a higher cutoff or using another instrument, would also lower the number of unnecessary transportations without affecting clinical outcomes.
Several limitations of this study need to be considered. First, not all centers in the US that are capable of IVT and/or EVT are officially certified, so we may have underestimated the number of centers. A higher number of centers might make transportation of patients to the intervention center more favorable. Second, “thrombectomy-capable” centers were treated in a similar way as comprehensive stroke centers, although it is unclear whether these centers are able to maintain the same level of experience and high standards of care.28 Third, local differences in door-in-door-out time and door-to-groin time might affect the optimal transportation strategy, but due to a lack of data we had to use the average workflow times reported for primary stroke centers and intervention centers. Fourth, we assumed that outcomes of non-LVO stroke patients are similar after transportation to a primary stroke center or intervention center. Fifth, we only considered the effect on the most severely affected patients (modified Rankin Scale score ≥2), without taking into account the full shift on the modified Rankin Scale. This might have underestimated the absolute effect of triage strategies, although the pattern of the contrasts between different strategies would probably remain similar. Finally, a formal cost-effectiveness analysis was beyond the scope of this study.
Little evidence is available from clinical studies on triage strategies.29 The DIRECT-MT trial recently showed that EVT alone was non-inferior compared to EVT with prior IVT administered within 4.5 hours after symptom onset, which supports the strategy to bypass primary stroke centers when the likelihood of LVO is high.30 Results from the STRATIS Registry showed that direct transportation of LVO patients to an intervention center, especially when within 20 miles, may lead to better clinical outcomes.31 An ongoing randomized clinical trial in Catalonia, Spain, might provide real-world evidence for a triage strategy based on the RACE score.32 However, these results will only be directly applicable to regions with similar population density, between-center distances and in-hospital workflow times. Modeling studies can be used to translate these results to other regions with different geographical features, while clinical data is needed to optimize the estimates of (time-dependent) treatment efficacy, performance of prehospital stroke scales and model assumptions. A recent modeling study about the optimization of US stroke care systems showed that bypass strategies might be more efficient to maximize direct EVT access than increasing the number of EVT centers.33 Another study compared the effect of different triage policies on population level for a large region in Germany and showed that in certain regions direct transportation to an intervention center may yield better outcomes than the drip-and-ship approach.34, 35 This group showed that the current guidelines might be too conservative and suggested an additional delay to IVT of <30 minutes in urban areas and <50 minutes for rural regions.36
Our study was the first to evaluate nationwide triage strategies for the US and confirmed the beneficial effect of increasing the accepted delay to bypass the primary stroke center. Adjustments of the current recommendations from the AHA/ASA are warranted to improve outcomes of the ischemic stroke population. Direct transportation of LVO-suspected patients within the 4.5 hour time-window should be permitted when leading to delays of 30 minutes or more, but only when this will not disqualify IVT. Regional policies can be further optimized based on local geographic circumstances and organization of stroke care, for example by using a more specific stroke scale or cut point when driving times are long or resources are scarce. Air transportation or the use of mobile stroke units could be of great importance for local triage systems in rural areas. The additional benefit of a GPS-controlled application to calculate the preferred strategy based on the exact location of the ambulance (ie, on Census tract level) seems limited, unless local driving times and workflow times fluctuate strongly. In the future, with increasing population density and increasing numbers of intervention centers expected, direct transportation to the intervention center may become more beneficial.
Conclusions
Prehospital triage strategies can greatly improve outcomes of the ischemic stroke population in the US, but increase the number of non-LVO stroke patients transported to an intervention center. The current AHA triage algorithm is suboptimal as a nationwide policy and should be modified to allow more delay when directly transporting suspected LVO patients to an intervention center.
Acknowledgments
Sources of Funding
This study was funded by the Erasmus MC program for Cost-Effectiveness Research. Dr. Kent received research grants from ESPRESSO (R01-NS102233) and PCORI (ME-1606-35555).
Non-standard Abbreviations and Acronyms
- AHA
American Heart Association
- EVT
endovascular treatment
- IVT
intravenous treatment with alteplase
- LVO
large vessel occlusion
- NNTI
number needed to transport to intervention center
- RACE
Rapid Arterial Occlusion Evaluation
Footnotes
Disclosures
Dr Dippel reports grants and other from Dutch Heart Foundation, grants from Brain Foundation Netherlands, grants from Netherlands Organisation for Health Research and Development, grants from Health Holland Top Sector Life Sciences & Health, grants from Penumbra Inc., grants from Thrombolytic Science LLC, grants from Medtronic, grants from Cerenovus, grants from Thrombolytic Science LLC, and grants from Stryker European Operations BV outside the submitted work. . Dr Roozenbeek reports research grants from BeterKeten Foundation, Theia Foundation, and Erasmus MC Efficiency Research. The other authors report no conflicts.
References
- 1.Heldner MR, Zubler C, Mattle HP, Schroth G, Weck A, Mono ML, Gralla J, Jung S, El-Koussy M, Ludi R, et al. National institutes of health stroke scale score and vessel occlusion in 2152 patients with acute ischemic stroke. Stroke. 2013;44:1153–1157 [DOI] [PubMed] [Google Scholar]
- 2.Smith WS, Tsao JW, Billings ME, Johnston SC, Hemphill JC 3rd, Bonovich DC, Dillon WP. Prognostic significance of angiographically confirmed large vessel intracranial occlusion in patients presenting with acute brain ischemia. Neurocrit Care. 2006;4:14–17 [DOI] [PubMed] [Google Scholar]
- 3.Smith WS, Lev MH, English JD, Camargo EC, Chou M, Johnston SC, Gonzalez G, Schaefer PW, Dillon WP, Koroshetz WJ, et al. Significance of large vessel intracranial occlusion causing acute ischemic stroke and tia. Stroke. 2009;40:3834–3840 [DOI] [PMC free article] [PubMed] [Google Scholar]
- 4.Goyal M, Menon BK, van Zwam WH, Dippel DW, Mitchell PJ, Demchuk AM, Davalos A, Majoie CB, van der Lugt A, de Miquel MA, et al. Endovascular thrombectomy after large-vessel ischaemic stroke: A meta-analysis of individual patient data from five randomised trials. Lancet. 2016;387:1723–1731 [DOI] [PubMed] [Google Scholar]
- 5.Saver JL, Goyal M, van der Lugt A, Menon BK, Majoie CB, Dippel DW, Campbell BC, Nogueira RG, Demchuk AM, Tomasello A, et al. Time to treatment with endovascular thrombectomy and outcomes from ischemic stroke: A meta-analysis. JAMA. 2016;316:1279–1288 [DOI] [PubMed] [Google Scholar]
- 6.Mulder M, Jansen IGH, Goldhoorn RB, Venema E, Chalos V, Compagne KCJ, Roozenbeek B, Lingsma HF, Schonewille WJ, van den Wijngaard IR, et al. Time to endovascular treatment and outcome in acute ischemic stroke: Mr clean registry results. Circulation. 2018;138:232–240 [DOI] [PubMed] [Google Scholar]
- 7.Froehler MT, Saver JL, Zaidat OO, Jahan R, Aziz-Sultan MA, Klucznik RP, Haussen DC, Hellinger FR Jr., Yavagal DR, Yao TL, et al. Interhospital transfer before thrombectomy is associated with delayed treatment and worse outcome in the stratis registry (systematic evaluation of patients treated with neurothrombectomy devices for acute ischemic stroke). Circulation. 2017;136:2311–2321 [DOI] [PMC free article] [PubMed] [Google Scholar]
- 8.Venema E, Groot AE, Lingsma HF, Hinsenveld W, Treurniet KM, Chalos V, Zinkstok SM, Mulder M, de Ridder IR, Marquering HA, et al. Effect of interhospital transfer on endovascular treatment for acute ischemic stroke. Stroke. 2019;50:923–930 [DOI] [PMC free article] [PubMed] [Google Scholar]
- 9.Emberson J, Lees KR, Lyden P, Blackwell L, Albers G, Bluhmki E, Brott T, Cohen G, Davis S, Donnan G, et al. Effect of treatment delay, age, and stroke severity on the effects of intravenous thrombolysis with alteplase for acute ischaemic stroke: A meta-analysis of individual patient data from randomised trials. Lancet. 2014;384:1929–1935 [DOI] [PMC free article] [PubMed] [Google Scholar]
- 10.Smith EE, Kent DM, Bulsara KR, Leung LY, Lichtman JH, Reeves MJ, Towfighi A, Whiteley WN, Zahuranec DB, American Heart Association Stroke C. Accuracy of prediction instruments for diagnosing large vessel occlusion in individuals with suspected stroke: A systematic review for the 2018 guidelines for the early management of patients with acute ischemic stroke. Stroke. 2018;49:e111–e122 [DOI] [PubMed] [Google Scholar]
- 11.Milne MS, Holodinsky JK, Hill MD, Nygren A, Qiu C, Goyal M, Kamal N. Drip 'n ship versus mothership for endovascular treatment: Modeling the best transportation options for optimal outcomes. Stroke. 2017;48:791–794 [DOI] [PubMed] [Google Scholar]
- 12.Schlemm E, Ebinger M, Nolte CH, Endres M, Schlemm L. Optimal transport destination for ischemic stroke patients with unknown vessel status: Use of prehospital triage scores. Stroke. 2017;48:2184–2191 [DOI] [PubMed] [Google Scholar]
- 13.Holodinsky JK, Williamson TS, Demchuk AM, Zhao H, Zhu L, Francis MJ, Goyal M, Hill MD, Kamal N. Modeling stroke patient transport for all patients with suspected large-vessel occlusion. JAMA Neurol. 2018;75:1477–1486 [DOI] [PMC free article] [PubMed] [Google Scholar]
- 14.Benoit JL, Khatri P, Adeoye OM, Broderick JP, McMullan JT, Scheitz JF, Vagal AS, Eckman MH. Prehospital triage of acute ischemic stroke patients to an intravenous tpa-ready versus endovascular-ready hospital: A decision analysis. Prehosp Emerg Care. 2018;22:722–733 [DOI] [PubMed] [Google Scholar]
- 15.Venema E, Lingsma HF, Chalos V, Mulder M, Lahr MMH, van der Lugt A, van Es A, Steyerberg EW, Hunink MGM, Dippel DWJ, et al. Personalized prehospital triage in acute ischemic stroke. Stroke. 2019;50:313–320 [DOI] [PMC free article] [PubMed] [Google Scholar]
- 16.Xu Y, Parikh NS, Jiao B, Willey JZ, Boehme AK, Elkind MSV. Decision analysis model for prehospital triage of patients with acute stroke. Stroke. 2019;50:970–977 [DOI] [PMC free article] [PubMed] [Google Scholar]
- 17.American Heart Association. Mission: Lifeline stroke severity-based stroke triage algorithm for ems. 2020. https://www.heart.org/en/professional/quality-improvement/mission-lifeline/mission-lifeline-stroke (accessed February 16 2020).
- 18.Ramirez L, Kim-Tenser MA, Sanossian N, Cen S, Wen G, He S, Mack WJ, Towfighi A. Trends in acute ischemic stroke hospitalizations in the united states. J Am Heart Assoc. 2016;5 [DOI] [PMC free article] [PubMed] [Google Scholar]
- 19.United States Census Bureau. 2010 census tract reference maps. https://www.census.gov/geographies/reference-maps/2010/geo/2010-census-tract-maps.html (accessed February 16 2020).
- 20.Tong D, Reeves MJ, Hernandez AF, Zhao X, Olson DM, Fonarow GC, Schwamm LH, Smith EE. Times from symptom onset to hospital arrival in the get with the guidelines--stroke program 2002 to 2009: Temporal trends and implications. Stroke. 2012;43:1912–1917 [DOI] [PubMed] [Google Scholar]
- 21.Joint Commission. Stroke certification data. https://www.qualitycheck.org/data-download/certification-data-download/ (accessed February 16 2020).
- 22.Det Norske Veritas. National integrated accreditation for healthcare organizations. https://www.dnvglhealthcare.com/hospitals (accessed February 16 2020).
- 23.Healthcare Facilities Accreditation Program (HFAP). Certified facilities. https://hfap.org/ (accessed Fabruary 16 2020).
- 24.Perez de la Ossa N Carrera D, Gorchs M, Querol M, Millan M, Gomis M, Dorado L, Lopez-Cancio E, Hernandez-Perez M, Chicharro V, et al. Design and validation of a prehospital stroke scale to predict large arterial occlusion: The rapid arterial occlusion evaluation scale. Stroke. 2014;45:87–91 [DOI] [PubMed] [Google Scholar]
- 25.Carrera D, Gorchs M, Querol M, Abilleira S, Ribo M, Millan M, Ramos A, Cardona P, Urra X, Rodriguez-Campello A, et al. Revalidation of the race scale after its regional implementation in catalonia: A triage tool for large vessel occlusion. J Neurointerv Surg. 2019;11:751–756 [DOI] [PubMed] [Google Scholar]
- 26.Man S, Zhao X, Uchino K, Hussain MS, Smith EE, Bhatt DL, Xian Y, Schwamm LH, Shah S, Khan Y, et al. Comparison of acute ischemic stroke care and outcomes between comprehensive stroke centers and primary stroke centers in the united states. Circ Cardiovasc Qual Outcomes. 2018;11:e004512. [DOI] [PMC free article] [PubMed] [Google Scholar]
- 27.Grosse SD. Assessing cost-effectiveness in healthcare: History of the $50,000 per qaly threshold. Expert Rev Pharmacoecon Outcomes Res. 2008;8:165–178 [DOI] [PubMed] [Google Scholar]
- 28.Mack WJ, Mocco J, Hirsch JA, Chen M, Elijovich L, Tarr RW, Albuquerque FC. Thrombectomy stroke centers: The current threat to regionalizing stroke care. J Neurointerv Surg. 2018;10:99–101 [DOI] [PubMed] [Google Scholar]
- 29.Chartrain AG, Shoirah H, Jauch EC, Mocco J. A review of acute ischemic stroke triage protocol evidence: A context for discussion. J Neurointerv Surg. 2018;10:1047–1052 [DOI] [PubMed] [Google Scholar]
- 30.Yang P, Zhang Y, Zhang L, Zhang Y, Treurniet KM, Chen W, Peng Y, Han H, Wang J, Wang S, et al. Endovascular thrombectomy with or without intravenous alteplase in acute stroke. N Engl J Med. 2020;382:1981–1993 [DOI] [PubMed] [Google Scholar]
- 31.Mueller-Kronast N, Froehler MT, Jahan R, Zaidat O, Liebeskind D, Saver JL, Investigators S. Impact of ems bypass to endovascular capable hospitals: Geospatial modeling analysis of the us stratis registry. J Neurointerv Surg. 2020 [DOI] [PMC free article] [PubMed] [Google Scholar]
- 32.Abilleira S, Perez de la Ossa N, Jimenez X, Cardona P, Cocho D, Purroy F, Serena J, Roman LS, Urra X, Vilaro M, et al. Transfer to the local stroke center versus direct transfer to endovascular center of acute stroke patients with suspected large vessel occlusion in the catalan territory (racecat): Study protocol of a cluster randomized within a cohort trial. Int J Stroke. 2019;14:734–744 [DOI] [PubMed] [Google Scholar]
- 33.Sarraj A, Savitz S, Pujara D, Kamal H, Carroll K, Shaker F, Reddy S, Parsha K, Fournier LE, Jones EM, et al. Endovascular thrombectomy for acute ischemic strokes: Current us access paradigms and optimization methodology. Stroke. 2020;51:1207–1217 [DOI] [PubMed] [Google Scholar]
- 34.Ernst M, Schlemm E, Holodinsky JK, Kamal N, Thomalla G, Fiehler J, Brekenfeld C. Modeling the optimal transportation for acute stroke treatment: The impact of the drip-and-drive paradigm. Stroke. 2020;51:275–281 [DOI] [PubMed] [Google Scholar]
- 35.Schlemm L, Endres M, Scheitz JF, Ernst M, Nolte CH, Schlemm E. Comparative evaluation of 10 prehospital triage strategy paradigms for patients with suspected acute ischemic stroke. J Am Heart Assoc. 2019;8:e012665. [DOI] [PMC free article] [PubMed] [Google Scholar]
- 36.Schlemm L, Endres M, Nolte CH. Bypassing the closest stroke center for thrombectomy candidates: What additional delay to thrombolysis is acceptable? Stroke. 2020;51:867–875 [DOI] [PubMed] [Google Scholar]


