Abstract
Objective:
Weight stigma is associated with poor dietary adherence, yet adherence is essential for weight loss and maintenance. This study aimed to determine differences in dietary adherence and perceived hunger between lean and two groups of individuals with obesity.
Methods:
In a 6-week outpatient dietary intervention (23males; age 48±14), lean participants (n=23; BMI 23±2 kg/m2) received a weight maintaining diet (WMEN) and participants with obesity (BMI 36±7) were randomized to either WMEN (n=18) or 35% calorie reduced (CR) diet (n=19). All food was provided and multiple All food was provided and multiple adherence and hunger ratings were assessed daily and weekly on an outpatient basis and in person at twice weekly visits (e.g. 24h recall, diaries, etc.).
Results:
Weight decreased more in individuals with obesity CR group (β=−0.301kg/week, p=0.02) compared to lean and individuals with obesity WMEN groups. However, total percent adherence did not differ between groups (p=0.60) and hunger scores did not change across groups over time (p=0.08).
Conclusions:
Results indicate there are no differences in dietary adherence between lean and individuals with obesity and adherence is not associated with adiposity or hunger. Thus, the belief that non-adherence (e.g. lack of willpower) is unique to obesity is untrue and may perpetuate weight bias and stigma.
Trial Registration:
clinicaltrials.gov, NCT01862796, https://clinicaltrials.gov/ct2/show/NCT01862796
Keywords: Hunger, Adiposity, Underfeeding, Diet, Weight stigma
Introduction
Between 50-58% of adults with obesity in the US are attempting to lose weight(1). Yet, successful weight reduction and maintenance remain elusive for most dieters. The annual probability of achieving a 5% reduction in body weight is approximately 1 in 8 and among these individuals >50% at 2 years and >75% at 5 years fail to maintain weight loss(2).
Adherence is the “extent to which patients follow instructions given to them for prescribed treatments” and is essential for achieving successful health outcomes(3). Non-adherence is a primary treatment barrier for most medical conditions and rates of non-adherence are substantially higher for lifestyle prescriptions and behaviorally demanding regimens(4).
Dietary adherence is critical for successful initial weight loss and long term weight maintenance(5) and was the most likely explanation for the observed low efficacy of low-calorie diets, even after considering metabolic adaptations to weight loss(6). Greater adherence to multiple treatment components results in greater weight loss (7, 8, 9, 10, 11, 12). However, it is unclear whether individuals with obesity manifest greater difficulty with dietary adherence compared with lean individuals. Factors that underlie adherence are not well understood especially whether individuals with obesity manifest greater difficulty with dietary adherence compared with lean individuals. Previous literature has also reported differences in cognitive function between lean and individuals with obesity. Thus, it is possible increased adiposity is associated with differences in decision making, which may affect adherence(13). Furthermore, in regards to calorie restriction it is not known whether it is a dietary prescription itself (even when given to maintain weight) that affects adherence (13). To our knowledge, no study to date has examined dietary adherence in lean individuals or in comparison to individuals with obesity. The aim of the current study was to determine differences in dietary adherence between lean and two groups of individuals with obesity assigned to different dietary prescriptions (weight maintaining diet [WMEN] vs. calorie reduced [CR]). We also investigated differences in perceived hunger across groups and whether adherence scores would be associated with weight loss in the individuals with obesity CR group.
Methods
Participants
From May 2013 to March 2018, 100 non-diabetic individuals age 18-70 years were recruited from the greater Phoenix, AZ, metropolitan area via advertisement to participate in a 6-week outpatient dietary intervention program. Sixty-one met inclusion criteria (Figure 1A) and were enrolled in the study (Clinical Trial Identifier: NCT01862796). One volunteer was found to be taking medication and was withdrawn from the study. Screening, eligibility and analyzed data are reported in the CONSORT diagram (Figure 1A). Prior to participation, participants were informed of the nature, purpose and risks of the study and provided written informed consent. The protocol was approved by the Institutional Review Board of the NIDDK and is described in detail below (Figure 1B). All participants were healthy based on medical history, physical examinations and laboratory tests, weight stable (± 2%) for the last 3 months and had BMI < 25 kg/m2 (Lean) or ≥ 30 kg/m2 (Individuals with obesity).
Figure 1.
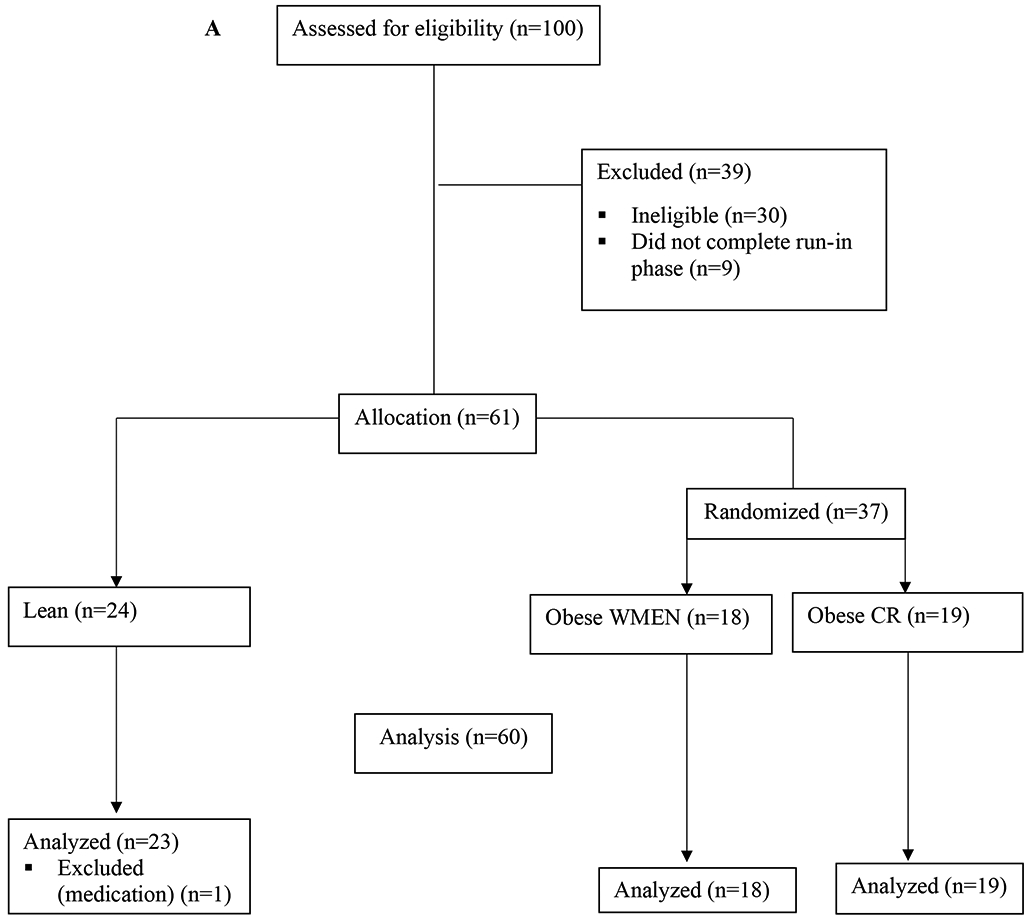
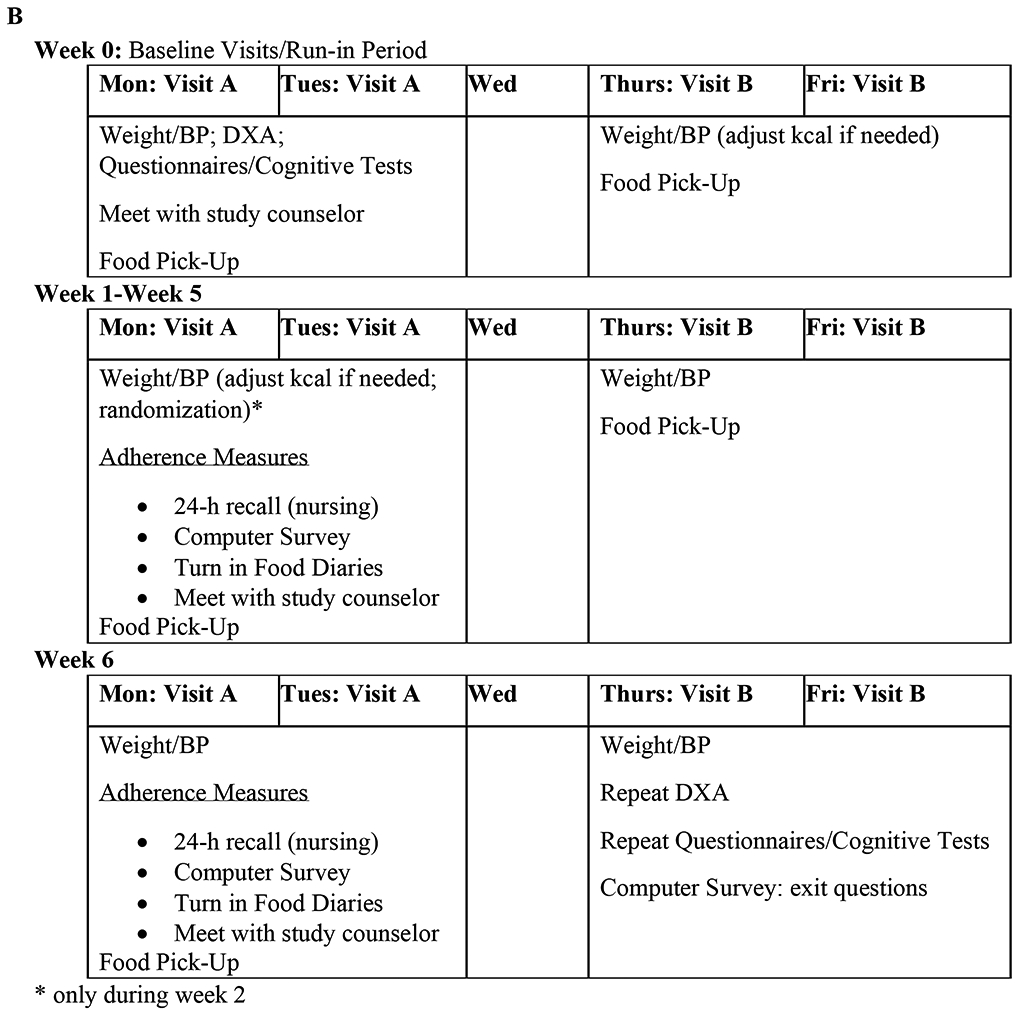
A, CONSORT diagram. B, Study Protocol Design.
Study Design (See Figure 1B)
Baseline Visits:
During the first baseline visit, participants completed the MacArthur Scale of Subjective Social Status(14) to assess subjective socioeconomic status (SSS) and body composition was determined by Dual-Energy X-Ray Absorptiometry (DPX-L; Lunar Radiation, Madison, WI). WMEN were calculated for each participant based on the WHO equation for weight, height, sex and results from the Physical Activity Recall (PAR) questionnaire(15, 16, 17). Participants met with a study counselor to review the WMEN dietary prescription (20%, 30% and 50% of daily calories provided as protein, fat and carbohydrate). All food items were provided by our metabolic kitchen, primarily as prepackaged meals and snacks for the participants to take home (See Supplemental Table S1 and Table S2). They were given 4 days of food and dietary instructions to: eat only the foods provided, consume no additional foods, maintain current levels of physical activity, and keep track on a self-monitoring food record form. During the first week, and prior to randomization, participants were weighed at 2 outpatient baseline visits. If their weight changed by ±2% their WMEN was adjusted by 200 kcal accordingly.
Outpatient Visits (6 weeks):
During the first outpatient visit, participants with obesity were stratified by sex and age using a block design and then randomized by investigator who was not a part of the study to receive either a 35% underfeeding (CR) diet or continue their WMEN diet. Lean participants continued their WMEN diet. Participants and study staff were aware of group allocation following randomization. Participants were provided with 4 days of food and the dietary instructions (outlined above) were repeated. Additionally, they were trained to use the smart-phone system for momentary data collection (see below for more details). Weight and blood pressure were obtained at each visit and meals were picked up 2x/week. Participants met with the study counselor 1x/week to collect food records and assess dietary adherence.
Adherence Assessments at weekly in person visits:
Following their weekly counselor meeting, a 24-hour food recall was conducted by a different staff member (to avoid bias). Participants also completed a computerized survey in private, which consisted of a similar 24-hour recall with prompts and additional questions to assess hunger levels (described below) and liking of the provided food.
Subjective Hunger Ratings:
Hunger was assessed in 3 different ways during the in person visit: 1) the counselor asked participants to rate their overall level of hunger over the past week on a 5-point Likert scale (1=low hunger, 5=high hunger); during the computer survey, participants were asked to rate 2) current hunger levels and 3) hunger levels over the past week as compared to usual (before starting the study) based on a 5-point Likert scale (1=not at all hungry; much less hungry compared to usual, 5=extremely hungry; much hungrier compared to usual). Pearson correlation coefficients revealed that the three hunger measures were highly correlated and thus averaged to create a single hunger score (see results under Hunger scores) by taking the average of the 3 hunger score measures at each of the 6 visits for a total of 6 average hunger score ratings for each participant.
Outpatient Adherence Assessments:
Further adherence assessments outside of the in-person visits were measured as follows:
A member of the study staff called participants 1x/week at random to conduct a 24-h food recall via phone.
Ecological Momentary Assessment (EMA) using a Smart-phones data collection system called ReTAINE (see ReTAINE.com) was used to reflect repeated, real-time (momentary) assessment in the participants’ natural environment(18). Signal contingent recording occurred at semi-random times 2x/day: once between 8am and 3pm and once between 3pm and 9pm. When signaled, participants were asked “Since the last time you were signaled, have you eaten anything?”, “If yes, did you eat the study food provided to you?”, “If no, which food didn’t you eat?”, “Did you eat anything else (in addition to the food provided)?”, “If yes, what did you eat?”.
Post-Intervention Visit:
During the final visit of the 6-week outpatient study, participants repeated laboratory tests, DXA, behavioral questionnaires and provided a final adherence measurement via computer survey.
Scoring Adherence: (see Supplemental Material and Table S3)
Adherence was the primary outcome of interest and was coded as a binary variable: 0 points if non-adherent and 1 point if adherent. Assessments included attendance at each of their 2 weekly appointments (12 possible points over the course of study) and being on-time (± 15 minutes) for their once weekly counselor appointment (6 points possible). Four additional measures were assessed 1x/week, including: 1) Food Diaries; 2) 24-hour recall in person interview; 3) Computer survey and; 4) 24-hour outpatient telephone recall. Adherence points for each of these assessments were awarded for: 1) completing the assessment; 2) eating all food provided; and, 3) not eating any additional foods, totaling 18 possible points over the course of the study.
EMA Recordings:
there were two signaled assessments per day, and adherence points were awarded for 1) completing the EMA; 2) eating all the food provided; and 3) not eating any additional foods, totaling 6 possible points per day. EMA weekly scores were divided by 7 to obtain average daily scores allowing participants to earn 36 total possible points over the course of the study.
Total Adherence Score:
the scores of all variables were summed to calculate a total adherence score, which was then divided by 126 (total points possible) to derive a total percent adherence score for each participant. A more detailed description and example of the scoring algorithm can be found in Supplemental Material and Table S3.
Statistical Analysis
Power calculations performed prior to starting the study determined that 60 individuals (20 per group) had greater than 90% power with an alpha of 0.05 to detect a clinically meaningful, pairwise difference (mean±SD) of 3.5±6.0 adherence points/week between the groups (19). The total number of points earned per week was 21, we assumed that the individuals with obesity CR group would be 62% adherent (equivalent to 13 adherence points/wk)(19). All statistical data analyses were preplanned and performed using SAS Enterprise Guide (version 7.1) and SPSS (version 25). Alpha was set at 0.05 and 2-sided p-values were reported. Normally distributed data are presented as mean ±SD or with 95% CI, while skewed data are presented as median with interquartile range (IQR). Differences in baseline continuous measures between groups were evaluated using one-way ANCOVA to adjust for age, while group differences in categorical variables were analyzed using the Chi-squared test. Paired t-tests were used to assess differences in cholesterol and triglycerides at baseline and the end of the study within each group. To address multiple comparisons between the three groups, Tukey post-hoc analyses were performed. Associations among baseline variables, adherence measures, and subjective hunger scores were assessed using Pearson’s (r) or Spearman’s (ρ) correlation coefficients as appropriate. Differences in percent total adherence by group status (lean, individuals with obesity WMEN and CR) was assessed using one-way ANOVA.
A principal component analysis (PCA(20)) was applied to the entire set of 17 adherence variables to identify groups of correlated variables, to reduce dimensionality of data, and to produce overall adherence scores for each subject by properly weighing each single variable. The number of significant PCs used to calculate the individual, overall adherence scores (in standardized units) was determined by the scree test criterion of eigenvalues vs. rank, and further confirmed statistically by parallel analysis(21). The varimax rotation(22) was applied to improve the clinical interpretation of PCs. For each adherence variable included in the PCA, the Pearson’s correlation coefficient (PCA loading) was used to quantify the contribution of that adherence variable to each PC. Secondary outcomes were assessed using mixed models to analyze repeated measures of weight and hunger over time using a first-order autoregressive covariance structure AR(1).
Results
Participant baseline characteristics are described in Table 1. The lean group consisted of 23 individuals, 18 individuals with obesity were randomized to the WMEN and 19 individuals with obesity were randomized to the CR diet. Despite recruitment stratification by BMI, there was overlap in percent bodyfat (PFAT) between lean and individuals with obesity group (see Figure 2). However, BMI and PFAT were significantly lower in the lean group compared to both groups with obesity (p-values <0.001) and were not significantly different between individuals with obesity CR and individuals with obesity WMEN groups (p-values>.05). There were no significant differences between baseline and the final study visit on measures of cholesterol or triglycerides within any of the groups (p-values>.05).
Table 1.
Participant Demographics
| Variable | All | Lean |
Individuals with Obesity WMEN |
Individuals Obesity CR |
|---|---|---|---|---|
| n | 60 | 23 | 18 | 19 |
| Race/Ethnicity | 5AA, 1A, 29C, 8H, 16NA, 1P | 3AA, 1A, 17C 1H, 1NA | 2AA, 3C, 5H, 8NA | 9C, 2H, 7NA, 1P |
| Sex | 23m, 37f | 9m, 14f | 5m, 13f | 9m, 10f |
| Age (yrs) | 48.3 (14.1) | 49.7 (12.5) | 49.8 (13.1) | 45.3 (16.8) |
| Education (yrs) | 14.0 (2.4) | 14.7 (2.0) | 13.7 (2.9) | 13.4 (2.0) |
| SSS (US) | 5.7 (2.2) | 5.4 (1.8) | 5.7 (2.2) | 6.2 (2.7) |
| Weight (kg)** | 86.1 (27.3) | 63.9 (8.0) | 88.1 (15.3) | 111.0 (29.1) |
| Height (cm)* | 166.5 (9.9) | 166.9 (8.6) | 161.7 (9.4) | 170.5 (10.4) |
| BMI (kg/m2)** | 30.9 (8.5) | 22.9 (1.8) | 33.5 (4.0) | 38.0 (8.7) |
| PFAT (%) ** | 33.4 (9.5) | 25.0 (8.4) | 37.8 (5.5) | 39.4 (5.6) |
| FM (kg)** | 30.0 (15.6) | 15.7 (5.5) | 33.0 (5.9) | 44.3 (15.5) |
| FFM (kg)** | 55.9 (14.7) | 47.7 (8.9) | 55.1 (12.9) | 66.7 (15.7) |
| Waist (in)** | 39.1 (8.0) | 31.6 (2.8) | 41.1 (3.7) | 46.3 (7.5) |
| WMEN (kcal)* | 2550.5 (619.0) | 2330.4 (421.5) | 2538.9 (543.6) | 2827.9 (785.1) |
Race/Ethnicity, Sex and n are presented as frequencies; while other variables are presented as means (standard deviations). m=male; f=female; C=Caucasian, NA=Native American, AA=African American, H=Hispanic, A=Asian, P=Pacific Islander; SSS=Subjective Socioeconomic Status (US); FM=Fat Mass; FFM=Fat-free Mass; Waist=Waist Circumference; WMEN=Weight Maintaining Energy Needs
p<0.05
p<0.01 from ANOVA tests between groups
Figure 2.
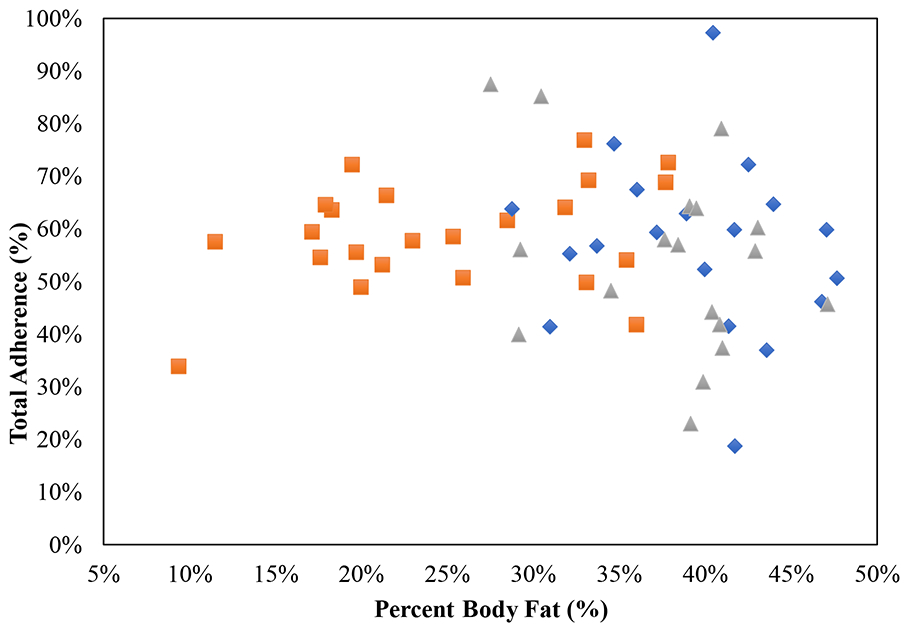
Association between baseline percent body fat (PFAT) and total percent adherence (%), the Pearson correlation coefficient (r) is reported along with its significance. The lean group is represented by orange squares, individuals with obesity CR blue diamonds and the individuals with obesity WMEN group-grey triangles.
Adherence Scores
Total percent adherence scores did not differ by sex, level of education or SSS (all p-values > 0.10). Adherence scores were positively associated with age (r=.32, p=0.01) but not with PFAT in the entire sample (r=−.10, p=0.46) or within each group (all p-values>0.05; Figure 2). Total percent adherence scores were not different between the groups (mean adherence score, Lean: 59%, CI: 53-65%; Individuals with obesity WMEN: 54%, CI: 47%−61%; Individuals with obesity CR: 57%, CI: 50%−64%, p=0.54; Figure 3) even after adjustment for age. Results were similar even after segregating the data by WHO PFAT criteria(23).
Figure 3.
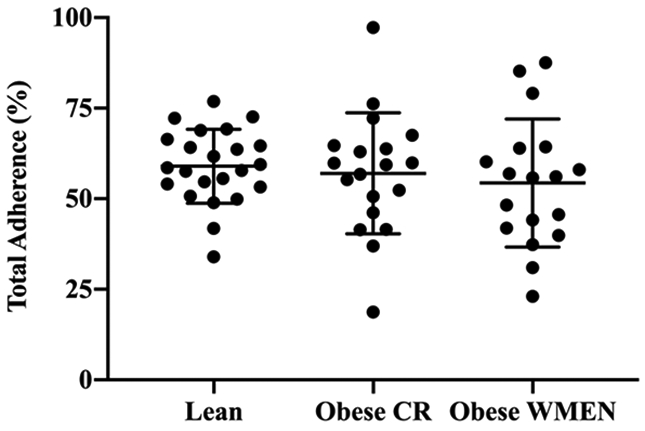
Total adherence scores (%) between the three groups, lean = 59%, individuals with obesity WMEN = 54% and individuals with obesity CR = 57%, were not significantly different, p=.60. Error bars represent the mean with 95% confidence interval.
Principle Component Analysis (see Supplemental Table S4)
The scree plot and parallel analysis identified three PCs as significant, together explaining 56% of the total variance in the adherence variables submitted to PCA. Adherence variables clustered into three components: the first component (explained variance=30%) was characterized by the following questions regarding both the EMA and 24-h phone recall: ‘participant completed EMA or 24-h phone recall’, ‘ate all study food’ and ‘did not eat other food’. The second component (explained variance=14%) clustered around the following questions regarding food diary and 24-h in person interview/computer survey: ‘ate all food’ and ‘did not eat other food’. Lastly, the third component (explained variance=12%) clustered around attendance and questions regarding participants’ completion of food diary/24-h in person interview and computer survey. Similarly to the results obtained from analyses of percent adherence scores, there were no group differences on the three PCA adherence factors (all p-values>0.05).
Body Weight Change
After controlling for baseline weight, age and sex, CR group had a significant decline in body weight over the 6-weeks (β=−0.3 kg/week, CI −0.55 to −0.05, p=0.02) compared to lean and individuals with obesity WMEN groups (p-values >0.05; Figure 4A). The average weight change after 6 weeks was: Lean: 0.11 CI: −0.03 to 0.24; Individuals with obesity WMEN: −0.65, CI: −0.88 to −0.42; Individuals with obesity CR: −1.46, CI: −1.77 to −1.15. We did not observe any effect of adherence score on weight change over the 6-weeks, both expressed as the absolute weight change and percent weight change (p-values>0.05). Results were similar after stratification by group (all three p>0.05). Similarly, there was no effect for any of the three PCA adherence factors on rate of weight change over the 6-weeks (p-values>0.05).
Figure 4.
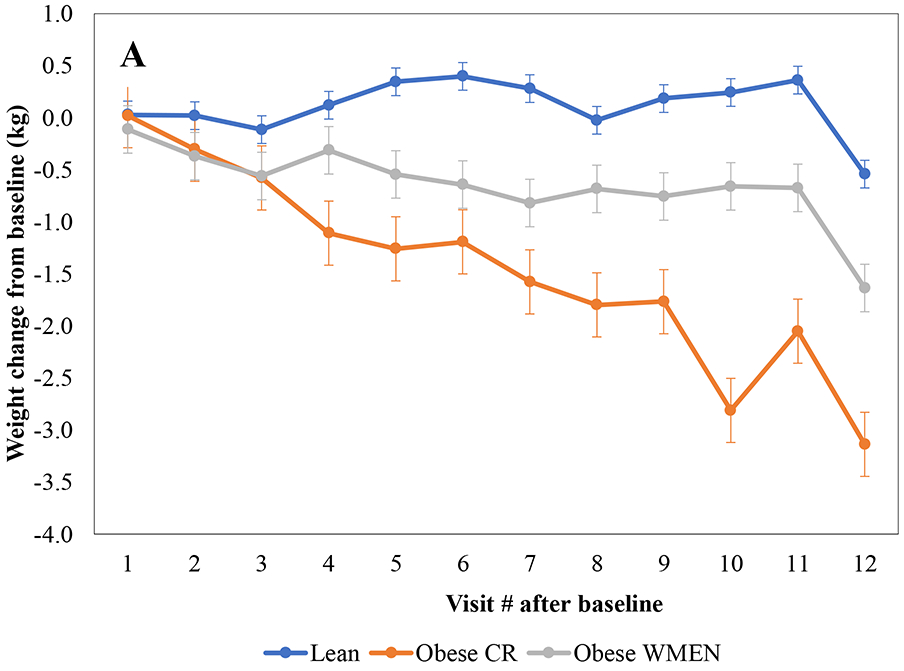
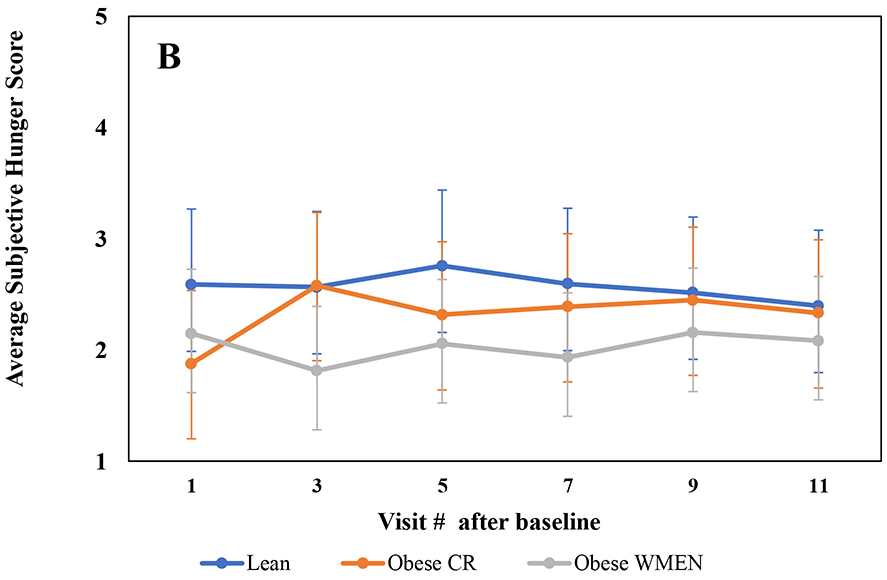
A, Absolute weight change trajectories (Visit weight-baseline weight) show that were the individuals with obesity CR group lost significantly more weight over the 6-weeks compared to the individuals with obesity WMEN and lean groups (p=0.02). B, Average subjective hunger score trajectories were not significantly different between groups (p=0.08). Error bars represent 95% confidence intervals of the means. Mixed models were adjusted for age, time (days), sex and baseline weight (weight loss model only) using an AR(1) covariance structure.
Subjective Hunger Ratings
In person hunger ratings were associated with both computer hunger scores: hunger over the past week (ρ=.63, p<0.0001) and hunger ratings at time of computer survey (ρ=.45, p=0.0003). Similarly, the computer hunger ratings were correlated with each other, (ρ=.53, p<0.0001), indicating that all three of these assessments were measuring the same “hunger” construct. Overall, the lean group had significantly higher hunger scores compared to the individuals with obesity WMEN group (p=0.02) but hunger scores did not change over the 6-weeks (p=0.08; Figure 4B) and hunger score trajectories were not significantly different between the three groups. Results were similar when the three hunger scores were analyzed separately (p-values>0.05). Moreover, hunger scores were not associated with adherence scores in the entire cohort (ρ=−.06, p=0.64; Supplemental Figure S1) or within each group (p-values>0.05).
Adverse Events
There were no adverse events or unintended effects in any study participants.
Discussion
In the present study, we found no differences in dietary adherence between lean and two groups of individuals with obesity assigned different dietary prescriptions (WMEN vs. CR). Using PCA, we identified 3 independent factors of adherence, which also did not differ between groups, bolstering our null finding with the aggregate adherence score. In addition, hunger ratings were similar across all groups. Most importantly, adherence scores were not associated with hunger ratings in any group nor with the amount of weight lost in the individuals with obesity CR group.
A strength of the current study is that adherence was measured by combining multiple assessment components. Previous studies have generally focused on only one component of adherence such as self-monitoring(10, 11, 24), attendance (9) or attrition (25, 26, 27) whereas we examined a total of 17 adherence variables including, attendance, food diaries, 24-h in person food recalls, EMA, 24-h computer food recalls and 24-h phone food recalls. Moreover, because adherence is a multi-dimensional construct and because we assessed adherence in multiple ways, we were able to perform PCA identifying 3 independent factors, which can be broadly grouped as 1) outpatient/phone adherence, 2) in-person adherence and 3) attendance adherence. Although the results indicated there were no significant differences between the three groups on total (%) or the three independent factors of adherence, the PCA results support the notion that adherence is multi-dimensional. Furthermore, we demonstrated that the first PCA component, outpatient/phone adherence accounts for the largest portion of variance in adherence scores. Thus, future studies should address this by weighting the assessment of these items to more accurately capture adherence.
Although adherence did not differ between the three groups, the individuals with obesity CR group lost weight, as expected. Within this group, weight loss was not associated with level of adherence, contrary to other studies (7, 24). While inter-individual levels of adherence may be important within a group prescribed calorie restriction (7, 9, 24) our findings indicate that it does not appear to be adiposity or calorie restriction per se that increases non-adherence. The evidence for this lies, in part, in the lack of difference in the hunger scores by group across time, indicating that non-adherence to modest CR is independent of subjective hunger. Thus, the non-adherence so commonly observed in weight reduction programs is not a “hunger” problem but is likely attributable to other factors that are also observed across various medical conditions. For example, poorer problem-solving skills have been shown to mediate the relationship between treatment adherence and weight loss (28, 29) while neuroticism was the second strongest predictor of non-adherence to CPAP treatment for obstructive sleep apnea (30). Higher levels of neuroticism, lower levels of conscientiousness (31) and poor performance on an everyday problem-solving questionnaire (32) have been associated with lower levels of medication adherence. Individuals with obesity who were considered frequent dieters (e.g. diet-resistant) under reported their food intake by nearly 30% more than a comparison group with obesity who were not diet resistant (33).
This study has several limitations. First, this was a 6-week study, only enabling us to assess short-term outcomes. It is possible that one group may have become less adherent over time, which has been demonstrated in longer studies(7, 34). Second, all our dietary adherence measures were participant driven assessments. Lastly, the sample size was small, specifically for the CR obesity group, which decreased our power to detect a relationship between adherence factors and weight-loss. This study also has several strengths, including the novel use of multiple measurements completed during both outpatient and inpatient visits in combination with EMA, which measured daily adherence in real-time. We had a high retention rate (87%) and provided volunteers with prepackaged meals and exact menus. Combined, these methods provided added accuracy for overall measure of adherence.
Conclusion
In our study, we did not observe differences in dietary adherence between lean individuals versus those with obesity who were provided a weight-maintaining or CR diet. Although we observed weight loss in the individuals with obesity CR group, overall hunger ratings did not differ by group and were not associated with amount of weight lost. These findings have implications for reducing weight bias and social stigma often faced by individuals with obesity. The misperception that non-adherence (e.g. lack of willpower) is uniquely characteristic of individuals with obesity is untrue and could be prejudicial. Rather, dietary adherence is similar among lean individuals, not associated with increased adiposity and is not associated with calorie reduction or hunger. Developing models to measure and predict adherence that are not influenced by weight bias is an important next step and is critical to the establishment of successful dietary interventions.
Supplementary Material
Study Important Questions.
What is already known about this subject?
Weight stigma is associated with poor dietary adherence.
Dietary adherence is a critical aspect of successful weight loss, and greater dietary adherence has previously been associated with greater weight loss.
What are the new findings in your manuscript?
Dietary adherence did not differ between lean individuals and individuals with obesity or between those with obesity on a weight maintaining vs. a calorie reduced diet.
Hunger ratings also did not differ between lean and individuals with obesity groups and was not associated with adherence.
How might your results change the direction of research of the focus of clinical practice?
The belief that non-adherence and lack of willpower are unique behaviors that characterize individuals with obesity is untrue and may perpetuate weight bias and stigma.
Designing models to measure and predict adherence that are not influenced by weight bias is crucial to the development of successful dietary interventions.
Acknowledgments
The authors thank the volunteers who participated in our studies. They also thank the clinical staff of the Phoenix Epidemiology and Clinical Research Branch for conducting the examinations. The authors have nothing to disclose. The deidentified data described in the manuscript, code book, and analytic code will be made available upon request pending application and approval.
FUNDING: This study was supported by the Intramural Research Program of the National Institute of Diabetes and Digestive and Kidney Diseases, National Institutes of Health.
ABBREVIATIONS:
- WMEN
weight maintaining diet
- CR
calorie reduced
- EMA
ecological momentary assessment
- SSS
subjective socioeconomic status
- PCA
principal component analysis
- PFAT
percent body fat
Footnotes
DISCLOSURE: The authors declared no conflict of interest.
CLINICAL TRIAL REGISTRATION: (clinicaltrials.gov): NCT01862796
References
- 1.Kruger J, Galuska DA, Serdula MK, Jones DA. Attempting to lose weight: specific practices among U.S. adults. American journal of preventive medicine 2004;26: 402–406. [DOI] [PubMed] [Google Scholar]
- 2.Fildes A, Charlton J, Rudisill C, Littlejohns P, Prevost AT, Gulliford MC. Probability of an Obese Person Attaining Normal Body Weight: Cohort Study Using Electronic Health Records. American journal of public health 2015;105: e54–59. [DOI] [PMC free article] [PubMed] [Google Scholar]
- 3.Haynes RB, Ackloo E, Sahota N, McDonald HP, Yao X. Interventions for enhancing medication adherence. The Cochrane database of systematic reviews 2008: Cd000011. [DOI] [PubMed] [Google Scholar]
- 4.Haynes RB, McDonald HP, Garg AX. Helping patients follow prescribed treatment: clinical applications. Jama 2002;288: 2880–2883. [DOI] [PubMed] [Google Scholar]
- 5.Lemstra M, Bird Y, Nwankwo C, Rogers M, Moraros J. Weight loss intervention adherence and factors promoting adherence: a meta-analysis. Patient preference and adherence 2016;10: 1547–1559. [DOI] [PMC free article] [PubMed] [Google Scholar]
- 6.Heymsfield SB, Harp JB, Reitman ML, Beetsch JW, Schoeller DA, Erondu N, et al. Why do obese patients not lose more weight when treated with low-calorie diets? A mechanistic perspective. The American journal of clinical nutrition 2007;85: 346–354. [DOI] [PubMed] [Google Scholar]
- 7.Acharya SD, Elci OU, Sereika SM, Music E, Styn MA, Turk MW, et al. Adherence to a behavioral weight loss treatment program enhances weight loss and improvements in biomarkers. Patient preference and adherence 2009;3: 151–160. [DOI] [PMC free article] [PubMed] [Google Scholar]
- 8.Laitner MH, Minski SA, Perri MG. The role of self-monitoring in the maintenance of weight loss success. Eating behaviors 2016;21: 193–197. [DOI] [PMC free article] [PubMed] [Google Scholar]
- 9.Compher CW, Hanlon A, Kang Y, Elkin L, Williams NN. Attendance at clinical visits predicts weight loss after gastric bypass surgery. Obesity surgery 2012;22: 927–934. [DOI] [PubMed] [Google Scholar]
- 10.Krukowski RA, Harvey-Berino J, Bursac Z, Ashikaga T, West DS. Patterns of success: online self-monitoring in a web-based behavioral weight control program. Health psychology : official journal of the Division of Health Psychology, American Psychological Association 2013;32: 164–170. [DOI] [PMC free article] [PubMed] [Google Scholar]
- 11.Peterson ND, Middleton KR, Nackers LM, Medina KE, Milsom VA, Perri MG. Dietary self-monitoring and long-term success with weight management. Obesity (Silver Spring, Md) 2014;22: 1962–1967. [DOI] [PMC free article] [PubMed] [Google Scholar]
- 12.Fitzpatrick SL, Bandeen-Roche K, Stevens VJ, Coughlin JW, Rubin RR, Brantley PJ, et al. Examining behavioral processes through which lifestyle interventions promote weight loss: results from PREMIER. Obesity (Silver Spring, Md) 2014;22: 1002–1007. [DOI] [PMC free article] [PubMed] [Google Scholar]
- 13.Davis C, Levitan RD, Muglia P, Bewell C, Kennedy JL. Decision-making deficits and overeating: a risk model for obesity. Obesity research 2004;12: 929–935. [DOI] [PubMed] [Google Scholar]
- 14.Adler NE, Epel ES, Castellazzo G, Ickovics JR. Relationship of subjective and objective social status with psychological and physiological functioning: preliminary data in healthy white women. Health psychology : official journal of the Division of Health Psychology, American Psychological Association 2000;19: 586–592. [DOI] [PubMed] [Google Scholar]
- 15.WHO. Energy and protein requirements In: Rep WT (ed). Geneva, 1985. [Google Scholar]
- 16.Garrel DR, Jobin N, de Jonge LH. Should we still use the Harris and Benedict equations? Nutrition in clinical practice : official publication of the American Society for Parenteral and Enteral Nutrition 1996;11: 99–103. [DOI] [PubMed] [Google Scholar]
- 17.Wilson PW, Paffenbarger RS Jr, Morris JN, Havlik RJ. Assessment methods for physical activity and physical fitness in population studies: report of a NHLBI workshop. American heart journal 1986;111: 1177–1192. [DOI] [PubMed] [Google Scholar]
- 18.Stone AA, Shiffman S. Ecological momentary assessment (EMA) in behavorial medicine. Annals of Behavioral Medicine 1994. [Google Scholar]
- 19.Williamson DA, Anton SD, Han H, Champagne CM, Allen R, LeBlanc E, et al. Adherence is a multi-dimensional construct in the POUNDS LOST trial. Journal of behavioral medicine 2010;33: 35–46. [DOI] [PMC free article] [PubMed] [Google Scholar]
- 20.Jolliffe I Principal component analysis. Springer-Verlag; 2002;45: 487. [Google Scholar]
- 21.Horn JL. A rationale and test for the number of factors in factor analysis. Psychometrika 1965;30: 179–185. [DOI] [PubMed] [Google Scholar]
- 22.Kaiser HF. The varimax criterion for analytic rotation in factor analysis. Psychometrika 1958;23: 187–200. [Google Scholar]
- 23.Snitker S Use of body fatness cutoff points. Mayo Clinic Proceedings. Elsevier, 2010, p 1057. [DOI] [PMC free article] [PubMed] [Google Scholar]
- 24.Burke LE, Conroy MB, Sereika SM, Elci OU, Styn MA, Acharya SD, et al. The effect of electronic self-monitoring on weight loss and dietary intake: a randomized behavioral weight loss trial. Obesity (Silver Spring, Md) 2011;19: 338–344. [DOI] [PMC free article] [PubMed] [Google Scholar]
- 25.Handjieva-Darlenska T, Holst C, Grau K, Blaak E, Martinez JA, Oppert JM, et al. Clinical correlates of weight loss and attrition during a 10-week dietary intervention study: results from the NUGENOB project. Obesity facts 2012;5: 928–936. [DOI] [PubMed] [Google Scholar]
- 26.Dalle Grave R, Calugi S, Compare A, El Ghoch M, Petroni ML, Tomasi F, et al. Weight Loss Expectations and Attrition in Treatment-Seeking Obese Women. Obesity facts 2015;8: 311–318. [DOI] [PMC free article] [PubMed] [Google Scholar]
- 27.Hadziabdic MO, Mucalo I, Hrabac P, Matic T, Rahelic D, Bozikov V. Factors predictive of drop-out and weight loss success in weight management of obese patients. Journal of human nutrition and dietetics : the official journal of the British Dietetic Association 2015;28 Suppl 2: 24–32. [DOI] [PubMed] [Google Scholar]
- 28.Murawski ME, Milsom VA, Ross KM, Rickel KA, DeBraganza N, Gibbons LM, et al. Problem solving, treatment adherence, and weight-loss outcome among women participating in lifestyle treatment for obesity. Eating behaviors 2009;10: 146–151. [DOI] [PMC free article] [PubMed] [Google Scholar]
- 29.Perri MG, Nezu AM, McKelvey WF, Shermer RL, Renjilian DA, Viegener BJ. Relapse prevention training and problem-solving therapy in the long-term management of obesity. Journal of consulting and clinical psychology 2001;69: 722–726. [PubMed] [Google Scholar]
- 30.Moran AM, Everhart DE, Davis CE, Wuensch KL, Lee DO, Demaree HA. Personality correlates of adherence with continuous positive airway pressure (CPAP). Sleep & breathing = Schlaf & Atmung 2011;15: 687–694. [DOI] [PubMed] [Google Scholar]
- 31.Jerant A, Chapman B, Duberstein P, Robbins J, Franks P. Personality and medication non-adherence among older adults enrolled in a six-year trial. British journal of health psychology 2011;16: 151–169. [DOI] [PMC free article] [PubMed] [Google Scholar]
- 32.Gelb SR, Shapiro RJ, Thornton WJ. Predicting medication adherence and employment status following kidney transplant: The relative utility of traditional and everyday cognitive approaches. Neuropsychology 2010;24: 514–526. [DOI] [PubMed] [Google Scholar]
- 33.Lichtman SW, Pisarska K, Berman ER, Pestone M, Dowling H, Offenbacher E, et al. Discrepancy between Self-Reported and Actual Caloric Intake and Exercise in Obese Subjects. New England Journal of Medicine 1992;327: 1893–1898. [DOI] [PubMed] [Google Scholar]
- 34.Zheng Y, Burke LE, Danford CA, Ewing LJ, Terry MA, Sereika SM. Patterns of self-weighing behavior and weight change in a weight loss trial. International journal of obesity (2005) 2016;40: 1392–1396. [DOI] [PubMed] [Google Scholar]
Associated Data
This section collects any data citations, data availability statements, or supplementary materials included in this article.


