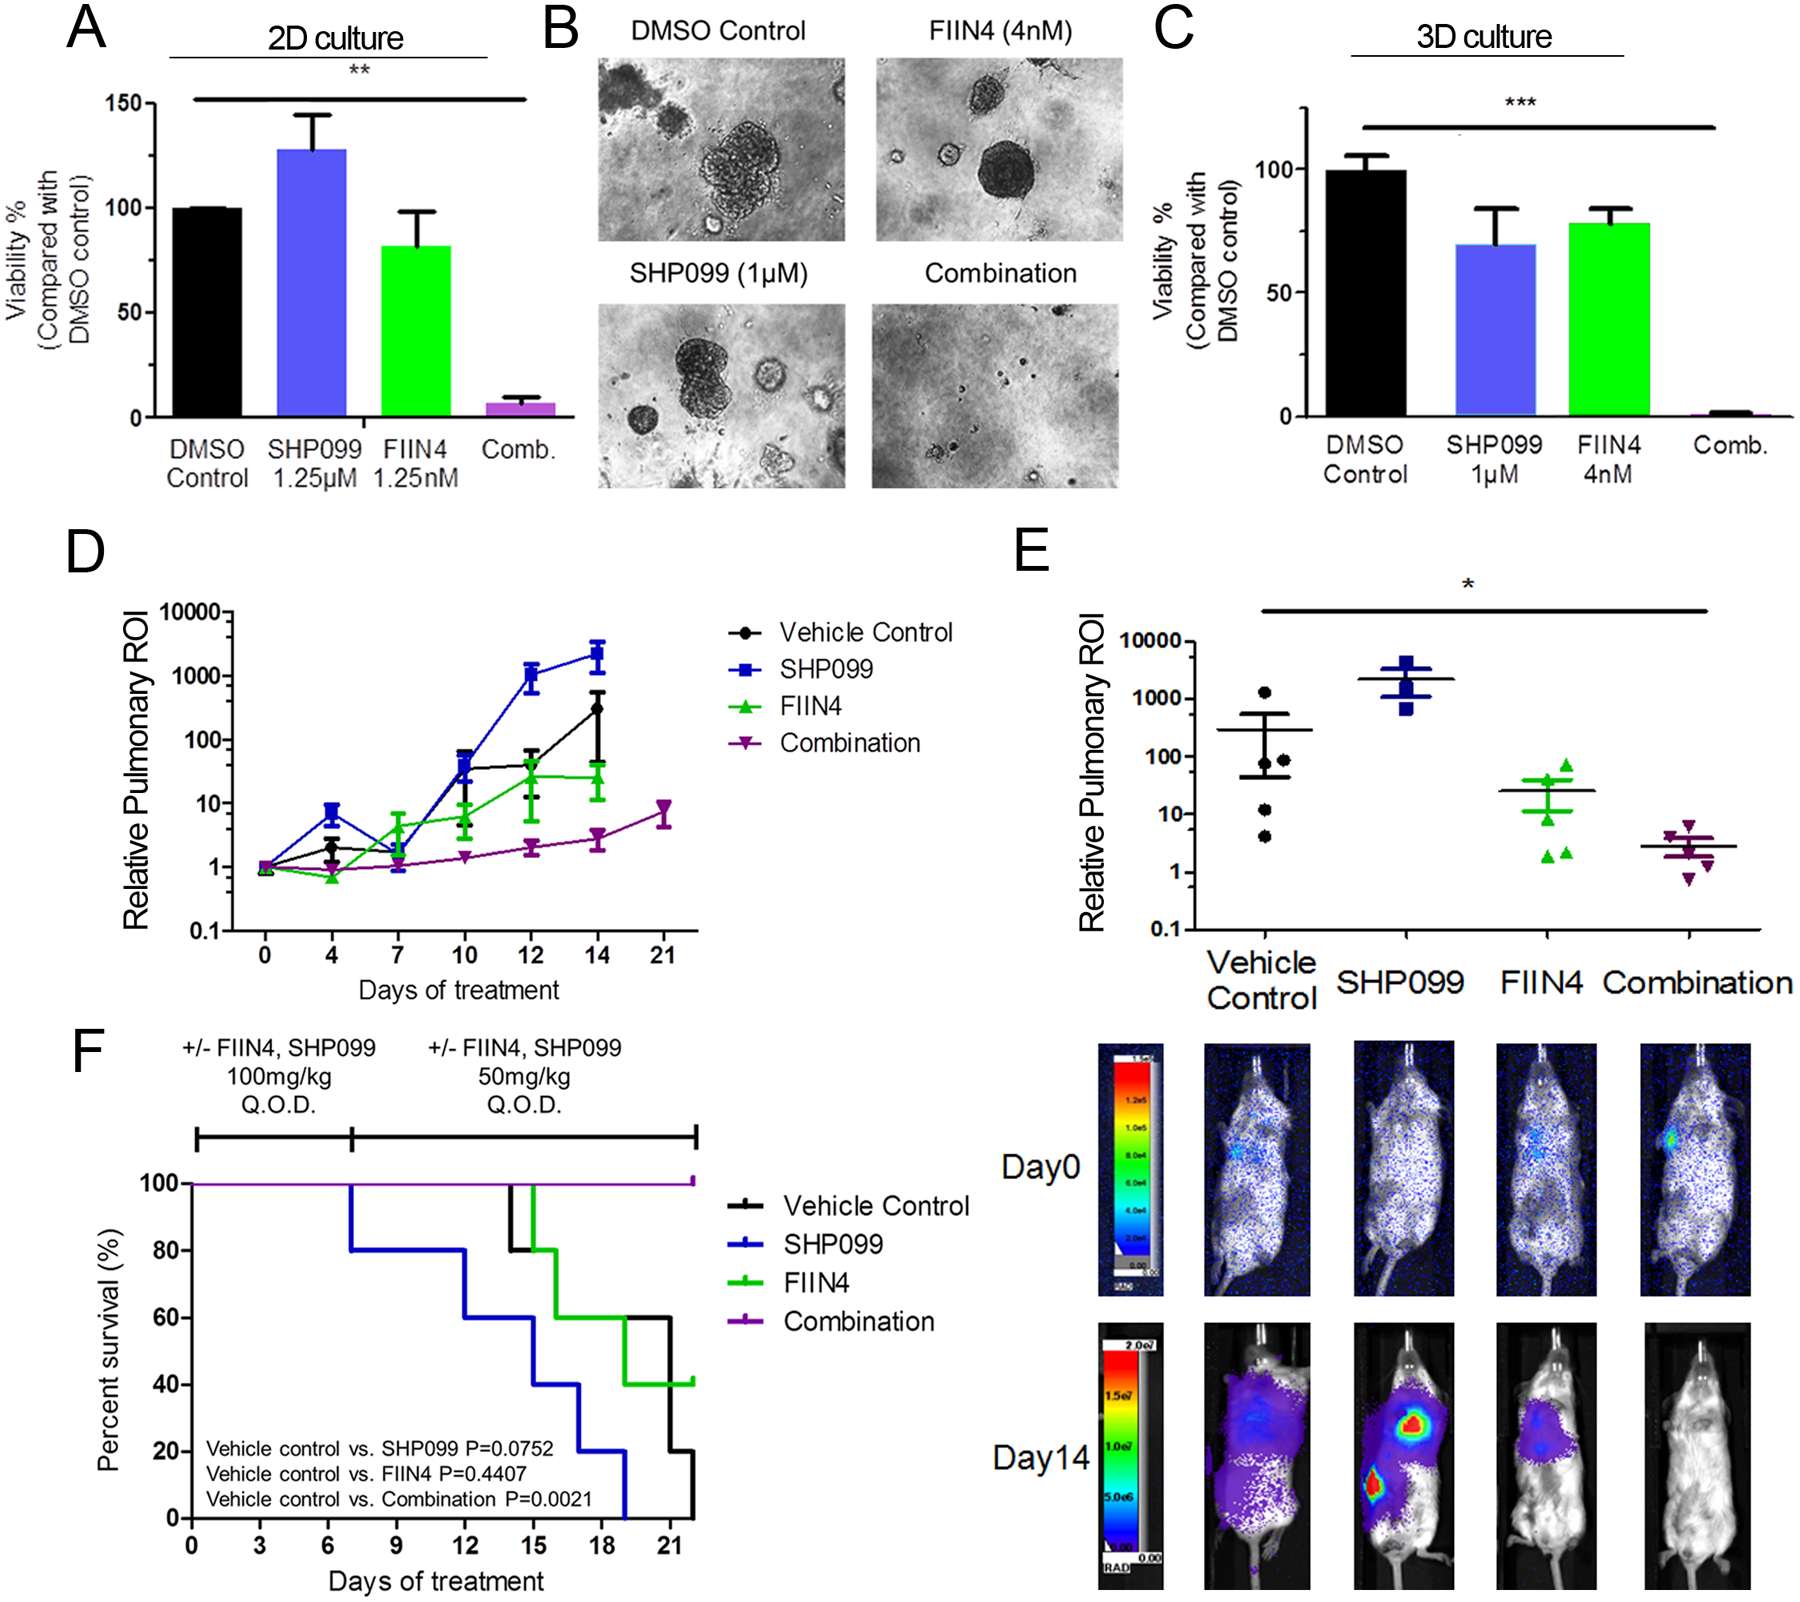
Figure 6.

Inhibition of SHP2 synergizes with blockade of FGFR in vitro and in vivo. a 4T1 cells were seeded in 2D culture, and treated with the indicated concentrations of SHP099, FIIN4 alone, or both compounds for 6 days. b, c Single cell suspensions of 4T1 cells were plated in 3D matrices and treated with the indicated compounds alone or in combination for 12 days. Media containing DMSO was used as a vehicle control. Data in panels A and C data are bioluminescence values normalized to DMSO controls and are the mean ± s.e.m. of at least 3 independent experiments where **p<0.01, ***p<0.001 as determined by a two-tail Student’s t-test. d Bioluminescence values for pulmonary regions of interest (ROI) from mice bearing 4T1 metastases normalized to values at the initiation of treatment. Data are the mean ±s.e.m. of 5 mice per treatment group. e (bottom) Representative bioluminescent images of metastasis and (top) quantified pulmonary ROI values from mice bearing 4T1 metastases 14 days after treatment initiation. Data are the mean ±s.e.m. of 5 mice per group resulting in *p<0.05 as determined by a two-tail Mann Whitney test. f Differential survival analyses of tumor bearing mice in each treatment group, resulting in the indicated P values as determined by a log-rank test.
