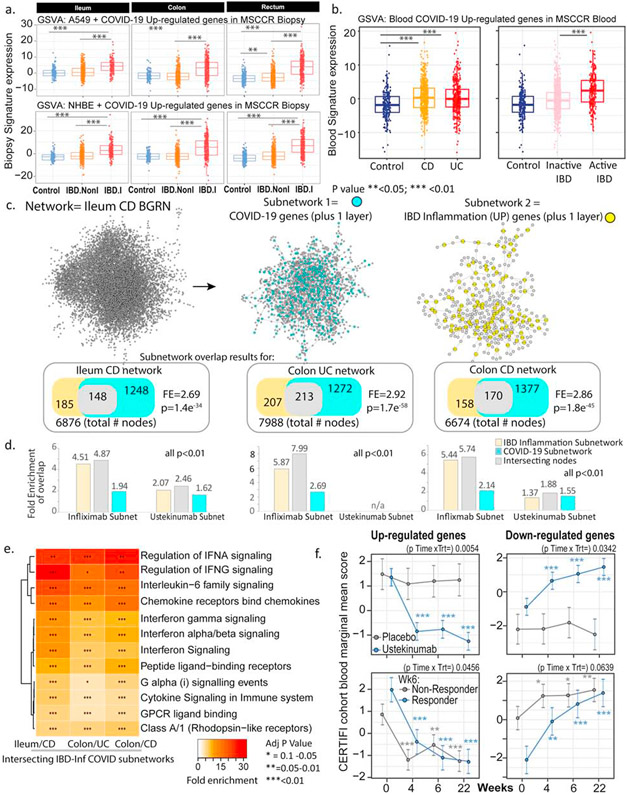
Figure 6: Molecular genes associated with IBD inflammation overlap with genes responsive to COVID-19 infection in lung cell model and whole blood.
(A) Boxplot of the overall activity of COVID-19-responsive genes (up-regulated) as determined in A549 (upper panel) or NHBE (lower panel) lung epithelial cell models23 in the MSCCR biopsy samples using GSVA. Box plots summarize the mean expression (+/− SEM) of the two signatures (SF11 and sample sizes in Table S4, *** = p value <0.001). (B) Box plot summarizing the expression of the COVID-19 blood signature (up-regulated genes)22 in the blood transcriptome data of the MSCCR showing association between IBD disease (Left panel) and clinical severity (right panel) (SF11). (C) Three NHBE-COVID-19-and three IBD-Inf- associated subnetworks were generated one each for ileum CD, colon UC and colon CD BGRNs (Table S17 and S18). The three ileum-associated CD networks are shown for example. Venn diagrams of the overlap in subnetwork genes including the fold enrichment (FE) and a p-value of the enrichment test are shown. Using the BGRNs drug response subnetworks were generated (See supplementary methods) for infliximab and ustekinumab response genes. The bar graph summarizes the FE for the overlaps between the drug response and either the i) COVID-19 subnetworks; ii) IBD inflammation subnetworks or iii) the intersecting nodes between COVID-19 and IBD-Inf subnetworks. A full table of network nodes and enrichment results can be found in Table S23 and S24 (D) The 3 sets of genes in the intersecting subnetworks from C were interrogated for enrichment in the Reactome database. Heatmap depicting the FE in pathways (BH adj p<0.1 and minimum 5-fold enrichment, Table S19). (E) Expression of a molecular signature consisting of genes responsive to COVID-19 infection as determined in blood transcriptome data from adult IBD patients with CD (CERTIFI cohort). (Upper panels) Estimated marginal means (M+SEM) for the activity (GSVA scores) of the COVID-19 blood signature22 on the blood transcriptome of CERTIFI patients with CD at baseline and after weeks 4 to 22 of treatment with ustekinumab or placebo. (Lower panels) Ustekinumab-induced changes in COVID-19 blood signature between week 6 responders and non-responders (defined as change in CDAI). P-values denote significance of each time point compared to screening visit *P<0.1), **(P<0.05), ***(P<0.01).

