

Abstract
Importance:
Black patients are overrepresented in the number of COVID-19 infections, hospitalizations, and deaths. Reasons for this disparity may be due to underlying comorbidities or sociodemographic factors that require further exploration.
Objective:
To systematically determine patient characteristics associated with racial/ethnic disparities in COVID-19 outcomes.
Design:
A retrospective cohort study with comparative patient groups.
Setting:
Patients tested/treated for COVID-19 at University of Michigan Medicine from March 10, 2020 to April 22, 2020 with a prognosis update through July 28th, 2020.
Participants:
5,698 tested patients and 7,168 randomly selected untested patients as comparison.
Main Outcomes and Measures:
We identified factors associated with testing and testing positive for COVID-19, being hospitalized, requiring intensive care unit (ICU) admission, and mortality (in/out-patient). Factors included race/ethnicity, age, smoking, alcohol consumption, healthcare utilization, and residential-level socioeconomic characteristics. Medical comorbidities were defined from the International Classification of Diseases (ICD) codes and were aggregated into a comorbidity score.
Results:
Of 5,698 patients, (median age, 47 years; 38% male; mean BMI, 30.0), the majority were non-Hispanic White (65.6%) and non-Hispanic Black (18.6%). Among 1,139 diagnosed, there were 43.2% White and 38.8% Black patients; 45.9% hospitalized, 24.7% admitted to ICU, and 7.7% died. Adjusting for age, sex, SES and comorbidity score, Black patients were 1.72 times more likely to be hospitalized (95% CI, 1.15–2.58; P=.009). In addition to older age, male sex and obesity, living in densely populated areas (OR, 1.10 [95% CI, 1.01–1.19]; P=.02) was associated with hospitalization. Pre-existing type 2 diabetes and kidney disease led to 1.63 and 3.14 times higher odds of hospitalization (95% CI, 1.04–2.54; P=.03 and 1.84–5.38; P<.001) in the overall population, respectively. Comparing White with Black patients, obesity and any cancer showed stronger association with testing positive in Black patients (Pinteraction=.02 and .04, respectively) while overall comorbidity burden and type 2 diabetes showed stronger association with hospitalization in White patients (Pinteraction=.02 and .046, respectively). No statistically significant racial differences were found in ICU admission and mortality based on adjusted analysis.
Conclusions and Relevance:
Pre-existing type 2 diabetes/kidney diseases and living in high population density areas were associated with high risk for COVID-19 hospitalization. Association of risk factors with COVID-19 outcomes differed by race.
Introduction
The COVID-19 pandemic, caused by severe acute respiratory syndrome coronavirus SARS-CoV-2, has underscored racial disparities in those affected in the United States (US)1–25. In the state of Michigan in particular, there have been 113,820 confirmed COVID-19 cases and 6,767 deaths as of September 1, 2020, which makes Michigan one of the most affected states in the US26. While Black residents represent 14% of the Michigan population27, they account for 21% of COVID-19 cases and 37% of deaths attributed to COVID-1926. Similar trends are observed in New York9 and other states, where there is an overrepresentation of Black and Latinx people in COVID-19 cases and deaths23.
Overrepresentation of minority populations in poorer COVID-19 outcomes may be explained by a myriad of factors, such as by weathering, or early health deterioration due to cumulative impact of socioeconomic disparity28–30, higher comorbidity burden31, inadequate healthcare31, and socioeconomic differences related to unemployment, food insecurity, and housing instability29,30. Several studies have reported being racial/ethnic minority, male sex, old age, currently smoking, and having comorbidity burden as having higher risk of COVID-19 susceptibility and hospitalization2,14,16,32–36. Racial/ethnic minorities who maintain livelihoods as essential workers are more likely to be exposed to the virus23,25, whereas living in high density areas1, high proportion of homelessness37 and incarceration38 adds to the barriers to social distancing15,23.
Although studies have reported some explanation for these disparities, the substantial evidence supporting the observed disparity in COVID-19 outcomes with appropriate covariates and comparison groups remains limited17, which calls for in-depth studies to explain the underlying reasons, while controlling for confounding effects such as socioeconomic status7,22,24,29,39,40. In addition, experiences from COVID-19 highlight the need to not only identify risk factors, but also to avoid spurious conclusions of racial/ethnic differences being explained by biology, which could further perpetuate racial/ethnic stereotypes29. Additionally, some previous studies have compared those who tested positive for COVID-19 to those who are negative, instead of population-based comparative groups, where selection bias is potentially at play41,42.
The objective of this study is to systematically determine sociodemographic and comorbid conditions that are associated with COVID-19 outcomes (testing positive, hospitalization, admission to ICU, and mortality) by race, utilizing electronic health records (EHR) from the University of Michigan Health System, which serves a large patient population in the US Midwest.
Subjects and Methods
COVID-19 cohort
We extracted the EHR data for patients tested for COVID-19 at the University of Michigan Health System, also known as Michigan Medicine (MM). Our study cohort consisted of 5,698 tested/diagnosed patients, including 5,548 patients who were tested at MM from March 10, 2020 to April 22, 2020, 119 transfer patients from other hospitals and 31 patients who were tested elsewhere, but were treated at MM. The selected cohort is a non-random sample of the population, since the testing protocol at MM focused on prioritized testing43 (e.g., testing symptomatic patients and those at the highest risk of exposure). Our “positive” cohort contained 1,139 patients who were tested/diagnosed positive. We updated the COVID-19 outcomes of the study cohort through July 28, 2020.
COVID-19 exposure
Four types of diagnostic tests were employed in the tested cohort at MM, including an in-house polymerase chain reaction (PCR) test (91.2%), Viracor’s commercial antibody test (7.6%), COVID-19 tests deployed by the Michigan Department of Health and Human Services (1%) and a small fraction of tests carried out in external labs (0.2%).
Comparative group selection
To understand how selection bias factored into our tested sample, in addition to comparing COVID-19 positive patients with those testing negative, we created an untested comparison group (n=7,168) from the MM database, a similar-sized random sample of contemporaneous patients. We initially extracted 20,000 random individuals before limiting the group to 7,211 patients who were alive at the time of data extraction (April 22, 2020) and have had encounters with the health system after April 22, 2012. At the time of updating COVID-19 outcomes (July 28, 2020), we further excluded 43 patients who were tested since the initial data extraction, and achieved the final sample size of 7,168. The University of Michigan Medical School Institutional Review Board (IRB) has reviewed the study and determined that it is exempt from ongoing IRB review. The IRB waived the need for ethics approval and the need to obtain consent for the collection, analysis and publication of the anonymized COVID-19 data (HUM00180294).
Description of variables
A summary data dictionary, eTable 1 in Supplement, is available with source and definition of each variable used in our analysis.
COVID-19 prognosis outcomes
eFigure 1 in Supplement presents a flow diagram of sample sizes corresponding to each COVID-19 outcomes used in this study. Among the positive cohort, we considered various stages of progression of the disease based on the admission and discharge data including hospitalization, ICU care, and death. Hospitalizations were defined by inpatients with COVID-19 diagnosis, where the admission date was within the time frame of the data update (March 10 to July 28, 2020). ICU patients were defined as patients who were admitted to ICU any time during their COVID-19 related hospitalization. Mortality data, including inpatient and non-hospitalized deaths, was extracted from patient EHR, defined as death that had occurred after a confirmed positive COVID-19 laboratory test.
Classifying patients who were still in hospital and ICU
A total of 21 patients were still admitted in the hospital (non-ICU, n=3) or were still in an ICU (n=19) at the time of the data update (July 28, 2020). A sensitivity analysis showed similar results after excluding these patients whose final prognostic outcome is unclear (still in hospital/ICU) from the analysis (results not shown here).
Generation of comorbidities from electronic health records
Based on CDC guidelines on risk factors for COVID-1944 and previous studies34,45,46, we constructed COVID-related comorbid conditions using available International Classification of Diseases (ICD; ninth and tenth editions) code for 23,769 individuals (tested/diagnosed: 5,225; untested comparison group: 6,811) from their EHR. Longitudinal time-stamped diagnoses were recoded to indicator variables for whether a patient ever had a given diagnosis code recorded by MM. To differentiate pre-existing conditions from diagnoses related to COVID-19 testing/treatment, we applied a 14-day-prior restriction on the tested cohort by removing diagnoses that first appeared within the 14 days before the first test or diagnosis date, whichever was earlier (4,998 of the 5,225 tested individuals had diagnoses data after enforcing the 14-day-prior restriction). We focused on seven binary disease indicators that have been specifically mentioned in relation to COVID-19 outcomes34,35,44,47–49: respiratory, circulatory, any cancer, type 2 diabetes, kidney, liver, and autoimmune diseases (ICD codes in eTable 1 in Supplement). We calculated a comorbidity score as the sum of these seven that ranges from 0–7. This score was used as an adjustment/risk factor capturing the general health status.
Defining SES and other adjustment covariates
Self-reported sex, race/ethnicity, smoking status, alcohol consumption, body mass index (BMI), and age were extracted from the EHR. We classified patients to be seeking primary care in MM if they had at least one encounter in any of the primary care locations in MM since January 1, 2018. Measures of socioeconomic characteristics are defined by US census tract (based on residential address available in each patient’s EHR) for the year 2010. The boundaries for the census tracts were normalized to 2010 tract boundaries using the Longitudinal Tract Data Base50. Following Clarke et al.51, we evaluated three composite indices, neighborhood disadvantage, neighborhood affluence and ethnic and immigrant concentration calculated routinely in the National Neighborhood Data Archive (NaNDA, a publicly available data source to measure physical and social environment52). Because the results that adjust for all three indices were similar to the results that adjust for only the first index – the 2010 Neighborhood Socioeconomic Disadvantage Index (NDI, without proportion Black residents) - we used the NDI as a marker of neighborhood SES in this study. The NDI is defined as the mean of the proportion of the population that are in poverty, unemployed, using public assistance income, and female-headed families with children). We also included population density per square mile as a covariate in the susceptibility models52.
Statistical analysis
Since all outcomes were binary, we performed logistic regression to assess the risk factors of COVID-19 outcomes. We reported Firth bias-corrected estimates of the odds ratio to address potential separation issues, with their corresponding 95% Wald-type confidence interval and P-value. Four nested covariate adjustments were explored to check the robustness of inference to the choice of potential confounders (see eTable 4 in Supplement). The final adjustment model we used included age, sex, race/ethnicity, (persons per mile2), NDI and comorbidity score. We used persons per mile2 only in getting tested and susceptibility model and we refrained from using the composite comorbidity score when examining association with individual comorbidities.
The analysis model is expressed as follows:
where X is the variable/risk factor of interest, and Covariate denotes the vector of covariates. Here YCOVID is three different types of COVID-19 related outcomes under consideration:
Predictors of being tested: comparing the tested cohort with those who were not tested for COVID-19 (using a randomly selected untested comparison group).
Predictors of COVID-19 susceptibility: comparing the positive cohort with those who were not diagnosed with COVID-19 (using an untested comparison group and the tested negative comparison group).
Predictors of COVID-19 prognostic outcomes (no comparison group involved): among the positive cohort: (i) comparing those who were hospitalized with those who were not, (ii) those who were admitted to ICU with those who were not, and (iii) those who were deceased with those who were not.
In addition, we carried out a set of interaction analyses by race using the following model to evaluate the difference between White and Black patients:
where race included four categories - White, Black, other known race/ethnicity, and unknown race/ethnicity. We reported the sub-group effects for White and Black patients using this model, as well as their difference by testing H0: βint = 0. The P-value for interaction tests are denoted by Pint.
All analyses were performed in R version 3.6.2 (R Foundation for Statistical Computing). Statistical significance was defined using a 2-sided significance level of α = .05. Missing data were handled by using a complete case analysis which leads to unbiased inference when the covariates are missing completely at random (MCAR). Sensitivity analysis can be found in eTable 5 and 6 in Supplement.
Results
Descriptive Statistics
Our tested cohort contained 5,698 patients (median age, 48 years [IQR, 31]; mean age, 47.4 years [SD, 20.9]; 38% male; mean BMI 30 [SD, 8]), of which 1,139 (20.0%) were COVID-19 positive (Table 1). In the tested cohort, 3,172 (55.7%) had primary care at MM. A majority of those tested were either White (3,740; 65.6%) or Black (1,058, 29.9%). Among the 1,139 positive patients, 523 (45.9%) were hospitalized, 283 (24.8%) were admitted to ICU, and 88 (7.7%) died. As the disease progressed among positives (from non-hospitalized to hospitalized, ICU, and deceased), the proportion of older age (65 and above), male sex, being a former/current smoker and alcohol consumption, consistently increased. BMI showed an increasing trend from non-hospitalized to hospitalized and ICU but not in those who died. The descriptive trends of both the tested cohort and the positive cohort indicate higher enrichment of underlying medical conditions. Missingness information corresponding to each variable can be found in eTable 2A in Supplement.
Table 1.
Descriptive Characteristics of the COVID-19 Tested/Diagnosed Cohort
| COVID-19 Tested | Comparison Group (n=7,168) | |||||||
|---|---|---|---|---|---|---|---|---|
| Overall (n=5,698) | Negative (n=4,559) | COVID-19 Positive | ||||||
| Overall (n=1,139) | Hospitalized (n=523) | ICU (n=283) | Deceased (n=88) | |||||
| Variable | No. (%) | |||||||
| Age (in years) | mean (SD) | 47.40 (20.9) | 46.00 (21.31) | 53.01 (17.9) | 60.64 (16.6) | 59.98 (16.5) | 71.70 (13.5) | 43.1 (24.1) |
| median (IQR) | 48 (31) | 46 (31) | 53 (27) | 62 (23) | 62 (20) | 73 (18) | 43.0 (40) | |
| Age Range | [0,18) | 373 (6.5) | 364 (8.0) | 9 (0.8) | 4 (0.8) | 3 (1.1) | 0 (0.0) | 1,661 (23.2) |
| [18,35) | 1,295 (22.7) | 1,092 (24.0) | 203 (17.8) | 38 (7.3) | 26 (9.2) | 2 (2.3) | 1,254 (17.5) | |
| [35,50) | 1,364 (23.9) | 1,107 (24.3) | 257 (22.6) | 83 (15.9) | 36 (12.7) | 5 (5.7) | 1,178 (16.4) | |
| [50,65) | 1,381 (24.2) | 1,032 (22.6) | 349 (30.6) | 171 (32.7) | 96 (33.9) | 16 (18.2) | 1,412 (19.7) | |
| [65,80) | 926 (16.3) | 693 (15.2) | 233 (20.5) | 154 (29.4) | 91 (32.2) | 31 (35.2) | 1,206 (16.8) | |
| [80,100) | 359 (6.3) | 271 (5.9) | 88 (7.7) | 73 (14.0) | 31 (11.0) | 34 (38.6) | 454 (6.3) | |
| Male Sex | 2,167 (38.0) | 1,636 (35.9) | 531 (46.6) | 294 (56.2) | 169 (59.7) | 56 (63.6) | 3,257 (45.4) | |
| Primary Care in MM | 3,172 (55.7) | 2,597 (57.0) | 575 (50.5) | 161 (30.8) | 85 (30.0) | 24 (27.3) | 1,117 (15.6) | |
| BMI, mean (SD) | 30 (8.0) | 29.4 (7.5) | 32.2 (9.3) | 33.1 (10.8) | 33.9 (12.3) | 31.8 (7.6) | 28.5 (7.05) | |
| BMI Range | <18.5 | 83 (1.7) | 74 (1.9) | 9 (0.9) | 5 (1.0) | 2 (0.7) | 1 (1.2) | 85 (1.2) |
| [18.5, 25) | 1,300 (26.3) | 1,125 (28.9) | 175 (16.7) | 63 (12.6) | 37 (13.5) | 13 (15.5) | 1,329 (18.5) | |
| [25, 30) | 1,476 (29.9) | 1,157 (29.8) | 319 (30.4) | 163 (32.7) | 81 (29.6) | 28 (33.3) | 1,213 (16.9) | |
| >=30 | 2,077 (42.1) | 1,531 (39.4) | 546 (52.0) | 268 (53.7) | 154 (56.2) | 42 (50.0) | 1,370 (19.1) | |
| Ever-Smoker | 1,949 (38.3) | 1,627 (39.4) | 322 (33.5) | 162 (38.0) | 90 (44.1) | 34 (64.2) | 1,656 (23.1) | |
| Smoking Status | Never-Smoker | 3,144 (61.7) | 2,506 (60.6) | 638 (66.5) | 264 (62.0) | 114 (55.9) | 19 (35.8) | 3,673 (51.2) |
| Past-Smoker | 1,522 (29.9) | 1,239 (30.0) | 283 (29.5) | 153 (35.9) | 86 (42.2) | 34 (64.2) | 1,084 (15.1) | |
| Current-Smoker | 427 (8.4) | 388 (9.4) | 39 (4.1) | 9 (2.1) | 4 (2.0) | 0 (0.0) | 572 (8.0) | |
| Alcohol Consumption, No. (%) | 2,774 (66.7) | 2,302 (67.0) | 472 (65.2) | 170 (62.5) | 90 (65.7) | 27 (65.9) | 2,171 (30.3) | |
| Race Ethnicity | White | 3,740 (65.6) | 3,248 (71.2) | 492 (43.2) | 190 (36.3) | 101 (35.7) | 35 (39.8) | 3,573 (49.8) |
| Black | 1,058 (18.6) | 616 (13.5) | 442 (38.8) | 233 (44.6) | 132 (46.6) | 36 (40.9) | 391 (5.5%) | |
| Other | 544 (9.5) | 423 (9.3) | 121 (10.6) | 51 (9.8) | 19 (6.7) | 3 (3.4) | 531 (7.4%) | |
| Unknown | 356 (6.2) | 272 (6) | 84 (7.4) | 49 (9.4) | 31 (11) | 14 (15.9) | 2,673 (37.3%) | |
| SES, mean (SD) | NDI | 0.11 (0.08) | 0.1 (0.08) | 0.12 (0.09) | 0.13 (0.1) | 0.14 (0.1) | 0.14 (0.09) | 0.11 (0.08) |
| Persons per Mile2 | 2,650 (2337.5) | 2,541 (2328.6) | 3,160 (2313.1) | 3,608 (2564.1) | 3,719 (2462.5) | 3,936 (2619.2) | 2,330 (2,530) | |
| Comorbidity Score, mean (SD) | 2.6 (1.6) | 2.5 (1.6) | 2.6 (1.6) | 3.2 (1.6) | 3.3 (1.6) | 3.9 (1.5) | 1.29 (1.24) | |
Abbreviations: MM, Michigan Medicine; BMI, body mass index; SES, residential-level socioeconomic characteristics; Other Race/Ethnicity included Caucasian/Hispanic or unknown, African American/Hispanic or unknown, Asian/Hispanic or non-Hispanic or unknown, Native American/Hispanic or non-Hispanic or unknown, Pacific Islander/Hispanic or non-Hispanic or unknown, and other/Hispanic or non-Hispanic or unknown; Unknown Race/Ethnicity included missing race and/or ethnicity; SES, residential-level socioeconomic characteristics; NDI, the 2010 Neighborhood Socioeconomic Disadvantage Index.
Note: percentages are reported as fraction of column totals excluding missing entries (see eTable 2A in Supplement).
Descriptive statistics stratified by White and Black patients (eTable 2B in Supplement) show differences in COVID-19 outcomes across these two groups that we capture in Figure 1. The test-positive rate was significantly higher among Black patients compared with White patients (41.8% vs. 13.2%, P<.001). Similar trends were noted for hospital admission (52.7% vs. 38.6%, P<.001) and ICU care (29.9% vs. 20.5%, P<.001). No mortality differences by race were noted (8.1% vs. 7.1%, P=.86).
Figure 1. COVID-19 Outcomes by Race/Ethnicity.

Abbreviations: ICU, intensive care unit; OR, odds ratio.
* Chi-squared test P<.001, comparing the proportion between White and Black patients.
+ Logistic regression with Firth correction.
a Multivariable logistic regression with adjustment 1 (age, gender, race/ethnicity; testing positive also adjusted for persons per mile2).
b Multivariable logistic regression with adjustment 2 (adjustment 1 + Neighborhood Disadvantage Index [NDI]).
c Multivariable logistic regression with adjustment 3 (adjustment 2 + the comorbidity score).
Association Analysis of COVID-19 Outcomes Using Multivariable Logistic Regression
Factors Associated with Getting Tested
Due to limited test availability, the testing guidelines varied during the time of the study43. Overall, younger age, male sex, current-smoker, higher NDI (lower SES) were associated with a reduced chance of getting tested whereas Black patients, pasts-moker, overweight and obese (BMI over 25), alcohol consumption, higher population density and higher comorbidity burden were associated with higher change of getting tested (eTable 3 in Supplement).
Factors Associated with being Positive or with COVID19 Susceptibility
Full cohort:
We identified the following factors that differed between testing positive for COVID-19 and the untested comparison group: Black vs White odds ratio (OR) was 6.11 (95% CI, 4.83–7.73; P<.001); every 10-year increase in age (OR, 1.09 [95% CI, 1.05–1.14]; P<.001), higher BMI (OR, 1.03 [95% CI, 1.02–1.04]; P<.001), and alcohol consumption (ever vs. never; OR, 1.58 [95% CI, 1.29–1.95]; P<.001) (Table 2). Being a current smoker (self-reported in the latest EHR encounter) was associated with a reduced chance of testing positive (OR, 0.31 [95% CI, 0.20–0.48]; P<.001). In addition, population density was associated with testing positive (OR, 1.12 [95% CI, 1.08–1.16]; P<.001). Table 2 also indicates that higher comorbidity burden and comorbidities such as respiratory conditions were associated with testing positive (P<.001). Conversely, a naïve comparison between those who tested positive versus those tested negative showed increase likelihood of testing negative for those with a higher comorbidity burden (OR, 0.9 [95% CI, 0.85–0.95]; P<.001) and pre-existing kidney disease (OR, 0.62 [95% CI, 0.50–0.77]; P<.001).
Table 2.
Odds Ratio of Susceptibility and Prognostic Outcomes in Full Cohort using Logistic Regression
| Susceptibility | Prognosis | ||||
|---|---|---|---|---|---|
| Positive (1) vs. Untested (0) (n0=5611, n1=761) | Positive (1) vs. Negative (0) (n0=3656, n1=761) | Hospitalized (1) vs. Not (0) (n0=486, n1=270) | ICU (1) vs. Not (0) (n0=615, n1=141) | ||
| Variable | OR (95% CI) | ||||
| Age (unit: 10-year) | 1.09 (1.05, 1.14) | 1.2 (1.15, 1.26) | 1.72 (1.53, 1.93) | 1.45 (1.27, 1.65) | |
|
Age Range REF: [18,35) |
[0,18) | 0.06 (0.03, 0.15) | 0.13 (0.05, 0.31) | 5.01 (0.57, 44.3) | 8.75 (0.90, 85.2) |
| [35,50) | 1.56 (1.03, 2.37) | 1.23 (0.85, 1.76) | 0.75 (0.32, 1.77) | 0.72 (0.25, 2.10) | |
| [50,65) | 1.59 (0.82, 3.11) | 2.38 (1.30, 4.34) | 0.72 (0.20, 2.53) | 0.86 (0.19, 3.87) | |
| [65,80) | 1.20 (0.46, 3.09) | 2.53 (1.06, 6.02) | 0.58 (0.10, 3.44) | 0.71 (0.09, 5.68) | |
| [80,100) | 1.32 (0.38, 4.60) | 2.94 (0.93, 9.30) | 1.15 (0.10, 13.1) | 0.64 (0.04, 10.1) | |
| Male Sex | 0.90 (0.76, 1.07) | 1.54 (1.31, 1.82) | 1.91 (1.36, 2.68) | 2.25 (1.52, 3.34) | |
| BMI | 1.03 (1.02, 1.04) | 1.03 (1.02, 1.05) | 1.04 (1.01, 1.06) | 1.03 (1.01, 1.06) | |
|
BMI Range REF: [18,25) |
<18.5 | 0.65 (0.27, 1.54) | 0.67 (0.29, 1.58) | 1.8 (0.24, 13.6) | 2.09 (0.22, 20.3) |
| [25, 30) | 1.62 (1.25, 2.10) | 1.44 (1.13, 1.83) | 2.20 (1.23, 3.94) | 1.59 (0.79, 3.21) | |
| >=30 | 1.70 (1.33, 2.18) | 1.78 (1.42, 2.24) | 2.43 (1.38, 4.30) | 2.17 (1.10, 4.26) | |
| Ever-Smoker | 0.73 (0.59, 0.89) | 0.69 (0.57, 0.83) | 1.11 (0.77, 1.60) | 1.36 (0.90, 2.07) | |
|
Smoking Status REF: Never-Smoker |
Past-Smoker | 0.92 (0.74, 1.14) | 0.89 (0.67, 0.99) | 1.21 (0.83, 1.77) | 1.47 (0.96, 2.24) |
| Current-Smoker | 0.31 (0.20, 0.48) | 0.31 (0.20, 0.47) | 0.51 (0.17, 1.52) | 0.67 (0.17, 2.64) | |
| Alcohol Consumption | 1.58 (1.29, 1.95) | 0.95 (0.79, 1.14) | 0.83 (0.56, 1.23) | 1.10 (0.69, 1.74) | |
|
Race / Ethnicity REF: White |
Black | 6.11 (4.83, 7.73) | 3.56 (2.90, 4.37) | 1.72 (1.15, 2.58) | 1.15 (0.73, 1.82) |
| Other | 1.67 (1.26, 2.23) | 1.57 (1.19, 2.06) | 1.42 (0.79, 2.54) | 0.86 (0.42, 1.78) | |
| Unknown | 0.11 (0.08, 0.17) | 0.78 (0.51, 1.20) | 0.72 (0.28, 1.84) | 0.60 (0.18, 2.04) | |
| SES | NDI | 0.04 (0.01, 0.14) | 0.94 (0.30, 2.95) | 5.51 (0.74, 41.1) | 13.7 (1.46, 128) |
| Persons / Mile2 (unit: 1000-person) | 1.12 (1.08, 1.16) | 1.07 (1.03, 1.11) | 1.10 (1.01, 1.19) | 1.08 (0.99, 1.19) | |
| Comorbidity Score | 1.64 (1.54, 1.75) | 0.90 (0.85, 0.95) | 1.15 (1.03, 1.29) | 1.16 (1.02, 1.32) | |
| Comorbidities* | Respiratory | 4.09 (3.36, 4.97) | 0.90 (0.73, 1.09) | 0.81 (0.53, 1.23) | 0.98 (0.60, 1.61) |
| Circulatory | 2.85 (2.34, 3.47) | 0.69 (0.57, 0.85) | 1.35 (0.87, 2.08) | 1.21 (0.71, 2.05) | |
| Any Cancer | 1.18 (0.96, 1.45) | 0.76 (0.63, 0.92) | 0.90 (0.61, 1.32) | 0.93 (0.60, 1.44) | |
| Type 2 Diabetes | 2.01 (1.61, 2.50) | 1.07 (0.87, 1.30) | 1.82 (1.25, 2.64) | 1.50 (0.99, 2.28) | |
| Kidney | 2.82 (2.18, 3.66) | 0.62 (0.50, 0.77) | 2.87 (1.87, 4.42) | 2.74 (1.76, 4.26) | |
| Liver | 3.33 (2.42, 4.57) | 0.80 (0.62, 1.04) | 0.997 (0.59, 1.68) | 0.95 (0.52, 1.73) | |
| Autoimmune | 2.44 (1.94, 3.06) | 0.95 (0.78, 1.15) | 1.24 (0.83, 1.85) | 1.45 (0.92, 2.29) | |
Abbreviations: n1, sample size for COVID outcome patients; n0, sample size for comparative group; OR, odds ratio; BMI, body mass index; REF, reference group; Other Race/Ethnicity included Caucasian/Hispanic or unknown, African American/Hispanic or unknown, Asian/Hispanic or non-Hispanic or unknown, Native American/Hispanic or non-Hispanic or unknown, Pacific Islander/Hispanic or non-Hispanic or unknown, and other/Hispanic or non-Hispanic or unknown; SES, residential-level socioeconomic characteristics; NDI, 2010 Neighborhood Socioeconomic Disadvantage Index.
Note: The model results were from Firth-corrected multivariable logistic regression logit P(YCOVID = 1|X, Covariate) = β0 + βXX +βCOVCovariate, where YCOVID is the COVID-19 outcomes (i.e. tested positive, hospitalization and ICU admission); race includes four categories (White, Black, other known ethnicity, and unknown ethnicity); Covariate= age + sex + race +NDI + comorbidity score (+persons per mile2 in susceptibility model); green represents significant OR<1 (protective effect), yellow represents significant OR>=1 (risk effect) under the threshold P<.05.
When X represents an individual comorbidity, the model did not adjust for the composite comorbidity score.
Comparing White vs Black Patients:
Although being obese (BMI over 30) was associated with testing positive in both races (White: OR, 1.37 [95% CI, 1.01–1.84]; P=.04. Black: OR, 3.11 [95% CI, 1.64–5.90]; P<.001), it had stronger association in Black patients (Pint=.02) (Figure 2). Having autoimmune diseases was associated with testing positive in both races (White: OR, 3.15 [95% CI, 2.38–4.17]; P<.001. Black: OR, 1.56 [95% CI, 1.02–2.38]; P=.04), but with stronger association in White patients (Pint=.006). Having any cancer was associated with testing positive in Black patients only (OR, 1.82 [95% CI, 1.19–2.75]; P=.005) and not in White patients (Pint=.04).
Figure 2. Forest Plot of COVID-19 Susceptibility Odds Ratio for White and Black Patients and P-Values for test of Interaction.
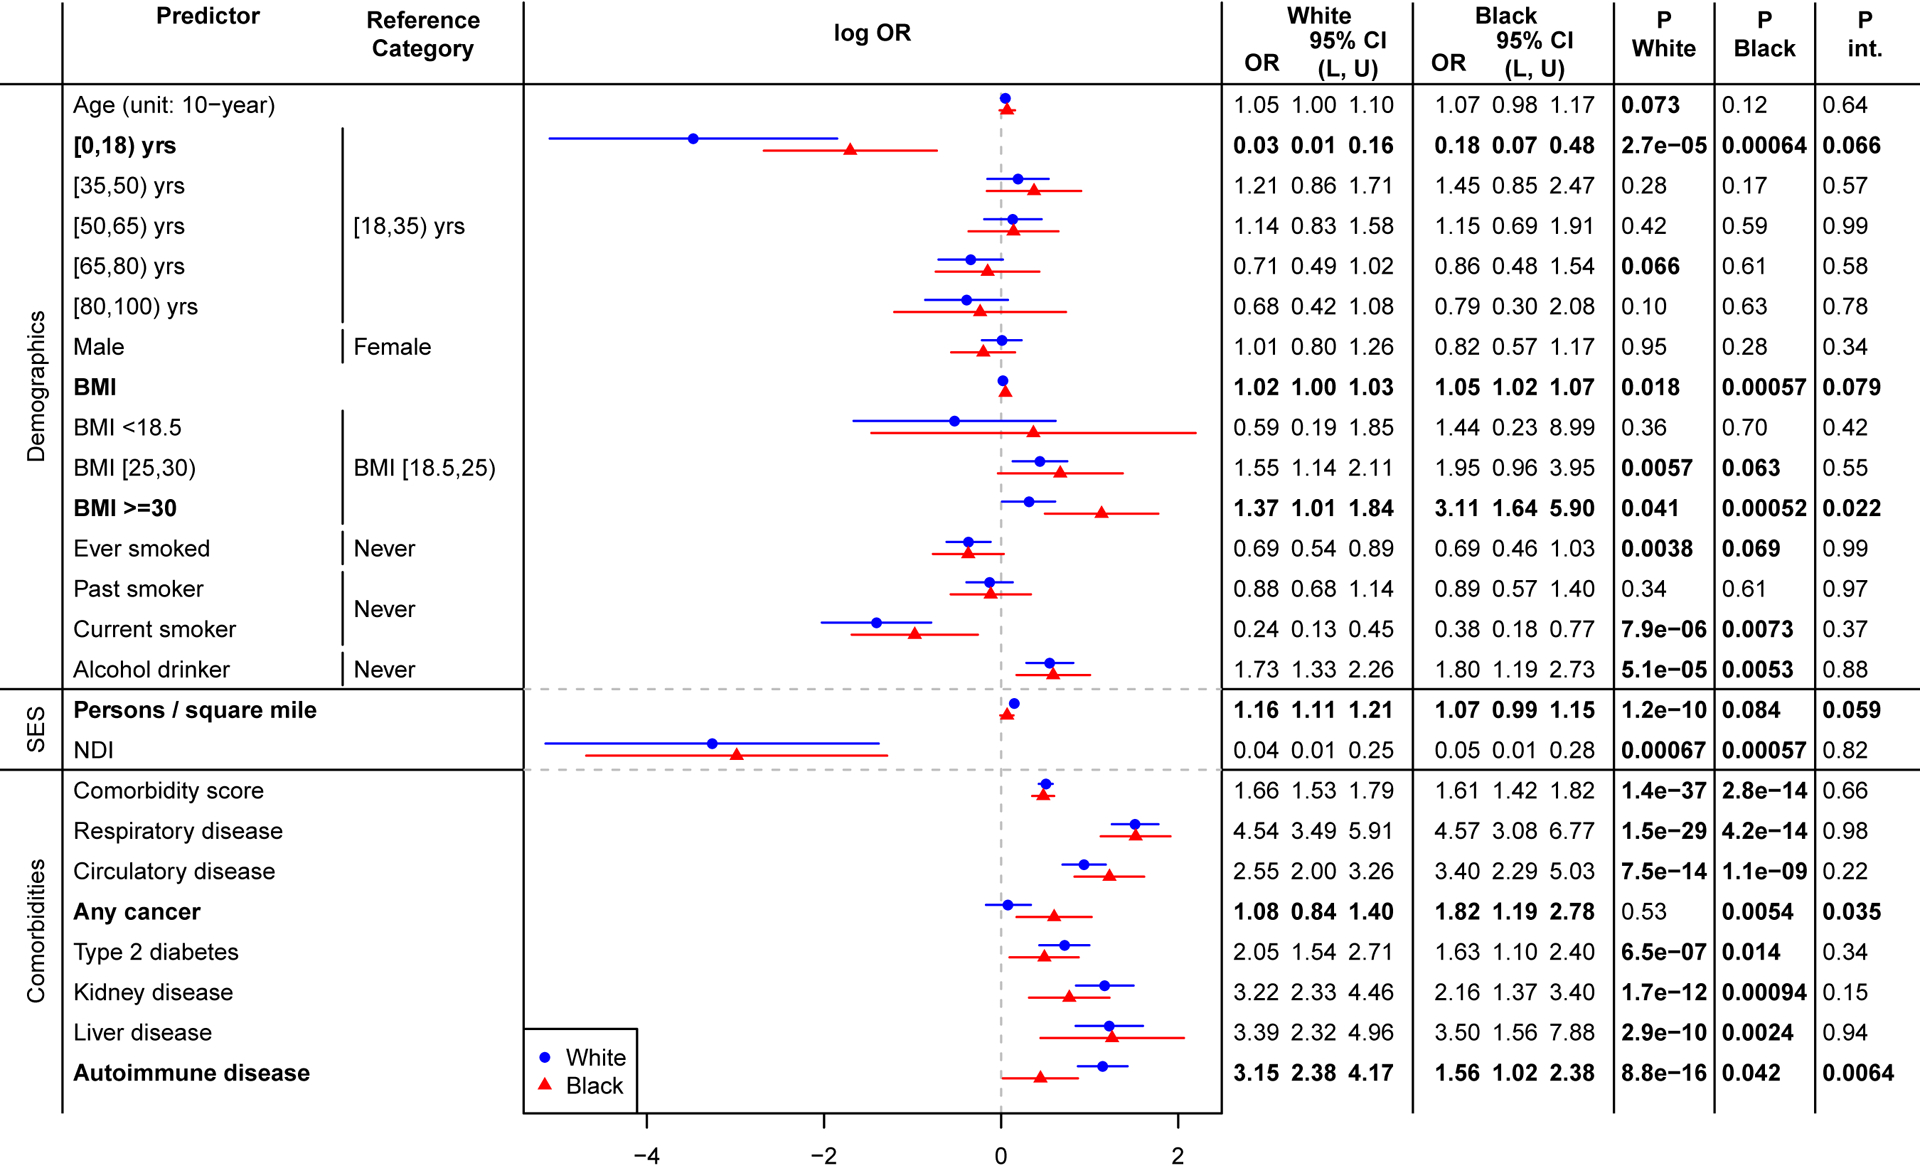
The results were from model logit P(YCOVID = 1|X, Covariate) = β0 + βXX + βRaceRace + βintX × Race + βcovCovariate where Covariate = age + sex + NDI (+ comorbidity score in demographics and SES models). P.White and P.Black represent the P-value of sub-group effects for White and Black patients, respectively. P.int represents the P-value for testing H0: βint = 0, testing for significant difference between White and Black patients.
Factors Associated with Prognosis among COVID-19 Positive Patients
Full Cohort:
Among the COVID-19 positive cohort, Black patients were 1.72 (95% CI, 1.15–2.58; P=.009) times more likely to be hospitalized (Table 2), shown in Figure 1. There was no significant difference in ICU admission by race after adjusting for covariates (P=.55). Higher population density was associated with higher chance of hospitalization (OR of every 1000-person increase per mile2, 1.10 [95% CI, 1.01–1.09]; P=.02), whereas older age, male sex and obesity consistently showed strong association with poor prognosis. Type 2 diabetes (OR, 1.82 [95% CI 1.25–2.64]; P=.002) and kidney disease (OR, 2.87 [95% CI, 1.87–4.42]; P<.001) stood out as the strongest risk factors for hospitalization amongst the seven comorbidities, whereas kidney disease was also associated with ICU admission (OR, 2.74 [95% CI, 1.76–4.26]; P<.001).
Comparing White vs Black Patients:
Higher comorbidity burden was associated with hospitalization and ICU admission in White patients (hospitalization: OR, 1.30 [95% CI, 1.11–1.53; P=.001]; ICU: OR, 1.43 [95% CI, 1.19–1.73; P<.001]), but not in Black patients (hospitalization, Pint=.02; ICU, Pint=.008) (Figure 3). Moreover, type 2 diabetes showed stronger associated with hospitalization in White patients (OR, 2.59 [95% CI, 1.49–4.48]; P<.001) compared to Black patients (Pint=.046). Although no significant risk association was identified in either race, we identified a significant interaction indicating stronger association with ICU admission in White patients for the following pre-existing comorbidities: respiratory disease (OR, 2.23 [95% CI, 0.96–5.19]; P=.06 and Pint=.01) and any cancer (OR, 1.47 [95% CI, 0.82–2.63]; P=.20 and Pint=.03).
Figure 3. Forest Plot of COVID-19 Prognosis Odds Ratio for White and Black Patients and P-Values for test of Interaction.
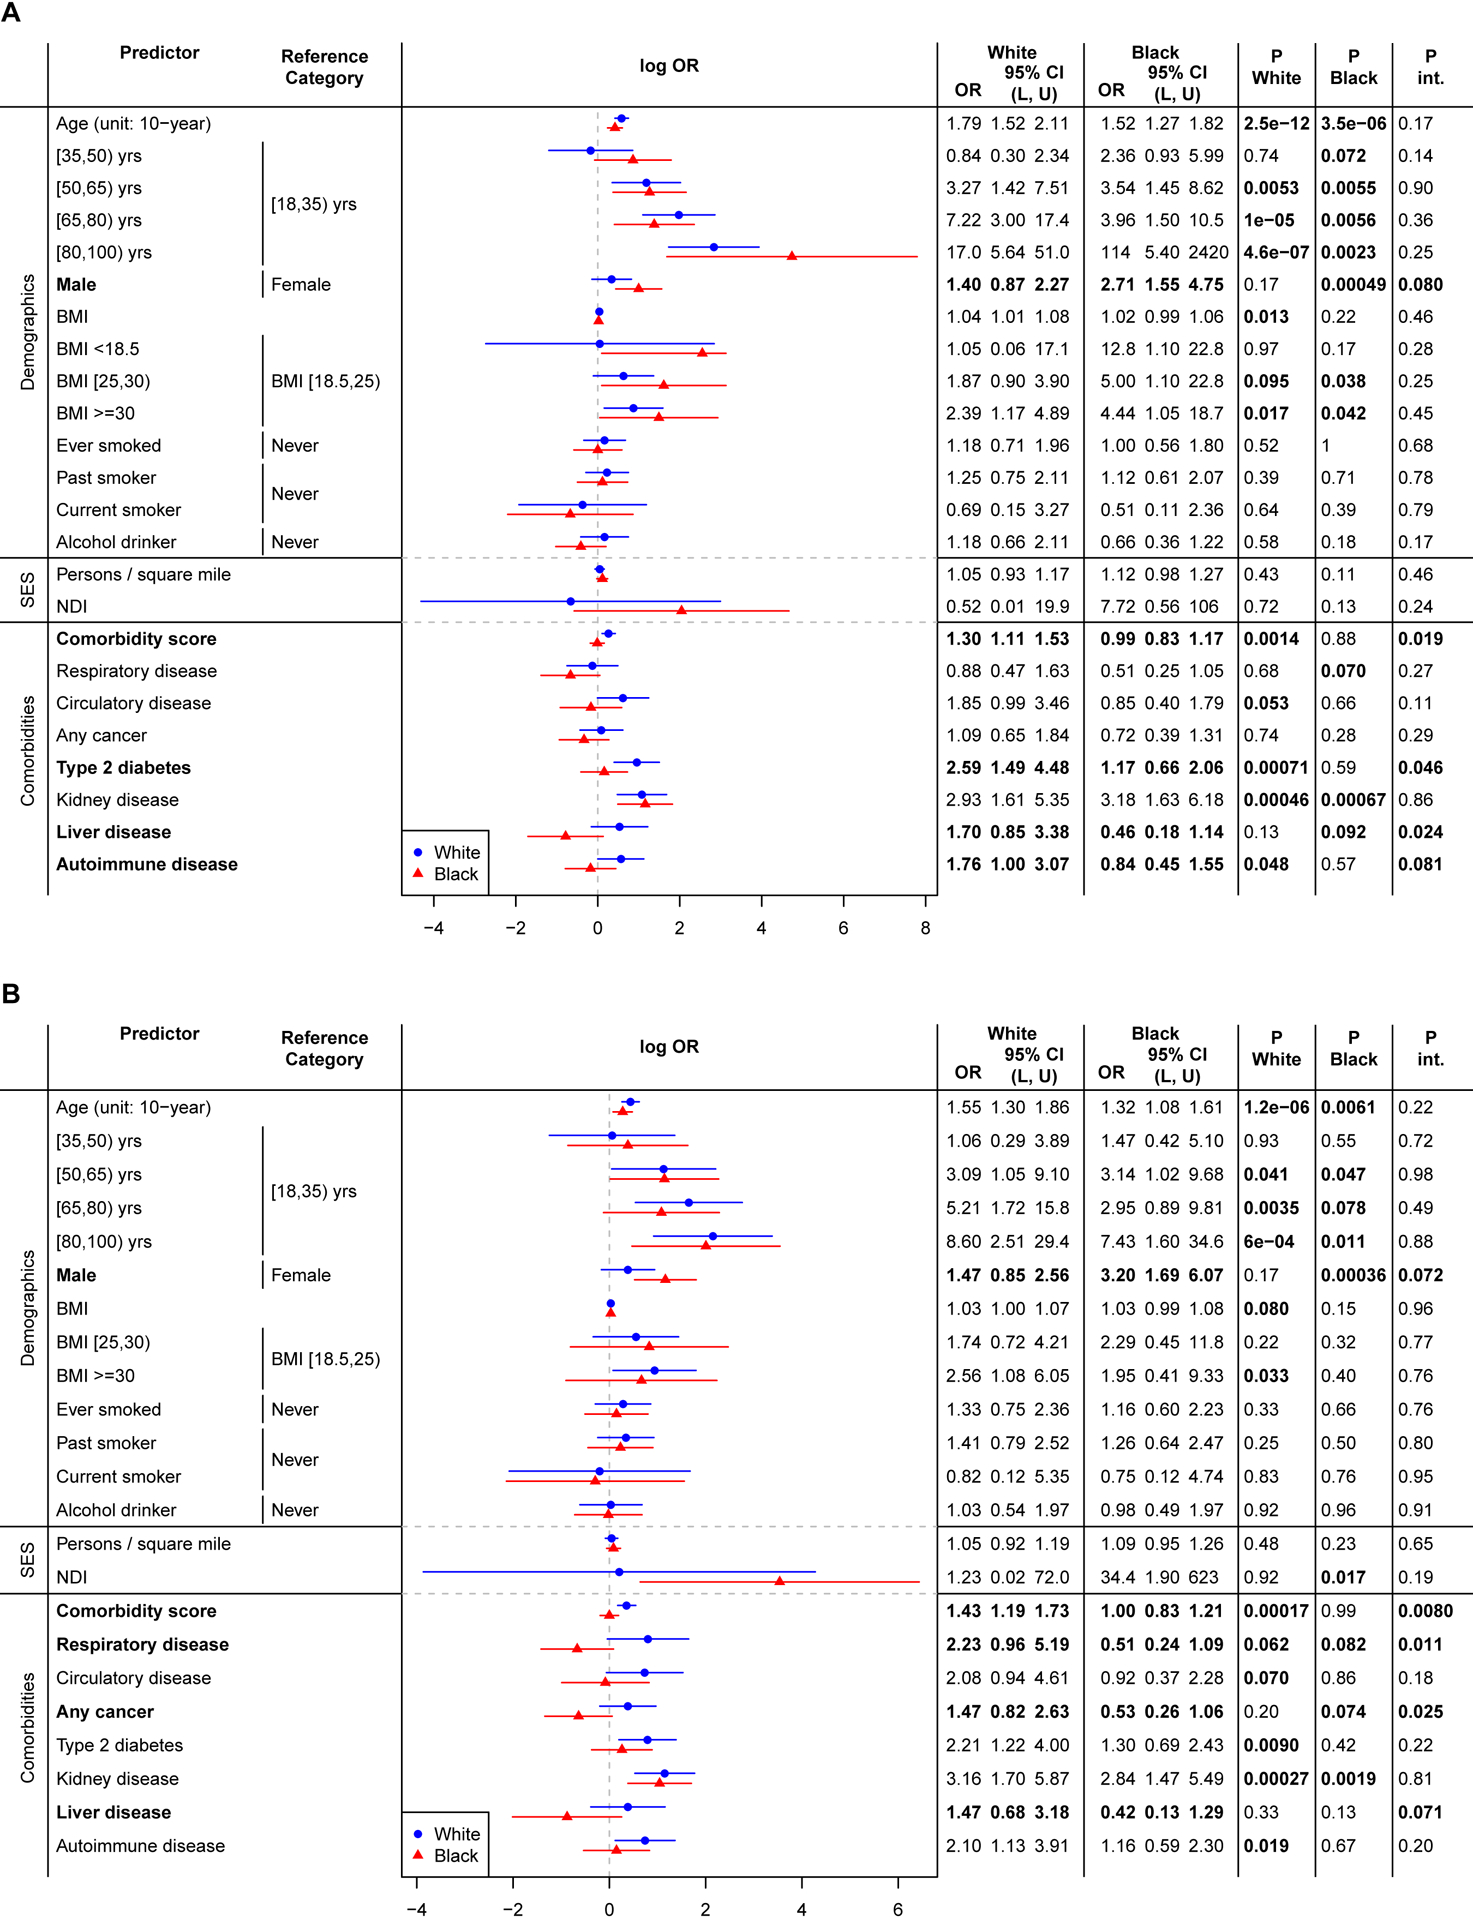
The results were from model logit P(YCOVID = 1|X, Covariate) = β0 + βXX + βRaceRace + βintX × Race + βcovCovariate where YCOVID=Yhospitalization in panel A and YCOVID=YICU in panel B, Covariate = age + sex + NDI (+ comorbidity score in demographics and SES models). P.White and P.Black represent the P-value of sub-group effects for White and Black patients, respectively. P.int represents the P-value for testing H0: βint = 0, testing for significant difference between White and Black patients.
Discussion
This cohort study adds to the growing literature on using patient residential-level SES, sociodemographic factors, and health conditions from EHR data to uncover potential risk factors for observed racial disparities in COVID-19 susceptibility and prognosis. While there were significant differences in testing positive and hospitalization rates by race, there were no significant racial disparities noted in odds of poor outcomes (ICU admission and mortality) after adjustment of covariates based on our data, a result consistent with Yehia et al.53. Higher comorbidity burden was associated with poor prognosis overall, with differential effects between races. Supplementary analysis (data not shown) indicated that among COVID-positive patients, Black patients had a significantly higher comorbidity score prior to COVID testing compared to White patients and had a higher symptom burden at the time of getting tested.
Testing and outcome data from integrated health systems, such as MM in combination with neighborhood SES data derived from the census, is useful in quantifying the risk factors for COVID-19 and associated disparities. Our association results do not explain why there are racial differences in COVID-19 outcomes, thus, the idea of structural factors influencing health is pivotal. This cohort study’s novel contributions include: comparison of COVID-19 tested positive population with a random subset of the MM population to avoid the biased sampling of who gets tested for COVID-19, and consideration of outcomes related to both susceptibility and prognosis. Lastly, we present a comprehensive analytic framework that attempts to adjust for an expanded set of potential confounders with suitably chosen comparison groups, a critical need when characterizing differences in White and Black patients.
Due to the prioritized testing protocols, there may be many asymptomatic or mildly symptomatic patients in the randomly chosen comparison group who never got tested but actually had the infection. Therefore, the comparison results between the positive and the unmatched control reveals the fact that in general, individuals with pre-existing health conditions had higher risk of developing severe disease outcomes after being infected with COVID-19. In contrast, a naïve comparison between the positive and the negative in the tested population leads to counterintuitive findings, such as protective effect of higher comorbidity burden (OR, 0.9 [95% CI, 0.85–0.95]; P<.001) and pre-existing kidney disease (OR, 0.62 [95% CI, 0.50–0.77]; P<.001), contradicting findings in other COVID-19 studies41,42. This amplifies the need for choosing an appropriate comparison group. Alternatively, if the appropriate comparison group is not available, one can consider creating a model for “who got tested” and use the inverse probability weighting approach to adjust for the selection bias due to prioritized testing guidelines54.
In general, our findings are consistent with existing studies. Male sex was associated with a higher risk of hospitalization and death, especially those 50 years and older55; health conditions such as obesity, cancer, type 2 diabetes and renal conditions were prevalent in severe prognosis of COVID-1934,45,46,56. Notably, our findings largely agree with recent published work looking at racial/ethnic differences in COVID-19 outcomes, which found Black patients had higher hospitalization rate8, increased odds of testing positive12 and disproportionately high COVID-19 diagnosis11 compared with White patients. Similar directional results but different strength of association with SES variables is likely because we used a continuous metric as opposed to the categorical measures used in Price-Haywood et al.14 Moreover, we also identified type 2 diabetes and kidney disease as risk factors associated hospitalization.
This study has several limitations. First, since this study was based on patient data at MM, we only had hospitalization records for those who were treated at MM. Thus, we may not have captured all hospitalized patients given that only half (50.5%) of the positive cohort had primary care at MM. It is possible that some of the “not hospitalized” patients actually were hospitalized elsewhere. Second, we did not consider the small number of transfer patients (119 to be precise) from other hospitals as a special sub-group, who often had more severe outcomes. Third, early in COVID-19 course at MM, all COVID-19 patients were placed in regional infectious containment unit (RICU), some of which did not require ICU-level care. We suggest future studies to define ICU patients using requirement of mechanical ventilators. Fourth, one may argue that the comparison group are intrinsically different than the tested cohort and do not serve as a proper comparison group and may impact the estimation of the ORs observed in the susceptibility models. The sensitivity analysis that restricted the patients to those who seek primary care at MM showed largely similar results (eTable 6 in Supplement). However, this is mostly relevant for susceptibility models, the prognosis models focused on the positive cohort and did not use the comparison group, and thus, are not subject to the same selection issues.
Conclusion
In this cohort study, our findings highlight that COVID-19 disproportionately affects those who are vulnerable: the elderly, those with pre-existing conditions, and those in population dense communities. Our results support targeted screening for the elderly and those with type 2 diabetes and kidney disease. Moreover, we call for increased investments in testing and prevention efforts in lower SES, densely populated communities, and racially diverse communities. It is these same communities that employ a greater proportion of essential workers and thus need increased testing and protection.
Supplementary Material
Key Points.
Question:
What are the sociodemographic and underlying health conditions associated with COVID-19 outcomes and how do they differ by race/ethnicity?
Findings:
In this retrospective cohort of 5,698 patients tested/diagnosed for COVID-19, high population density, type 2 diabetes and kidney disease were associated with hospitalization, in addition to older age, male sex and obesity. Adjusting for covariates, non-Hispanic Black patients were 1.72 times more likely to be hospitalized than non-Hispanic White patients, while no significant race differences were observed in ICU admission and mortality.
Meaning:
Targeted interventions to support vulnerable populations are needed. Racial disparities existed in COVID-19 outcomes that cannot be explained after controlling for age, sex, socioeconomic status and comorbidity score.
Acknowledgement
This study followed the Strengthening the Reporting of Observational Studies in Epidemiology (STROBE) reporting guidelines (Supporting Checklist).
Funding
This study is funded by the University of Michigan Precision Health Initiative, University of Michigan Rogel Cancer Center, and Michigan Institute of Data Science. The research of BM and LGF were supported by NSF DMS 1712933 and CA 046592 respectively. The funder was not involved in the design and conduct of the study; collection, management, analysis, and interpretation of the data; preparation, review, or approval of the manuscript; and decision to submit the manuscript for publication
Footnotes
Data Sharing
Individual level cannot be shared publicly due to patient confidentiality. The data underlying the results presented in the study are available from University of Michigan Data Office for Clinical & Translational Research for researchers who meet the criteria for access to confidential data. LGF and SPS had full access to all the data in the study and takes responsibility for the integrity of the data; TG and LGF takes the responsibility for the accuracy of the data analysis.
References
- 1.Vahidy FS, Nicolas JC, Meeks JR, et al. Racial and ethnic disparities in SARS-CoV-2 pandemic: analysis of a COVID-19 observational registry for a diverse US metropolitan population. BMJ Open. 2020;10(8):e039849. doi: 10.1136/bmjopen-2020-039849 [DOI] [PMC free article] [PubMed] [Google Scholar]
- 2.Patel A, Paranjpe M, Kathiresan N, Rivas M, Khera A. Race, socioeconomic deprivation, and hospitalization for COVID-19 in English participants of a national biobank. Int J Equity Health. 2020;19(1):114. doi: 10.1186/s12939-020-01227-y [DOI] [PMC free article] [PubMed] [Google Scholar]
- 3.Henning-Smith C, Tuttle M, Kozhimannil KB. Unequal Distribution of COVID-19 Risk among Rural Residents by Race and Ethnicity. J Rural Health. n/a(n/a). doi: 10.1111/jrh.12463 [DOI] [PMC free article] [PubMed] [Google Scholar]
- 4.Li AY, Hannah TC, Durbin JR, et al. Multivariate Analysis of Black Race and Environmental Temperature on COVID-19 in the US. Am J Med Sci. Published online June 20, 2020. doi: 10.1016/j.amjms.2020.06.015 [DOI] [PMC free article] [PubMed] [Google Scholar]
- 5.Gross CP, Essien UR, Pasha S, Gross JR, Wang S, Nunez-Smith M. Racial and Ethnic Disparities in Population-Level Covid-19 Mortality. J Gen Intern Med. Published online August 4, 2020:1–3. doi: 10.1007/s11606-020-06081-w [DOI] [PMC free article] [PubMed] [Google Scholar]
- 6.Abedi V, Olulana O, Avula V, et al. Racial, Economic and Health Inequality and COVID-19 Infection in the United States. medRxiv. Published online 05–01 2020:2020.04.26.20079756. doi: 10.1101/2020.04.26.20079756 [DOI] [PMC free article] [PubMed] [Google Scholar]
- 7.Shah M, Sachdeva M, Dodiuk-Gad RP. COVID-19 and Racial Disparities. J Am Acad Dermatol. Published online 04–17 2020. doi: 10.1016/j.jaad.2020.04.046 [DOI] [PMC free article] [PubMed] [Google Scholar]
- 8.Azar KMJ, Shen Z, Romanelli RJ, et al. Disparities In Outcomes Among COVID-19 Patients In A Large Health Care System In California. Health Aff (Millwood). Published online 05–21 2020:10.1377/hlthaff.2020.00598. doi: 10.1377/hlthaff.2020.00598 [DOI] [PubMed] [Google Scholar]
- 9.Marcello RK, Dolle J, Grami S, et al. Characteristics and Outcomes of COVID-19 Patients in New York City’s Public Hospital System. medRxiv. Published online June 1, 2020:2020.05.29.20086645. doi: 10.1101/2020.05.29.20086645 [DOI] [PMC free article] [PubMed] [Google Scholar]
- 10.Ahmed SM, Shah RU, Bale M, et al. Comprehensive Testing Highlights Racial, Ethnic, and Age Disparities in the COVID-19 Outbreak. medRxiv. Published online 05–09 2020:2020.05.05.20092031. doi: 10.1101/2020.05.05.20092031 [DOI] [Google Scholar]
- 11.Millett GA, Jones AT, Benkeser D, et al. Assessing differential impacts of COVID-19 on black communities. Ann Epidemiol. 2020;47:37–44. doi: 10.1016/j.annepidem.2020.05.003 [DOI] [PMC free article] [PubMed] [Google Scholar]
- 12.Rentsch CT, Kidwai-Khan F, Tate JP, et al. Covid-19 by Race and Ethnicity: A National Cohort Study of 6 Million United States Veterans. medRxiv. Published online 05–18 2020:2020.05.12.20099135. doi: 10.1101/2020.05.12.20099135 [DOI] [Google Scholar]
- 13.Kim SJ, Bostwick W. Social Vulnerability and Racial Inequality in COVID-19 Deaths in Chicago. Health Educ Behav. Published online May 21, 2020:109019812092967. doi: 10.1177/1090198120929677 [DOI] [PMC free article] [PubMed] [Google Scholar]
- 14.Price-Haywood EG, Burton J, Fort D, Seoane L. Hospitalization and Mortality among Black Patients and White Patients with Covid-19. N Engl J Med. Published online May 27, 2020:NEJMsa2011686. doi: 10.1056/NEJMsa2011686 [DOI] [PMC free article] [PubMed] [Google Scholar]
- 15.Townsend MJ, Kyle TK, Stanford FC. Outcomes of COVID-19: disparities in obesity and by ethnicity/race. Int J Obes. 2020;44(9):1807–1809. doi: 10.1038/s41366-020-0635-2 [DOI] [PMC free article] [PubMed] [Google Scholar]
- 16.Gausman J, Langer A. Sex and Gender Disparities in the COVID-19 Pandemic. J Womens Health. 2020;29(4):465–466. doi: 10.1089/jwh.2020.8472 [DOI] [PubMed] [Google Scholar]
- 17.Webb Hooper M, Nápoles AM, Pérez-Stable EJ. COVID-19 and Racial/Ethnic Disparities. JAMA. Published online May 11, 2020. doi: 10.1001/jama.2020.8598 [DOI] [PMC free article] [PubMed] [Google Scholar]
- 18.van Dorn A, Cooney RE, Sabin ML. COVID-19 exacerbating inequalities in the US. Lancet Lond Engl. 2020;395(10232):1243–1244. doi: 10.1016/S0140-6736(20)30893-X [DOI] [PMC free article] [PubMed] [Google Scholar]
- 19.Khatana SAM, Groeneveld PW. Health Disparities and the Coronavirus Disease 2019 (COVID-19) Pandemic in the USA. J Gen Intern Med. Published online May 27, 2020. doi: 10.1007/s11606-020-05916-w [DOI] [PMC free article] [PubMed] [Google Scholar]
- 20.Ahmed SM, Shah RU, Bale M, et al. Comprehensive Testing Highlights Racial, Ethnic, and Age Disparities in the COVID-19 Outbreak. medRxiv. Published online May 9, 2020:2020.05.05.20092031. doi: 10.1101/2020.05.05.20092031 [DOI] [Google Scholar]
- 21.McLaren J Racial Disparity in COVID-19 Deaths: Seeking Economic Roots with Census Data. National Bureau of Economic Research; 2020. doi: 10.3386/w27407 [DOI] [Google Scholar]
- 22.Laurencin CT, McClinton A. The COVID-19 Pandemic: a Call to Action to Identify and Address Racial and Ethnic Disparities. J Racial Ethn Health Disparities. 2020;7(3):398–402. doi: 10.1007/s40615-020-00756-0 [DOI] [PMC free article] [PubMed] [Google Scholar]
- 23.Bibbins-Domingo K This Time Must Be Different: Disparities During the COVID-19 Pandemic. Ann Intern Med. Published online April 28, 2020. doi: 10.7326/M20-2247 [DOI] [PMC free article] [PubMed] [Google Scholar]
- 24.Raifman MA, Raifman JR. Disparities in the Population at Risk of Severe Illness From COVID-19 by Race/Ethnicity and Income. Am J Prev Med. 2020;59(1):137–139. doi: 10.1016/j.amepre.2020.04.003 [DOI] [PMC free article] [PubMed] [Google Scholar]
- 25.Selden TM, Berdahl TA. COVID-19 And Racial/Ethnic Disparities In Health Risk, Employment, And Household Composition. Health Aff (Millwood). Published online July 14, 2020:10.1377/hlthaff.2020.00897. doi: 10.1377/hlthaff.2020.00897 [DOI] [PubMed] [Google Scholar]
- 26.Coronavirus - Michigan Data. Accessed September 2, 2020. https://www.michigan.gov/coronavirus/0,9753,7-406-98163_98173---,00.html
- 27.U.S. Census Bureau QuickFacts: Michigan Accessed May 11, 2020. https://www.census.gov/quickfacts/MI
- 28.Geronimus AT, Hicken M, Keene D, Bound J. “Weathering” and Age Patterns of Allostatic Load Scores Among Blacks and Whites in the United States. Am J Public Health. 2006;96(5):826–833. doi: 10.2105/AJPH.2004.060749 [DOI] [PMC free article] [PubMed] [Google Scholar]
- 29.Chowkwanyun M, Reed AL. Racial Health Disparities and Covid-19 — Caution and Context. N Engl J Med. Published online May 6, 2020:NEJMp2012910. doi: 10.1056/NEJMp2012910 [DOI] [PubMed] [Google Scholar]
- 30.Ahmed F, Ahmed N, Pissarides C, Stiglitz J. Why inequality could spread COVID-19. Lancet Public Health. 2020;5(5):e240. doi: 10.1016/S2468-2667(20)30085-2 [DOI] [PMC free article] [PubMed] [Google Scholar]
- 31.Milam AJ, Furr-Holden D, Edwards-Johnson J, et al. Are Clinicians Contributing to Excess African American COVID-19 Deaths? Unbeknownst to Them, They May Be. Health Equity. 2020;4(1):139–141. doi: 10.1089/heq.2020.0015 [DOI] [PMC free article] [PubMed] [Google Scholar]
- 32.Jackson SE, Brown J, Shahab L, Steptoe A, Fancourt D. COVID-19, smoking and inequalities: a study of 53 002 adults in the UK. Tob Control. Published online August 21, 2020. doi: 10.1136/tobaccocontrol-2020-055933 [DOI] [PubMed] [Google Scholar]
- 33.Niedzwiedz CL, O’Donnell CA, Jani BD, et al. Ethnic and socioeconomic differences in SARS-CoV-2 infection: prospective cohort study using UK Biobank. BMC Med. 2020;18(1):160. doi: 10.1186/s12916-020-01640-8 [DOI] [PMC free article] [PubMed] [Google Scholar]
- 34.Ebinger JE, Achamallah N, Ji H, et al. Pre-existing traits associated with Covid-19 illness severity. PLoS ONE. 2020;15(7). doi: 10.1371/journal.pone.0236240 [DOI] [PMC free article] [PubMed] [Google Scholar]
- 35.Williamson EJ, Walker AJ, Bhaskaran K, et al. Factors associated with COVID-19-related death using OpenSAFELY. Nature. 2020;584(7821):430–436. doi: 10.1038/s41586-020-2521-4 [DOI] [PMC free article] [PubMed] [Google Scholar]
- 36.Alqahtani JS, Oyelade T, Aldhahir AM, et al. Prevalence, Severity and Mortality associated with COPD and Smoking in patients with COVID-19: A Rapid Systematic Review and Meta-Analysis. PLOS ONE. 2020;15(5):e0233147. doi: 10.1371/journal.pone.0233147 [DOI] [PMC free article] [PubMed] [Google Scholar]
- 37.Fusaro VA, Levy HG, Shaefer HL. Racial and Ethnic Disparities in the Lifetime Prevalence of Homelessness in the United States. Demography. 2018;55(6):2119–2128. doi: 10.1007/s13524-018-0717-0 [DOI] [PMC free article] [PubMed] [Google Scholar]
- 38.Wildeman C, Wang EA. Mass incarceration, public health, and widening inequality in the USA. The Lancet. 2017;389(10077):1464–1474. doi: 10.1016/S0140-6736(17)30259-3 [DOI] [PubMed] [Google Scholar]
- 39.Bhala N, Curry G, Martineau AR, Agyemang C, Bhopal R. Sharpening the global focus on ethnicity and race in the time of COVID-19. The Lancet. 2020;395(10238):1673–1676. doi: 10.1016/S0140-6736(20)31102-8 [DOI] [PMC free article] [PubMed] [Google Scholar]
- 40.Bowleg L We’re Not All in This Together: On COVID-19, Intersectionality, and Structural Inequality. Am J Public Health. 2020;110(7):917. doi: 10.2105/AJPH.2020.305766 [DOI] [PMC free article] [PubMed] [Google Scholar]
- 41.de Lusignan S, Dorward J, Correa A, et al. Risk factors for SARS-CoV-2 among patients in the Oxford Royal College of General Practitioners Research and Surveillance Centre primary care network: a cross-sectional study. Lancet Infect Dis. Published online May 15, 2020. doi: 10.1016/S1473-3099(20)30371-6 [DOI] [PMC free article] [PubMed] [Google Scholar]
- 42.Miyara M, Tubach F, Pourcher V, et al. Low rate of daily active tobacco smoking in patients with symptomatic COVID-19. Qeios. Published online May 9, 2020. doi: 10.32388/WPP19W.4 [DOI] [Google Scholar]
- 43.Indications for COVID-19 diagnostic testing for adult patients in all clinical settings. Accessed June 9, 2020. http://www.med.umich.edu/asp/pdf/adult_guidelines/COVID-19-testing.pdf [Google Scholar]
- 44.CDC. Coronavirus Disease 2019 (COVID-19). Centers for Disease Control and Prevention; Published February 11, 2020. Accessed September 2, 2020 https://www.cdc.gov/coronavirus/2019-ncov/need-extra-precautions/evidence-table.html [Google Scholar]
- 45.Khan M, Khan MN, Mustagir MG, Rana J, Islam MS, Kabir MI. Effects of underlying morbidities on the occurrence of deaths in COVID-19 patients: A systematic review and meta-analysis. medRxiv. Published online May 17, 2020:2020.05.08.20095968. doi: 10.1101/2020.05.08.20095968 [DOI] [PMC free article] [PubMed] [Google Scholar]
- 46.Ssentongo P, Ssentongo AE, Heilbrunn ES, Ba DM, Chinchilli VM. Association of cardiovascular disease and 10 other pre-existing comorbidities with COVID-19 mortality: A systematic review and meta-analysis. PLOS ONE. 2020;15(8):e0238215. doi: 10.1371/journal.pone.0238215 [DOI] [PMC free article] [PubMed] [Google Scholar]
- 47.Alqahtani JS, Oyelade T, Aldhahir AM, et al. Prevalence, Severity and Mortality associated with COPD and Smoking in patients with COVID-19: A Rapid Systematic Review and Meta-Analysis. PLOS ONE. 2020;15(5):e0233147. doi: 10.1371/journal.pone.0233147 [DOI] [PMC free article] [PubMed] [Google Scholar]
- 48.Yang J, Zheng Y, Gou X, et al. Prevalence of comorbidities and its effects in patients infected with SARS-CoV-2: a systematic review and meta-analysis. Int J Infect Dis. 2020;94:91–95. doi: 10.1016/j.ijid.2020.03.017 [DOI] [PMC free article] [PubMed] [Google Scholar]
- 49.Wang B, Li R, Lu Z, Huang Y. Does comorbidity increase the risk of patients with COVID-19: evidence from meta-analysis. Aging. 2020;12(7):6049–6057. doi: 10.18632/aging.103000 [DOI] [PMC free article] [PubMed] [Google Scholar]
- 50.Logan JR, Xu Z, Stults B. Interpolating U.S. Decennial Census Tract Data from as Early as 1970 to 2010: A Longtitudinal Tract Database. Prof Geogr J Assoc Am Geogr. 2014;66(3):412–420. doi: 10.1080/00330124.2014.905156 [DOI] [PMC free article] [PubMed] [Google Scholar]
- 51.Clarke P, Morenoff J, Debbink M, Golberstein E, Elliott MR, Lantz PM. Cumulative Exposure to Neighborhood Context: Consequences for Health Transitions Over the Adult Life Course. Res Aging. 2014;36(1):115–142. doi: 10.1177/0164027512470702 [DOI] [PMC free article] [PubMed] [Google Scholar]
- 52.NaNDA | Social Environment and Health Program. Accessed June 10, 2020. https://seh.isr.umich.edu/signature-projects/nanda/
- 53.Yehia BR, Winegar A, Fogel R, et al. Association of Race With Mortality Among Patients Hospitalized With Coronavirus Disease 2019 (COVID-19) at 92 US Hospitals. JAMA Netw Open. 2020;3(8):e2018039. doi: 10.1001/jamanetworkopen.2020.18039 [DOI] [PMC free article] [PubMed] [Google Scholar]
- 54.Allen WE, Altae-Tran H, Briggs J, et al. Population-scale longitudinal mapping of COVID-19 symptoms, behaviour and testing. Nat Hum Behav. Published online August 26, 2020:1–11. doi: 10.1038/s41562-020-00944-2 [DOI] [PMC free article] [PubMed] [Google Scholar]
- 55.Singh S, Chowdhry M, Chatterjee A, Khan A. Gender-Based Disparities in COVID-19: Clinical Characteristics and Propensity-matched Analysis of Outcomes. medRxiv. Published online April 29, 2020:2020.04.24.20079046. doi: 10.1101/2020.04.24.20079046 [DOI] [Google Scholar]
- 56.Garg S Hospitalization Rates and Characteristics of Patients Hospitalized with Laboratory-Confirmed Coronavirus Disease 2019 — COVID-NET, 14 States, March 1–30, 2020. MMWR Morb Mortal Wkly Rep. 2020;69. doi: 10.15585/mmwr.mm6915e3 [DOI] [PMC free article] [PubMed] [Google Scholar]
Associated Data
This section collects any data citations, data availability statements, or supplementary materials included in this article.