

Abstract
Background:
Hospital inpatient and intensive care unit (ICU) bed shortfalls may arise due to regional surges in volume. We sought to determine how inter-region transfers could alleviate bed shortfalls during a pandemic.
Methods:
We used estimates of past and projected inpatient and ICU cases of COVID-19 from February 4, 2020 to October 1, 2020. For regions with bed shortfalls (where the number of patients exceeded bed capacity), transfers to the nearest region with unused beds were simulated using an algorithm that minimized total inter-region transfer distances across the U.S. Model scenarios used a range of predicted COVID-19 volumes (lower, mean, and upper bounds) and non-COVID-19 volumes (20%, 50%, or 80% of baseline hospital volumes). Scenarios were created for each day of data, and worst-case scenarios were created treating all regions’ peak volumes as simultaneous. Mean per-patient transfer distances were calculated by scenario.
Results:
For the worst-case scenarios, national bed shortfalls ranged from 669 to 58,562 inpatient beds and 3,208 to 31,190 ICU beds, depending on model volume parameters. Mean transfer distances to alleviate daily bed shortfalls ranged from 23 to 352 miles for inpatient and 28 to 423 miles for ICU patients, depending on volume. Under all worst-case scenarios except the highest-volume ICU scenario, inter-regional transfers could fully resolve bed shortfalls. To do so, mean transfer distances would be 24 to 405 miles for inpatients and 73 to 476 miles for ICU patients.
Conclusions:
Inter-region transfers could mitigate regional bed shortfalls during pandemic hospital surges.
Keywords: Pandemics, COVID-19, Surge Capacity, Disaster Planning, Intensive Care Units
Key points summary:
Based on simulations of hospitals with shortfalls or surpluses of hospital beds during a pandemic surge, inter-region transfers could be trialed as a means of alleviating such surges.
INTRODUCTION
The World Health Organization declared the Severe Acute Respiratory Syndrome Coronavirus 2 (SARS-CoV-2) outbreak a pandemic on March 11, 2020,[1–4] overwhelming health systems in multiple countries and some regions of the United States (U.S.).[5] The U.S. now has the largest number of COVID-19 cases in the world.[6] This surge in COVID-19 patients has outpaced resources in regional hospital systems, individual hospital beds and healthcare providers.[7] In the absence of effective public health measures, modeling studies estimated a shortfall over a 1-year period of over 1 million inpatient hospital beds and nearly 300,000 ICU beds in the U.S.[8,9] Such shortfalls could lead to an inability to provide needed care to COVID-19 patients or displace patients without COVID-19 who need hospital resources.
Given that inpatient resources and COVID-19 disease burden are not evenly distributed across the U.S. either geographically or over time, regional shortages and surpluses may be anticipated. Regions anticipating or coping with surges in patient volume have created ad hoc treatment spaces, using hallways, placing multiple patients in a single treatment space, or establishing field hospitals to expand their ability to provide care.[5] Personnel and resources (such as ventilators) are typically available in quantities commensurate with pre-pandemic needs, so solving space shortfalls does not necessarily remedy problems created by a surge in patient volume. Hospital beds in the U.S. are often not fully occupied. Estimates show that only 65% of hospital and intensive care unit (ICU) beds are utilized on average, suggesting an opportunity to better match patients to resources.[10,11]
Mass inter-region transfers of patients have the potential to resolve or alleviate resource shortfalls by bringing patients to available resources such as inpatient beds and personnel. Such efforts have predominantly been utilized in natural disasters. For example, during Hurricanes Katrina and Irene, traditional transport modalities, small mobile triage teams, personnel, and vehicles coordinated through the National Disaster Medical System organized mass transports of patients out of affected facilities.[12–14] The feasibility of evacuations as a tool to alleviate resource shortfalls depends on the extent of shortfalls and surpluses, and the physical distances patients might need to travel to reach appropriate resources.
To this end, our objectives were to: 1) estimate region-specific hospital and ICU bed shortfalls during the SARS-CoV-2 pandemic throughout the U.S; and 2) determine the circumstances in which inter-region transfers could ameliorate bed shortfalls. Modeling regions with projected shortfalls during the SARS-CoV-2 pandemic has the potential to redirect resources to provide optimal care in the face of region-specific projected bed and resource shortcomings.
MATERIALS AND METHODS
Study Design and Setting
We conducted a modeling study using publicly available data from all acute care hospitals in the U.S., excluding rehabilitation, long-term care, and specialty hospitals (such as psychiatric or orthopedic hospitals).
Data Sources
Hospital locations and bed counts were obtained from the 2018 American Hospital Association Annual Survey.[15,16] Missing bed counts were carried forward from the latest year between 2012–2018 in which they were non-missing in order to avoid undercounting. Bed counts missing through 2012–2018 were assumed to be zero. Past and future estimates of state-level inpatient and ICU hospitalizations for COVID-19 were obtained from the Institute for Health Metrics and Evaluation (IHME), which are based on statistical and disease transmission models and account for patient volume, hospitalization length, local mandates (such as mask orders, business closures, gathering restrictions, and others).[17] County-level positive SARS-CoV-2 test counts were obtained from the Johns Hopkins University Center for Systems Science and Engineering.[18] All case counts and projections were downloaded on June 24, 2020 and pertained to each day from February 4, 2020 through October 1, 2020. County-level population counts were derived from 2018 American Community Survey 5-year estimates.[19]
Regional Beds and Cases
Total hospital bed counts were dichotomized as inpatient beds and ICU beds. Inpatient beds were defined as general medical beds. ICU beds were medical, surgical, cardiac, pediatric, and other ICU beds, and additionally included operating room beds. Operating rooms were classified as ICU beds given their capability to function as such in a surge situation and may be a preferable location to treat critically ill patients compared with inter-region transfers.[20,21] Daily COVID-19 inpatient and ICU case projections from IHME included the lower, mean, and upper bounds of the 95% uncertainty intervals.[22] Some uncertainty exists around the IHME’s past case estimates, leading to narrow, but nonzero, uncertainty intervals. The estimates did not account for future improvements in medical care for COVID-19 that might decrease the number or severity of hospitalizations.
Beds and COVID-19 case estimates were aggregated by region. Urban and micropolitan regions were defined using U.S. Office of Management and Budget definitions of Core-Based Statistical Areas (CBSAs), which are groups of non-rural counties surrounding an urban center of at least 10,000 people linked by commuting.[23] Rural regions were defined by their individual counties, as there is no widely used method for aggregating rural counties.
Case aggregation was performed first by allocating the IHME state-level hospitalization estimates to counties using the proportion of the state’s tests that were positive on the date of the latest data download (June 24, 2020). The county-level case estimates were summed across counties for regions defined by a CBSA.
Outcomes
The first co-primary outcome was regional bed shortfall, defined as COVID-19 plus non-COVID-19 patients minus beds (or zero for regions with more beds than patients). The second co-primary outcome was transfer distance, defined as the mean per-patient transfer distance required to resolve all regional bed shortfalls (i.e. transfer all patients above the bed capacity of all regions with a shortfall). Transfer distances between regions were computed as the great circle distance (straight line distance accounting for the earth’s curvature) between the two region centroids.[24] Secondary outcomes included patients per bed (among regions with beds) and regional beds per 100,000 residents.
Model Scenarios
Scenarios were created for all combinations of model parameters (Table 1). These included daily projections (“daily scenarios”). Separately, “simultaneous peak scenarios” were created by treating all regional peak COVID-19 patient volumes as occurring simultaneously. This served as a test of a worst-case scenario, and is conceptually the same as treating each region’s highest-patient-volume date as the same. Additional parameters included bed type (inpatient or ICU) and non-COVID-19 volume (20%, 50%, or 80% of baseline volume). Reports of non-COVID-19 volumes have ranged across this spectrum during the SARS-CoV-2 pandemic, centering on 50% of baseline.[25–27]
TABLE 1: Scenarios over which bed shortfalls and transfer distances were calculated.
Each scenario represents a different set of assumptions (parameters) about simultaneous peak regional COVID-19 patient volumes, COVID-19 patient volume predictions, and non-COVID-19 volumes. Intensive care unit (ICU) beds were determined as the sum of known ICU beds plus operating room beds, as operating rooms may function as ICU capacity.
| Parameter | Categories tested | Data source |
|---|---|---|
| Bed type |
|
|
| Daily or simultaneous peak COVID-19 volumes |
|
|
| COVID-19 patient volume predictions |
|
|
| Non-COVID-19 patient volumes |
|
|
Optimal Transfers
To resolve bed shortfalls in each scenario, we adapted an algorithm to determine the minimum mean per-patient transfer distance across the U.S. We first constructed a graph, a computational modeling structure with nodes (in this case regions) and transfer connections between all node pairs. In our construction, all regions with shortfalls were “transferring regions” and all regions with surpluses were “receiving regions”. The algorithm output the number of patients that must be transferred across each transfer connection in order to obtain the minimum mean transfer distance. The algorithm was based on the push-relabel algorithm for the minimum-cost flow problem and was executed using the Google OR-Tools platform.[28–30] A complete description of the algorithm is in the Supplement.
Analysis
We first assessed national bed sufficiency to accommodate past and projected COVID-19 patient volumes. We reported the median and interquartile range (IQR) beds per capita and created maps displaying regional bed shortfalls and patient to bed ratios for the simultaneous peak scenarios. A heat map was constructed to visualize absolute shortfalls for each daily volume scenario, and we reported the locations and sizes of past and projected peak shortfalls.
We next examined the extent to which inter-region transfers could alleviate bed shortfalls. For each simultaneous peak scenario, we determined the mean per-patient transfer distance (as the weighted mean transfer distance by transfer connection, weighted by the number of patients transferred) and number of patients transferred. We reported the range of transfer distances by scenario. Maps of transfer connections were constructed. In order to determine the extent to which regional shortfalls could be partially mitigated by shorter inter-region transfers, we determined the proportion of patients nationally whose transfers were below caps ranging continuously from 0 to 1,000 miles. To further assess the efficacy of transfer distance caps, we computed the maximum distance to resolve 50% of the national bed shortfall for each scenario. For daily past and projected scenarios, we plotted total regional bed shortfalls by day, and determined the extent to which a range of transfer distance caps could resolve past and projected daily bed shortfalls.
RESULTS
There were 4,797 hospitals in the AHA survey. After excluding 114 (2.4%) specialty hospitals, 108 (2.2%) long-term care hospitals, and 148 (3.1%) non-responders to the AHA survey, there were 4,427 (92.3%) hospitals analyzed across 2,250 regions (Supplemental Table 1).
Regional inpatient beds ranged from 0 per 100,000 residents in 468/2,250 (20.8%) regions to 2,094, with a median of 111 (IQR: 47, 179) (Supplemental Figure 1). Regional ICU beds ranged from 0 per 100,000 residents in 629/2250 (28.0%) regions to 226, with a median of 22 (IQR: 0, 38).
Bed Shortfalls
Simultaneous peak bed shortfalls are shown in Figure 1, representing each region’s highest patient volume. The national sum of regional inpatient bed shortfalls totaled 1,945, 3,678, and 39,698 under the lower, mean, and upper projections, respectively, assuming non-COVID-19 occupancy of 50%. ICU bed shortfalls were 4,769, 6,276, and 24,189 under the lower, mean, and upper bound projections, with the same non-COVID-19 volume assumption. Patient to bed ratios are presented in Supplemental Figure 2.
Figure 1: Bed shortfalls across the United States.
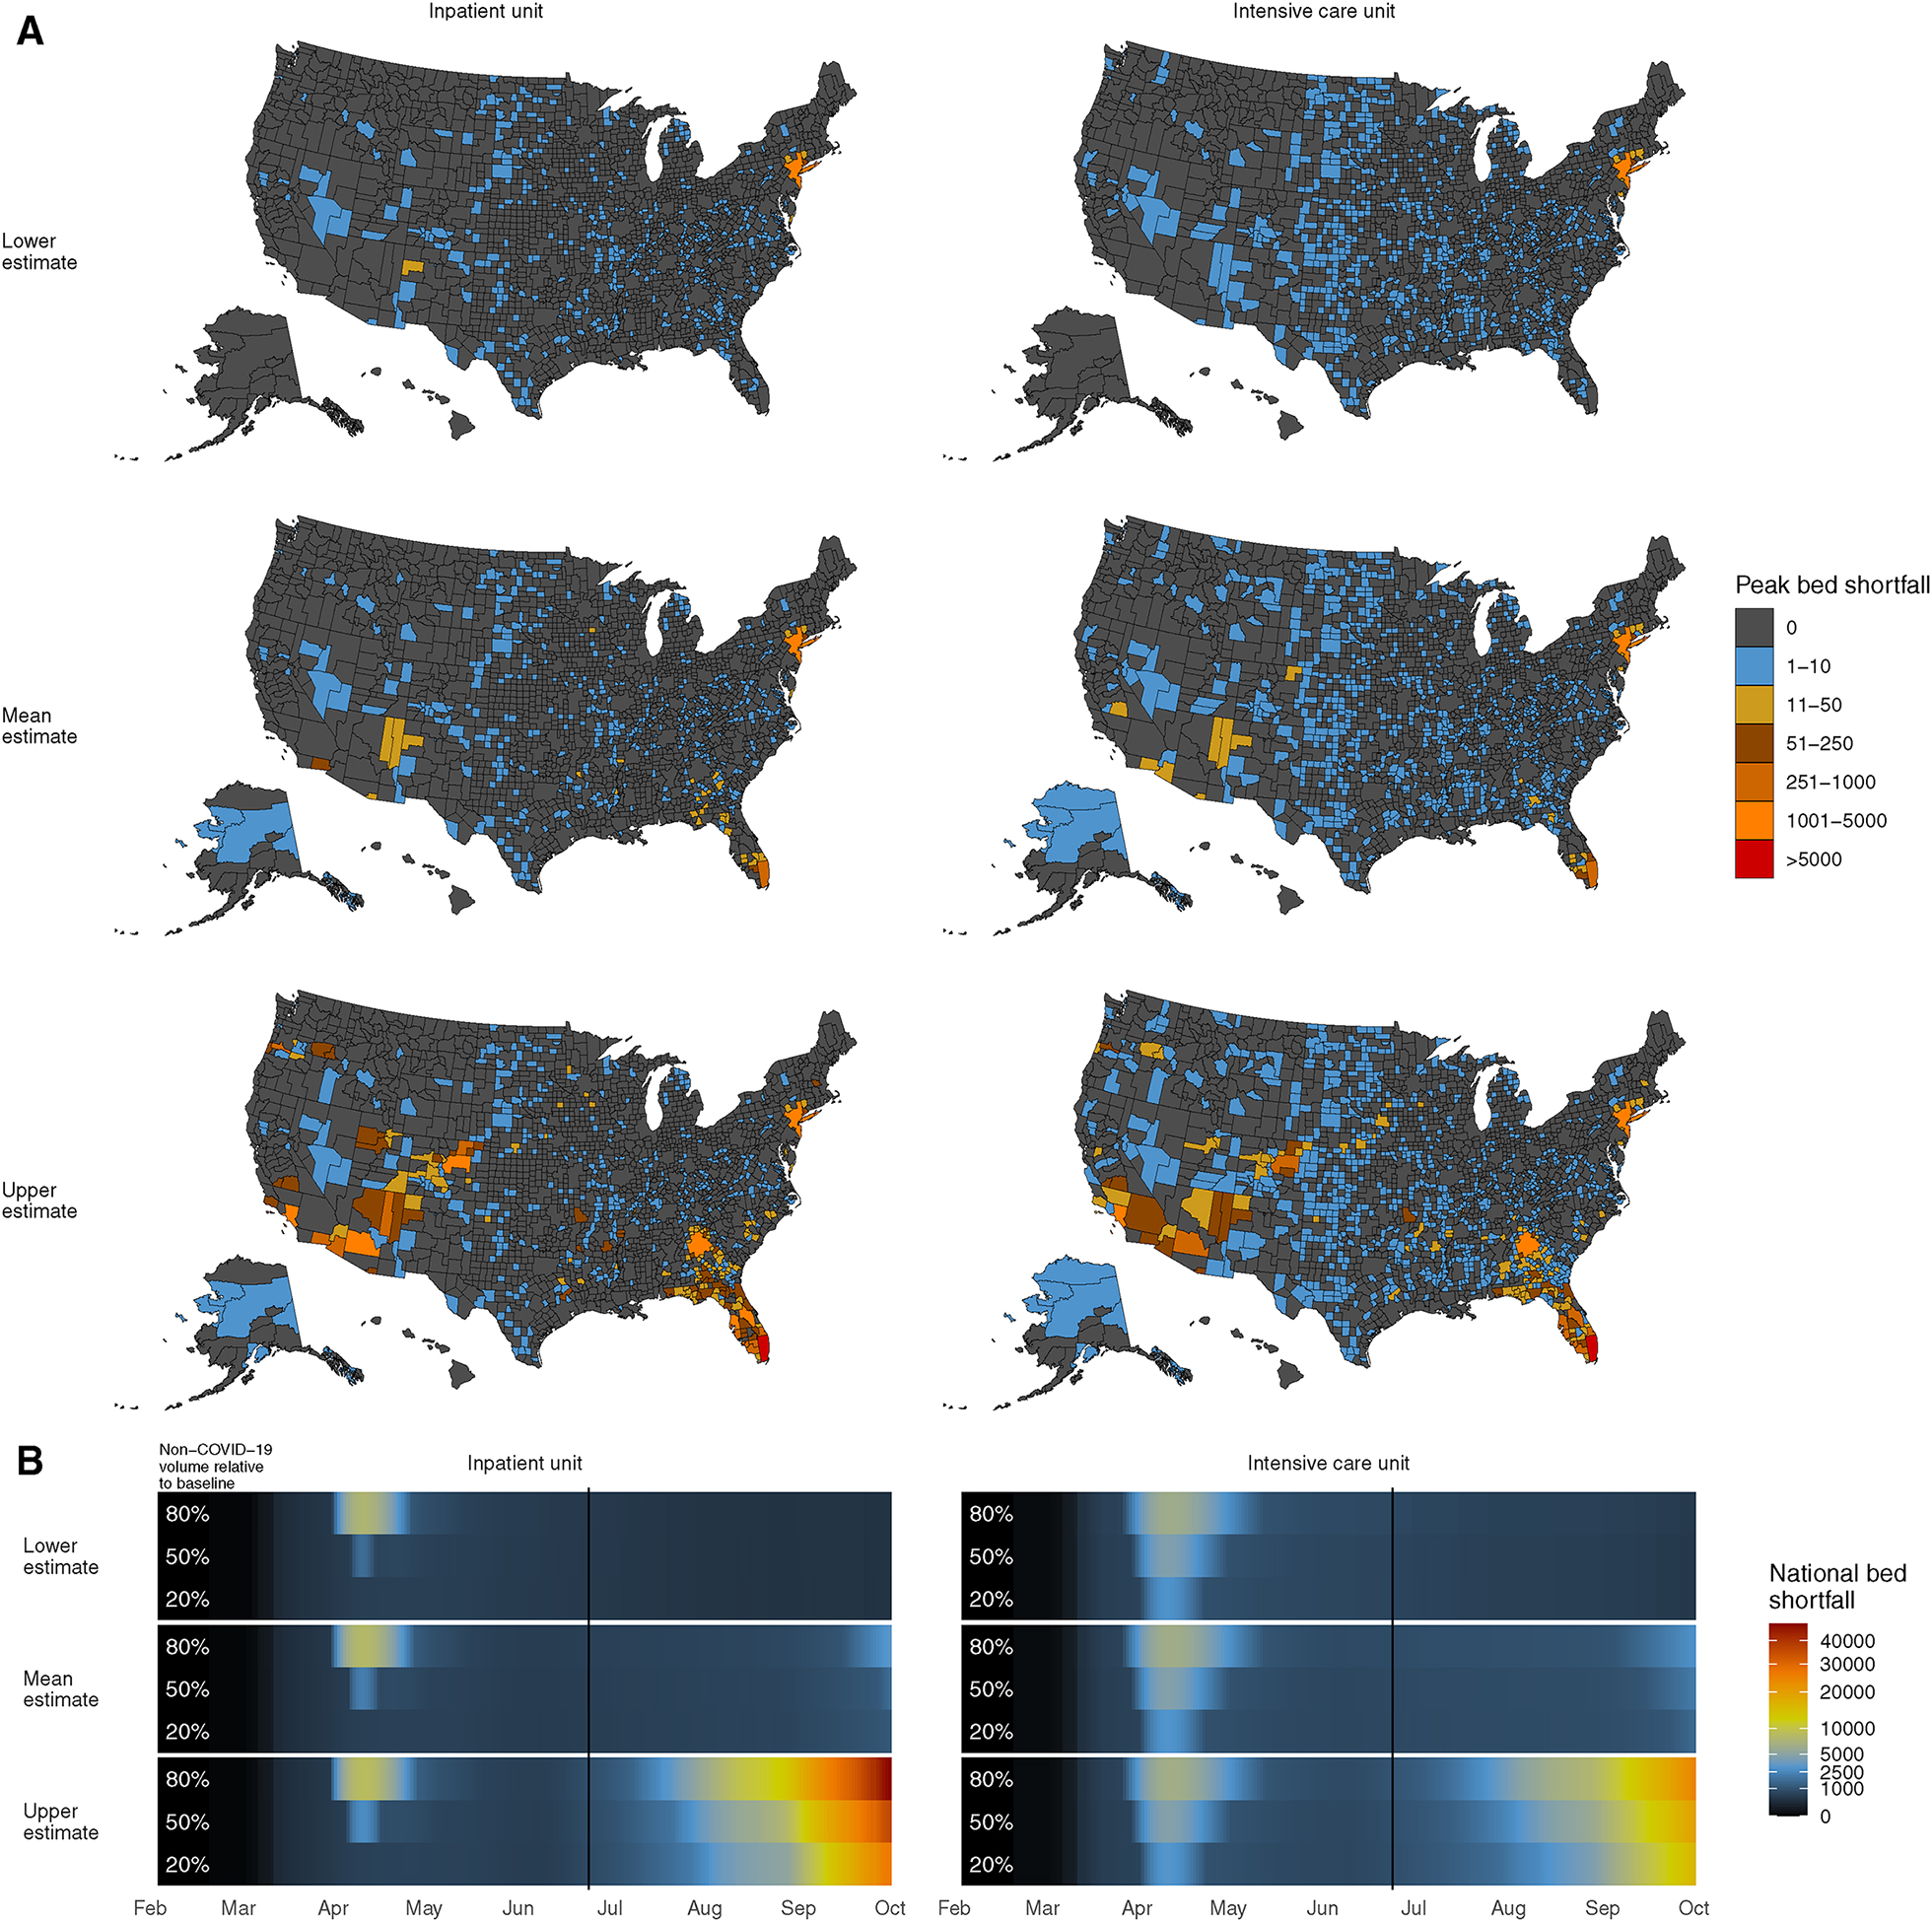
A. Regional peak bed shortfalls between February 4 and October 1, 2020, using past or projected data from the Institute for Health Metrics and Evaluation. Maps were separately created for inpatient and intensive care unit patients and for lower-, mean-, and upper-bound COVID-19 patient volumes, assuming a 50% decrease in non-COVID-19 patient volume from baseline hospital occupancy. B. Daily past and projected national bed shortfalls, computed as the sum of all regional bed shortfalls. Estimates are shown for the lower-, mean-, and upper-bound COVID-19 patient volume estimates with one row for each non-COVID-19 patient volume estimate (80%, 50%, or 20% of baseline volume). The vertical line indicates the date of data acquisition, June 24, 2020.
Past daily regional shortfalls were greatest in April, 2020 (Figure 1) and occurred in the New York-Newark-Jersey City CBSA. There, mean estimates of inpatient bed shortfalls on the highest-shortfall days were 2,230 and 8,230 beds depending on whether non-COVID-19 volumes were 50 or 80% of baseline occupancy, respectively. If non-COVID-19 volume was 20% of baseline, the highest shortfall would have been in the Gallup, NM CBSA, totaling 60 beds. Mean bound estimates of ICU bed shortfalls were highest in the New York-Newark-Jersey City CBSA and were 4,486, 4,588, and 4,647 beds depending on whether non-COVID-19 volumes were 20, 50, or 80% of baseline occupancy, respectively. Projected shortfalls depended on the proximity of COVID-19 case numbers to the lower, mean, or upper bound projections and to future non-COVID volumes (Figure 2). Future absolute shortfalls are projected to be largest in the Miami-Fort-Lauderdale-West Palm Beach, FL CBSA, with mean bound inpatient shortfalls of as many as 1,720 beds and ICU shortfalls of as many as 1,151 beds, both on October 1, 2020, the last day of projections.
Figure 2: Locations and distances of transfers to resolve regional bed shortfalls.
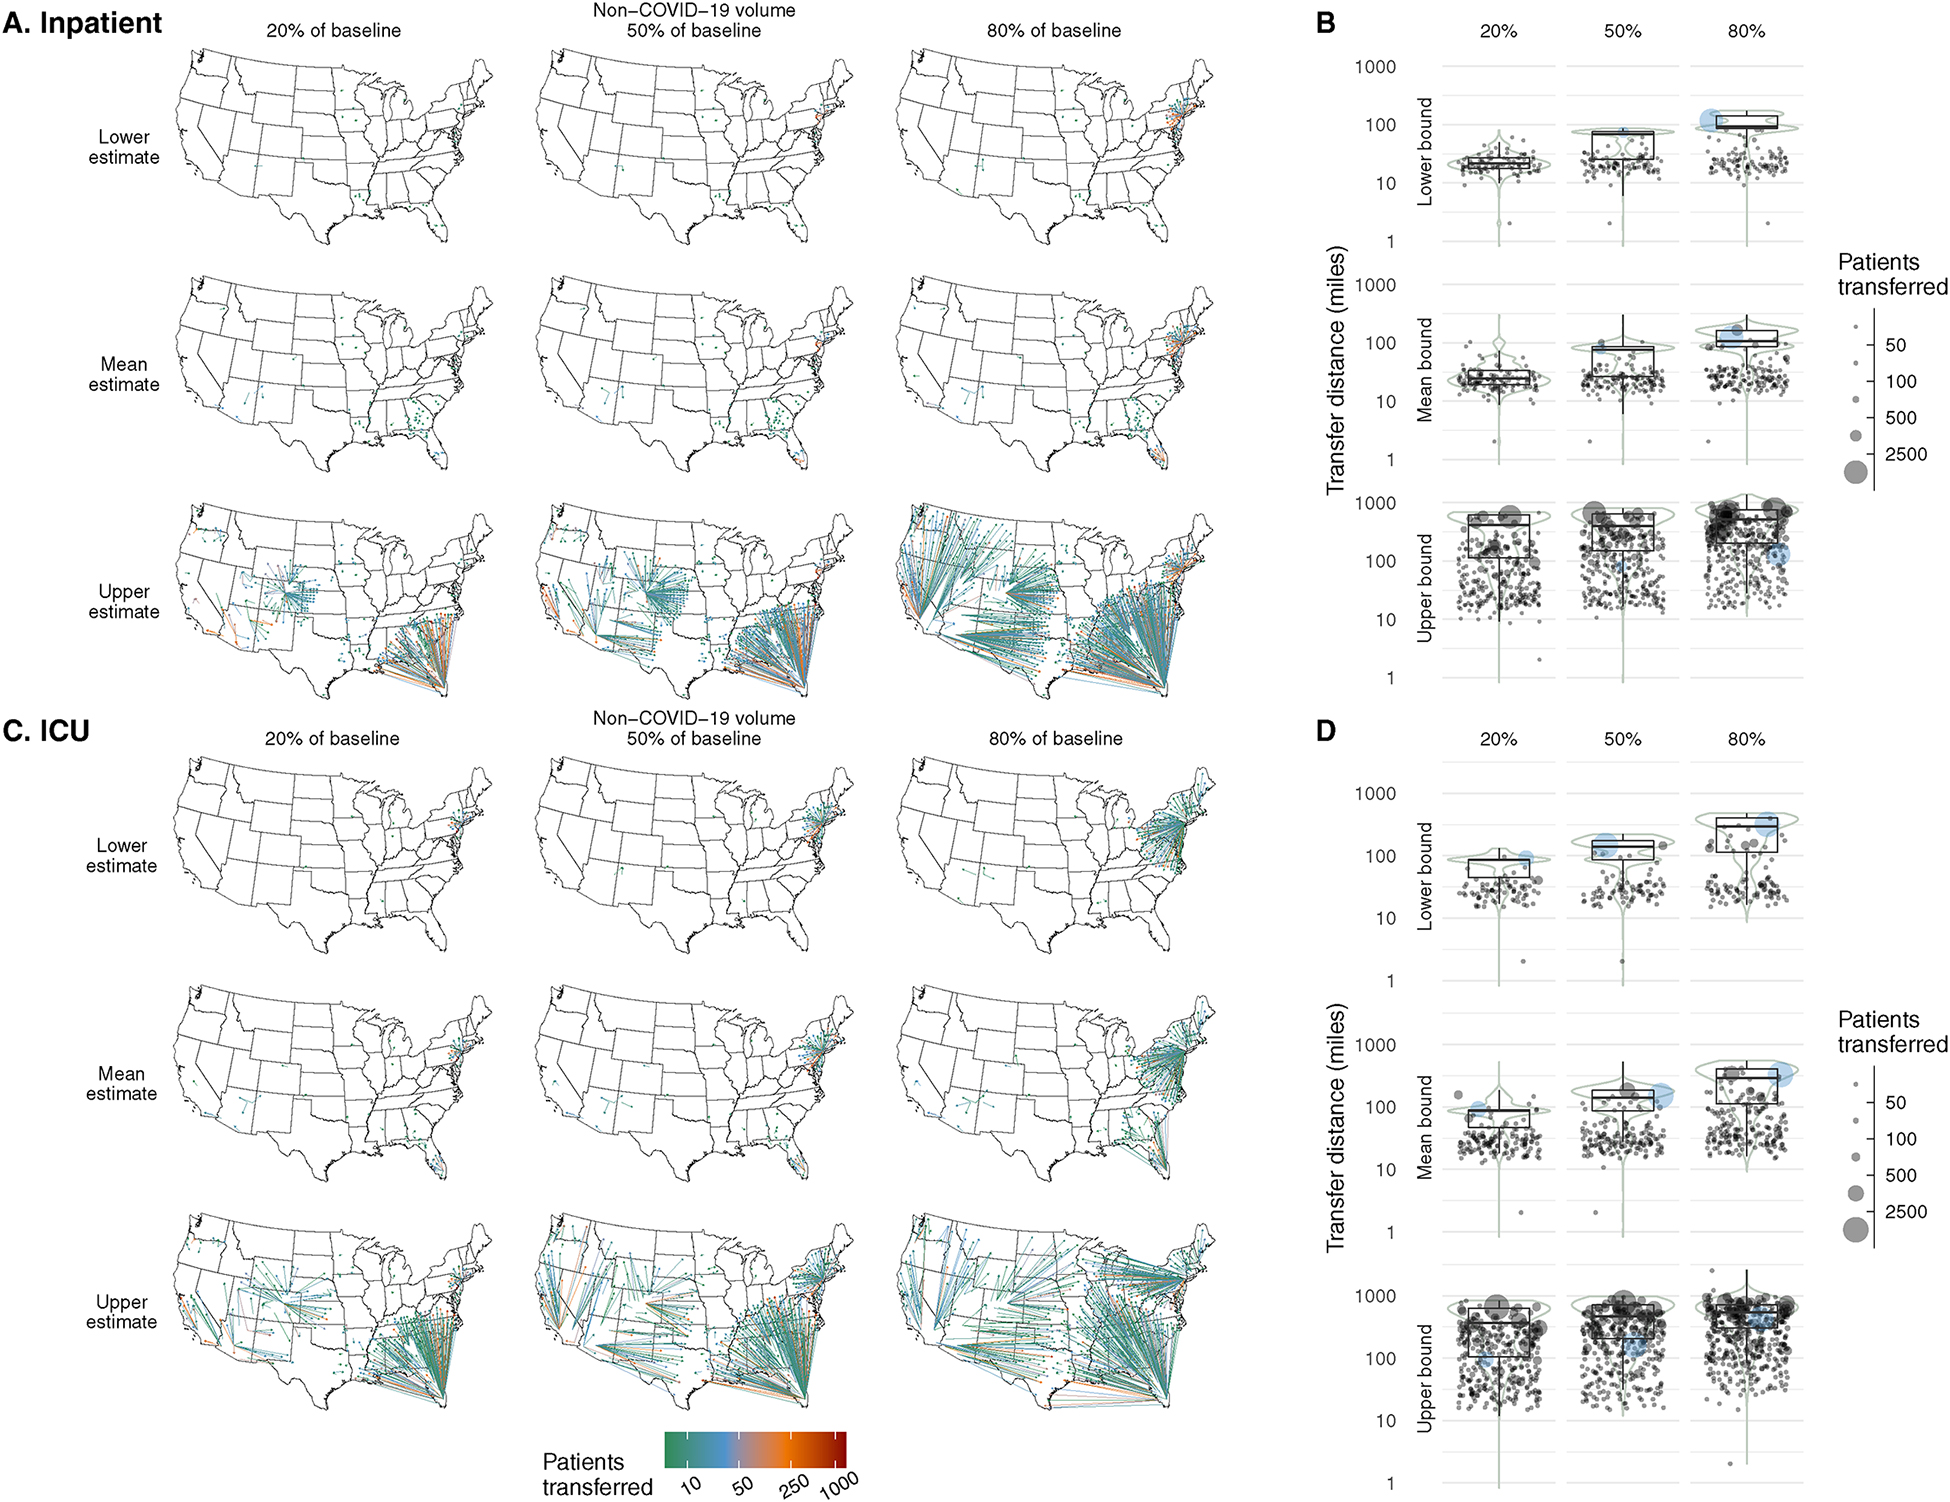
Number and distance of transfers that would resolve regional bed shortfalls for each set of assumptions regarding COVID-19 patient volume (rows) and non-COVID-19 patient volume (columns). Scenarios are shown for inpatient units (top) and ICUs (bottom). Peak regional volume was assumed to occur simultaneously across the nation. Left: Maps show the location of receiving and transferring regions and are colored according to the number transferred across the transfer connection (connections with n < 10 are not shown). Right: Distribution of distances transferred per patient are shown with box plots. Each point on the scatter plot represents one transferring region and the number of patients transferred from that region (blue: New York-Newark-Jersey City CBSA, highlighted due to having the highest peak volume of COVID-19 patients).
Reduction of Bed Shortfalls with Inter-region Transfers
Under all but one of the simultaneous peak and daily scenarios, inter-region transfers could resolve all bed shortfalls. The one exception was the ICU scenario with simultaneous peak upper bound ICU COVID-19 patient volume and the highest non-COVID-19 patient volume. Mean transfer distances for resolvable simultaneous peak scenarios depended on the parameters; they ranged from 24 to 502 miles for inpatients and from 73 to 476 miles for ICU patients (Table 2). The longest transfer distances ranged from 81 to 1,379 miles for inpatients and from 132 to 2,568 miles for ICU patients. Locations of the transferring and receiving regions under each simultaneous peak scenario are shown in Figure 2.
TABLE 2: National bed shortfalls by scenario.
The mean transfer distances needed to fully resolve all regional bed shortfalls, treating all regions’ peak volumes as simultaneous, are shown.
| Unit type | COVID-19 volume uncertainty interval bound | Non-COVID-19 volume relative to baseline | National bed shortfall | National transfer distance, mean ± SD (miles) | Longest transfer (miles) |
|---|---|---|---|---|---|
| Inpatient | Lower | 20% | 669 | 24 ± 10 | 81 |
| 50% | 1,945 | 53 ± 26 | 87 | ||
| 80% | 8,204 | 107 ± 42 | 174 | ||
| Mean | 20% | 1,304 | 31 ± 21 | 301 | |
| 50% | 3,678 | 61 ± 31 | 301 | ||
| 80% | 11,625 | 115 ± 50 | 301 | ||
| Upper | 20% | 27,730 | 369 ± 243 | 686 | |
| 50% | 39,698 | 405 ± 256 | 803 | ||
| 80% | 58,562 | 502 ± 297 | 1,379 | ||
| ICU | Lower | 20% | 3,208 | 73 ± 31 | 132 |
| 50% | 4,769 | 125 ± 61 | 222 | ||
| 80% | 6,975 | 259 ± 150 | 479 | ||
| Mean | 20% | 4,184 | 80 ± 41 | 524 | |
| 50% | 6,276 | 129 ± 65 | 524 | ||
| 80% | 9,258 | 261 ± 157 | 550 | ||
| Upper | 20% | 18,907 | 384 ± 259 | 838 | |
| 50% | 24,189 | 476 ± 288 | 978 | ||
| 80% | 31,190* | 525 ± 306 | 2,568 |
This shortfall could not be fully resolved as there were more patients than beds in the country. Transfer distances indicate the distances needed to transfer 23,801 patients, 76.3% of the total shortfall.
Capping maximum transfer distances would result in partial resolution of bed shortfalls (Figure 3). Under simultaneous peak COVID-19 volume scenarios, inpatient bed shortfalls could be resolved by 50% with transfers of up to 95, 110, and 525 miles, for the lower, mean, and upper bound estimates respectively. For ICU patients, resolution of 50% of bed shortfalls would require transfers up to 295, 295, and 640 miles, respectively.
Figure 3: Effect of capping the maximum distance of transfers on ability to resolve national bed shortfalls.
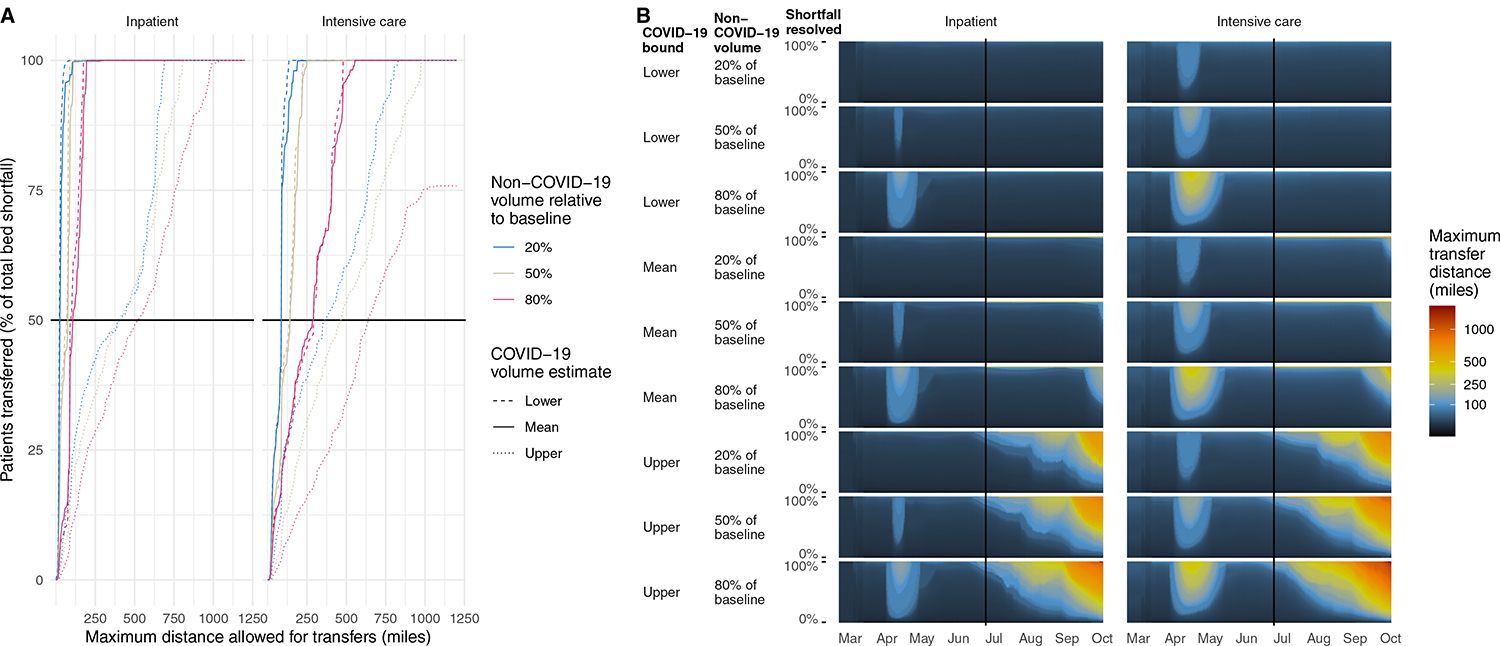
A. Proportion of patients that could be transferred if transfer distance were capped, for each scenario assuming peak volumes occurred simultaneously across the nation. Dashed line indicates distance in which 50% of total regional bed shortfalls would be resolved. B. Longest transfer distance (color) needed to resolve varying percentages (y axis) of national bed shortfalls in the past (left of vertical line) and future (right of vertical line, based on projected COVID-19 patient volumes). The longest transfer distance is indicated by color. Distances are estimated depending on which estimate of COVID-19 patient volumes is used (lower, mean, or upper) and non-COVID-19 patient volumes (20%, 50%, or 80% of baseline).
All past daily bed shortfalls could have been resolved with mean transfer distances of up to 77 miles for inpatients and 138 miles for ICU patients. Maximum transfer distances would have been 174 miles for inpatients and 427 miles for ICU patients. For projected daily bed shortfalls, transfer distances required to resolve shortfalls nationally varied depending on the scenario (lowest versus highest estimated COVID-19 and non-COVID-19 patient volumes). Mean transfer distances for inpatients would be projected to range from 23 to 352 miles. For ICU patients they would range from 28 to 423 miles.
DISCUSSION
The number of patients with COVID-19 exceeded regional bed capacities in April, 2020, and are projected to do so again, with the greatest absolute bed shortfalls projected in Miami-Fort-Lauderdale-West Palm Beach, FL at the end of the study period in October, 2020. Transferring patients between regions could resolve all projected bed shortfalls without the creation of additional capacity locally. This was true for all scenarios, except the worst-case projection among intensive care patients. The number of patients and distances traversed to accomplish transfers would depend heavily on how closely COVID-19 patient volumes align to the worst-, mean-, or best-case projections and on non-COVID-19 patient volumes. However, even if transfer distances were capped, regional hospital bed shortfalls could largely be resolved through inter-region transfers.
Our study demonstrates that inter-region transfers are a potentially effective approach to partially mitigate patient surges in a pandemic. It is unclear the extent to which individual regions would be willing to accept patients during a pandemic, given the potential for new local surges within each region at any given time. We addressed this potential by testing a “simultaneous peak” scenario by simulating regions with coinciding maximal bed usage. Even under these worst-case circumstances, inter-region transfers could partly or completely address bed shortfalls. Inter-region transfers should be considered in addition to previously recommended home quarantining of stable patients, isolation of patients hospitalized with COVID-19, and the establishment of surge protocols within facilities.[31]
Effective implementation of an inter-region transfer strategy would ideally be overseen by central authorities such as the Department of Health and Human Services or state Departments of Public Health. Such oversight would allow for coordination across diverse geographic regions and centralized awareness of hospital capacity in various settings. This authority could also coordinate thousands of transfer requests per day, as was achieved by such an authority in Toronto, Canada during the severe acute respiratory syndrome (SARS) epidemic in 2003.[32] The success of a transfer strategy depends on an understanding of where bed shortages and excesses exist across geographic areas. We believe that our algorithm could be employed in actual public health practice to make decisions to execute inter-region transfers. This would require collaborating regional authorities, robust central reporting of hospitalization numbers, and accurate projections of future need to avoid utilizing space that would soon be needed locally. In addition, such authorities would need to consider the other resources needed to care for patients: staffing at receiving facilities, equipment, and sufficient expertise to provide high-quality care.[33] Finally, considerable personnel and equipment resources would be required to conduct the transfers safely.
Mass transfers of patients have been implemented during natural disasters in the past, sometimes evacuating entire hospitals within hours.[12,34] For example, Hurricane Katrina’s destruction of levees displaced thousands of people, and hospitals coordinated the transfer of patients via helicopter and vehicle to hospitals both within Louisiana and hundreds of miles beyond to Arkansas, Kansas, Texas, and Florida.[14] In cases of mass casualty events, expediting discharges of patients helps create bed availability,[35] though mass casualty events often do not last for months or affect an entire country as has proven to be the case with the SARS-CoV-2 pandemic. The national scale of the pandemic could make coordination more challenging than in a natural disaster.[36] However, as roads remain intact through the pandemic, ground transfers may be more straightforward during a pandemic than during a hurricane.
Optimally coping with pandemic surges will require a multi-faceted approach.[33] If hospital capacity management strategies (such as expediting discharges[37] or canceling elective care[38]) are insufficient to meet the need for inpatient beds, additional patient care space must be created. This additional space may take the form of hallway space, doubling room occupancy, conversion of spaces to serve a new function (e.g. inpatient space for intensive care), emergency department boarding, creation of temporary field hospitals, or the use of alternate care spaces.[39–42] Under these circumstances, additional personnel and equipment need to be imported to meet the needs of additional patients. Given these additional needs, inter-region transfers are an attractive alternative or adjunct. When transferred, patients travel to a hospital with empty clinical space, matched to personnel and equipment, and obviate the need for construction of new space.
Inter-region transfers could not be implemented without addressing several potential challenges. These include the displacement of transferred patients from their families, the added cost of inter-region transfers, the requirement of dedicated personnel equipped with personal protective equipment, administrative concerns, difficult decisions of which patients get transferred, and the handoff between care teams. Additionally, some patients are too unstable to allow safe transfer, particularly at long distances. Thus, the least stable patients would likely need to be prioritized as non-transfers or nearby transfers. Such concerns should be considered when inter-region transfers are explored as a means to mitigate patient surges during the SARS-CoV-2 pandemic in the U.S.
This study is subject to limitations. We made several assumptions when constructing our models, including the assumption that hospitals would first fill all available beds, and that all hospitals would be willing to receive transferred patients. Moreover, aside from the distinction between ICU and inpatient beds, we assumed interchangeability of beds between hospitals: a hospital bed in a given level of acuity at one facility may not have the same resources or capacity for care as another. An additional limitation was that the IHME COVID-19 patient volume projections depend on many assumptions that may not prove to be true, though we worked to address this limitation by ranging model parameters. The model appeared to be most sensitive to COVID-19 patient volumes, as the upper bound estimates can approximate exponential spread of the disease. In comparison, non-COVID-19 patient volumes scale linearly across the assumptions. However, we believe the value of our models is not to suggest precisely where inter-region transfers might be beneficial, but rather to demonstrate the range of scenarios amenable to transfers as a surge mitigation strategy.
CONCLUSIONS
In conclusion, inter-region transfers have the potential to mitigate regional bed shortages during hospital volume surges, but would require coordination and organization to ensure patients’ safety. Such an approach could be implemented during the SARS-CoV-2 pandemic, or during future pandemics.
Supplementary Material
FUNDING
This work was supported by the Agency for Healthcare Research and Quality [grant number K08HS026503 to K.A.M.].
REFERENCES
- 1.WHO. WHO Director-General’s opening remarks at the media briefing on COVID-19 - 11 March 2020.
- 2.Sanche S, Lin YT, Xu C, Romero-Severson E, Hengartner N, Ke R. High Contagiousness and Rapid Spread of Severe Acute Respiratory Syndrome Coronavirus 2. Emerg Infect Dis 2020; 26. [DOI] [PMC free article] [PubMed] [Google Scholar]
- 3.Huang C, Wang Y, Li X et al. Clinical features of patients infected with 2019 novel coronavirus in Wuhan, China. Lancet 2020; 395:497–506. [DOI] [PMC free article] [PubMed] [Google Scholar]
- 4.Dong Y, Mo X, Hu Y, et al. Epidemiology of COVID-19 Among Children in China. Pediatrics 2020; 145:e20200702. [DOI] [PubMed] [Google Scholar]
- 5.Rosenbaum L Facing Covid-19 in Italy — Ethics, Logistics, and Therapeutics on the Epidemic’s Front Line. N Engl J Med 2020; 382:1873–1875. [DOI] [PubMed] [Google Scholar]
- 6.WHO. Coronavirus disease 2019 (COVID-19). 2020.
- 7.Emanuel EJ, Persad G, Upshur R, et al. Fair Allocation of Scarce Medical Resources in the Time of Covid-19. N Engl J Med 2020; 382:2049–2055. [DOI] [PubMed] [Google Scholar]
- 8.Tsai TC, Jacobson BH, Jha AK. American Hospital Capacity And Projected Need for COVID-19 Patient Care. 2020. Available at: https://www.healthaffairs.org/do/10.1377/hblog20200317.457910/full/. Accessed 30 June 2020.
- 9.Moghadas SM, Shoukat A, Fitzpatrick MC, et al. Projecting hospital utilization during the COVID-19 outbreaks in the United States. Proc Natl Acad Sci U S A 2020; 117:9122–9126. [DOI] [PMC free article] [PubMed] [Google Scholar]
- 10.US National Center for Health Statistics. Table 89, Hospitals, beds, and occupancy rates, by type of ownership and size of hospital: United States, selected years 1975–2015.
- 11.Halpern NA, Goldman DA, Tan KS, Pastores SM. Trends in critical care beds and use among population groups and medicare and medicaid beneficiaries in the United States: 2000–2010. Crit Care Med 2016; 44:1490–1499. [DOI] [PMC free article] [PubMed] [Google Scholar]
- 12.Verni C A Hospital System’s Response To A Hurricane Offers Lessons, Including The Need For Mandatory Interfacility Drills. Health Aff 2012; 31:1814–1821. [DOI] [PubMed] [Google Scholar]
- 13.Darsey DA, Carlton FB, Wilson J. The Mississippi Katrina Experience. South Med J 2013; 106:109–112. [DOI] [PubMed] [Google Scholar]
- 14.Baldwin S, Robinson A, Barlow P, Fargason CA. Moving Hospitalized Children All Over the Southeast: Interstate Transfer of Pediatric Patients During Hurricane Katrina. Pediatrics 2006; 117:S416–S420. [DOI] [PubMed] [Google Scholar]
- 15.American Hospital Association. Comprehensive hospital data for research and trend analysis. 2017. Available at: http://www.ahadata.com/academics-researchers/. Accessed 5 December 2017.
- 16.Hsia RY, Kellermann AL, Shen Y-C. Factors associated with closures of emergency departments in the United States. JAMA 2011; 305:1978–85. Available at: http://www.ncbi.nlm.nih.gov/pubmed/21586713. [DOI] [PMC free article] [PubMed] [Google Scholar]
- 17.Institute for Health Metrics and Evaluation. COVID-19 estimate downloads. Available at: http://www.healthdata.org/covid/data-downloads. Accessed 24 June 2020.
- 18.Johns Hopkins University. CSSE COVID-19 Dataset. Available at: https://github.com/CSSEGISandData/COVID-19/tree/master/csse_covid_19_data. Accessed 24 June 2020.
- 19.United States Census Bureau. American Community Survey Data Releases. 2018. Available at: https://www.census.gov/programs-surveys/acs/news/data-releases.2018.html. Accessed 8 July 2020.
- 20.Phua J, Weng L, Ling L, et al. Intensive care management of coronavirus disease 2019 (COVID-19): challenges and recommendations. Lancet Respir Med 2020; 8:506–517. [DOI] [PMC free article] [PubMed] [Google Scholar]
- 21.Peters AW, Chawla KS, Turnbull ZA. Transforming ORs into ICUs. N Engl J Med 2020; 382:e52. [DOI] [PMC free article] [PubMed] [Google Scholar]
- 22.Institute for Health Metrics and Evaluation. Terms Defined. Available at: http://www.healthdata.org/terms-defined. Accessed 15 July 2020.
- 23.United States Census Bureau. Core-Based Statistical Areas. 2018. Available at: https://www.census.gov/topics/housing/housing-patterns/about/core-based-statistical-areas.html. Accessed 8 July 2020.
- 24.Boscoe FP, Henry KA, Zdeb MS. A Nationwide Comparison of Driving Distance Versus Straight-Line Distance to Hospitals. Prof Geogr 2012; 64:188–196. [DOI] [PMC free article] [PubMed] [Google Scholar]
- 25.Lange SJ, Ritchey MD, Goodman AB, et al. Potential Indirect Effects of the COVID-19 Pandemic on Use of Emergency Departments for Acute Life-Threatening Conditions — United States, Jan-May 2020. MMWR Morb Mortal Wkly Rep 2020; 69:795–800. [DOI] [PMC free article] [PubMed] [Google Scholar]
- 26.Gogia S, Newton-dame R, Boudourakis L, et al. Covid-19 X-Curves : Illness Hidden, Illness Deferred. NEJM Catal Innov Care Deliv 2020; :1–10. [Google Scholar]
- 27.Baum A, Schwartz MD. Admissions to Veterans Affairs Hospitals for Emergency Conditions During the COVID-19 Pandemic. JAMA 2020; 661:1375–1377. [DOI] [PMC free article] [PubMed] [Google Scholar]
- 28.Goldberg AV An Efficient Implementation of a Scaling Minimum-Cost Flow Algorithm. J Algorithms 1997; 22:1–29. [Google Scholar]
- 29.Goldberg AV, Tarjan RE. Finding Minimum-Cost Circulations by Successive Approximation. Math Oper Res 1990; 15:430–466. Available at: http://pubsonline.informs.org/doi/abs/10.1287/moor.15.3.430. [Google Scholar]
- 30.Developers Google. OR-Tools. Available at: https://developers.google.com/optimization. Accessed 23 July 2020.
- 31.World Health Organization. Considerations for quarantine of individuals in the context of containment for coronavirus disease (COVID-19).: 1–3. Available at: https://www.who.int/publications/i/item/considerations-for-quarantine-of-individuals-in-the-context-of-containment-for-coronavirus-disease-(covid-19). Accessed 19 March 2020.
- 32.MacDonald RD, Farr B, Neill M, et al. An emergency medical services transfer authorization center in response to the Toronto severe acute respiratory syndrome outbreak. Prehosp Emerg Care 2004; 8:223–31. [DOI] [PMC free article] [PubMed] [Google Scholar]
- 33.Hick JL, Barbera JA, Kelen GD. Refining Surge Capacity: Conventional, Contingency, and Crisis Capacity. Disaster Med Public Health Prep 2009; 3:S59–S67. [DOI] [PubMed] [Google Scholar]
- 34.Schultz CH, Koenig KL, Lewis RJ. Implications of Hospital Evacuation after the Northridge, California, Earthquake. N Engl J Med 2003; 348:1349–1355. [DOI] [PubMed] [Google Scholar]
- 35.Davis DP, Poste JC, Hicks T, Polk D, Rymer TE, Jacoby I. Hospital Bed Surge Capacity in the Event of a Mass-Casualty Incident. Prehosp Disaster Med 2005; 20:169–176. [DOI] [PubMed] [Google Scholar]
- 36.Miller IF, Becker AD, Grenfell BT, Metcalf CJE. Disease and healthcare burden of COVID-19 in the United States. Nat Med 2020; [DOI] [PubMed] [Google Scholar]
- 37.Kelen GD, Troncoso R, Trebach J, et al. Effect of Reverse Triage on Creation of Surge Capacity in a Pediatric Hospital. JAMA Pediatr 2017; 171:e164829. [DOI] [PubMed] [Google Scholar]
- 38.Soremekun OA, Zane RD, Walls A, Allen MB, Seefeld KJ, Pallin DJ. Cancellation of Scheduled Procedures as a Mechanism to Generate Hospital Bed Surge Capacity—A Pilot Study. Prehosp Disaster Med 2011; 26:224–229. [DOI] [PubMed] [Google Scholar]
- 39.Carenzo L, Costantini E, Greco M, et al. Hospital surge capacity in a tertiary emergency referral centre during the COVID‐19 outbreak in Italy. Anaesthesia 2020; 75:928–934. [DOI] [PubMed] [Google Scholar]
- 40.Hick JL, Christian MD, Sprung CL. Chapter 2. Surge capacity and infrastructure considerations for mass critical care. Intensive Care Med 2010; 36:11–20. [DOI] [PubMed] [Google Scholar]
- 41.Keeley C, Long TG, Cineas N, et al. Staffing Up For The Surge: Expanding The New York City Public Hospital Workforce During The COVID-19 Pandemic. Health Aff 2020; :10. 1377/hlthaff. [DOI] [PubMed] [Google Scholar]
- 42.Love JS, Karp D, Delgado MK, Margolis G, Wiebe DJ, Carr BG. National Differences in Regional Emergency Department Boarding Times: Are US Emergency Departments Prepared for a Public Health Emergency? Disaster Med Public Health Prep 2016; 10:576–582. [DOI] [PubMed] [Google Scholar]
Associated Data
This section collects any data citations, data availability statements, or supplementary materials included in this article.