

SUMMARY
The DREAM complex orchestrates cell quiescence and the cell cycle. However, how the DREAM complex is deregulated in cancer remains elusive. Here, we report that PAF (PCLAF/KIAA0101) drives cell quiescence exit to promote lung tumorigenesis by remodeling the DREAM complex. PAF is highly expressed in lung adenocarcinoma (LUAD) and is associated with poor prognosis. Importantly, Paf knock-out markedly suppressed LUAD development in mouse models. PAF depletion induced LUAD cell quiescence and growth arrest. PAF is required for the global expression of cell cycle genes controlled by the repressive DREAM complex. Mechanistically, PAF inhibits DREAM complex formation by binding to RBBP4, a core DREAM subunit, leading to transactivation of DREAM target genes. Furthermore, pharmacological mimicking of PAF-depleted transcriptomes inhibited LUAD tumor growth. Our results unveil how the PAF-remodeled DREAM complex bypasses cell quiescence to promote lung tumorigenesis and suggest that the PAF-DREAM axis may be a therapeutic vulnerability in lung cancer.
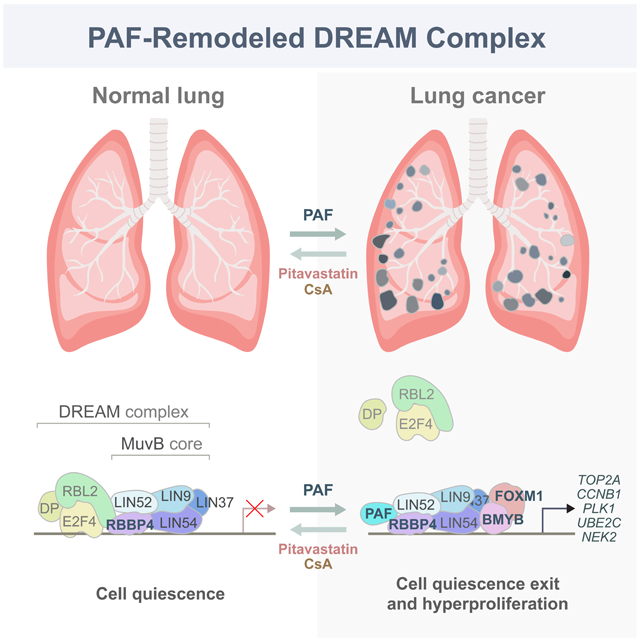
Graphical Abstract
eTOC Blurb
Bypassing cell quiescence and cell cycle arrest is a crucial step for tumorigenesis. Here, Kim et al. show that a PAF-remodeled DREAM complex induces the global expression of cell cycle genes, thereby evading quiescence and promoting lung tumorigenesis.
INTRODUCTION
Despite recent advances in cancer therapies, the available treatment options for lung cancer are limited, and patient survival rates have not improved significantly. Thus, the identification of tumor cell-intrinsic mechanisms that drive or suppress lung tumorigenesis is imperative to develop new strategies for lung cancer treatment. Lung adenocarcinoma (LUAD) is the most prevalent subtype of non-small cell lung cancer (NSCLC), accounting for about 40% of all lung cancer cases (Travis et al., 2015). Mutations of KRAS (~33%) and TP53 (~46%) are frequently observed in LUADs (Cancer Genome Atlas Research, 2014). Although targeting RAS signaling and rescuing the tumor suppressor TP53 have been suggested for LUAD treatment, clinical application of these strategies remains challenging (Cox et al., 2014; Muller and Vousden, 2014).
The somatic cells remain quiescent upon terminal differentiation. Perturbation of this process can lead to cell quiescence exit and hyperproliferation, which are implicated in cancer (Hanahan and Weinberg, 2011; Malumbres and Barbacid, 2001). The dimerization partner, RB-like, E2F, and multi-vulval class B (DREAM) complex, also called the DRM complex in Caenorhabditis elegans and the dREAM complex in Drosophila melanogaster, is an evolutionarily conserved cell cycle-regulatory multiprotein complex (Harrison et al., 2006; Korenjak et al., 2004; Lewis et al., 2004; Litovchick et al., 2007). In association with p130 (retinoblastoma-like protein 2/RBL2), E2F4, and DP1 (E2F dimerization partner 1), the DREAM complex is localized to the promoters of nearly a thousand (n = 967) cell cycle-related genes, repressing their transcription and inducing cell quiescence (G0 or G0/G1 arrest) (Litovchick et al., 2007). Upon cell cycle re-entry stimuli, p130, E2F4, and DP1 are dissociated from the DREAM complex. The remaining multi-vulval class B (MuvB) core complex composed of LIN9, LIN37, LIN52, LIN54, and RBBP4 subsequently binds to BMYB and FOXM1, which transactivates cell cycle genes related to S/G2/M phase (Sadasivam et al., 2012). Given that the DREAM complex plays a crucial role in orchestrating the cell cycle, deregulation of this complex is implicated in several cancers (Iness and Litovchick, 2018; MacDonald et al., 2017; Nor Rashid et al., 2011; Sadasivam and DeCaprio, 2013). For instance, overexpression of DREAM complex targets, including FOXM1, PLK1, TOP2A, ECT2, and CCNB1, is frequently observed in many cancers (Cancer Genome Atlas Research, 2011; Fields and Justilien, 2010; Kim et al., 2006; Perou et al., 2000; Soria et al., 2000; Whitfield et al., 2002; Wong et al., 2009). Nonetheless, how the repressive DREAM complex is aberrantly regulated in cancer cells remains elusive.
Proliferating cell nuclear antigen (PCNA)-associated factor (PAF, also known as PCLAF/KIAA0101) was identified as a PCNA-binding partner (Yu et al., 2001). In vitro studies suggested that, via its interaction with PCNA, PAF is involved in DNA repair (Emanuele et al., 2011; Povlsen et al., 2012). Recent in vivo studies also identified PCNA-independent functions of PAF in cancer and stem cells (Jun et al., 2013; Kim et al., 2018; Liu et al., 2012; Ong et al., 2017; Wang et al., 2016). Importantly, PAF is barely expressed in normal cells but highly upregulated in various cancer cells (Cheng et al., 2013; Hosokawa et al., 2007; Jain et al., 2011; Jun et al., 2013; Jung et al., 2013; Mizutani et al., 2005; Wang et al., 2016; Yu et al., 2001; Yuan et al., 2007). PAF contributes to cancer cell proliferation (Emanuele et al., 2011; Hosokawa et al., 2007; Jain et al., 2011; Jun et al., 2013; Jung et al., 2013; Mizutani et al., 2005). PAF is also associated with cell stemness in normal tissue and cancers (Kim et al., 2018; Ong et al., 2017; Wang et al., 2016). Additionally, PAF modulates gene expression independently of PCNA. For instance, PAF hyperactivates the expression of Wnt/β-catenin target genes as a co-factor of the β-catenin/EZH2 complex for intestinal tumorigenesis and regeneration (Jung et al., 2013; Kim et al., 2018). PAF also induces pancreatic intraepithelial neoplasia via transactivation of LAMTOR3, a mitogen-activated protein kinase signaling adaptor (Jun et al., 2013).
In this study, we sought to determine how PAF contributes to lung tumorigenesis by employing comprehensive approaches, including cell biology, biochemistry, and mouse genetics.
RESULTS
Overexpression of PAF in LUAD Is Correlated with Poor Prognosis
We analyzed PAF expression in various human cancers using the information in the publicly available Oncomine database. Lung tumors (15/37 analyses) frequently showed high expression of PAF (Figure S1A). Analysis of multiple data sets showed that, among the lung cancer subtypes, PAF was primarily expressed in LUAD and lung squamous cell carcinoma (LUSC) (Figures 1A, 1B, and 1C). We confirmed the upregulation of PAF in human LUAD samples (31/55; 56%) and no expression of PAF in normal lung epithelium (12 cases) (Figure 1D and Table S1). These results were also reproducible in immunoblot analyses of human normal lung tissues and LUAD patient-derived xenograft (PDX) samples (Figure 1E). Intriguingly, Kaplan-Meier analysis of survival data from multiple databases revealed that high PAF expression was associated with poor prognosis in patients with LUAD but not those with LUSC (Figures 1F, 1G, and S1B-S1D).
Figure 1. Overexpression of PAF in Lung Adenocarcinoma (LUAD) Is Correlated with Poor Prognosis.

(A) Upregulation of PAF in human lung cancer data sets. Oncomine analysis of PAF expression in lung cancer subtypes (gene rank > top 10%, fold change > 2; P-value < 0.0001; compared with normal tissues).
(B) Upregulation of PAF in human LUAD. Gene Expression Omnibus (GEO, GDS1650/38116_at) analysis of PAF expression in tumor-adjacent normal (n = 19) and LUAD tissues (n = 20). Each column indicates PAF expression in individual samples by microarray (signal counts; arbitrary units). Green squares indicate rank order of expression measurements within samples.
(C) Upregulation of PAF in human LUAD and lung squamous cell carcinoma (LUSC). Gene expression in tumor (T) versus normal (N) tissues was analyzed using TCGA data set (GEPIA; box plots, one-way ANOVA; **P <0.01).
(D) Increased levels of PAF protein in human LUAD. Immunohistochemistry (IHC) analysis of human lung cancer tissue microarray samples for PAF expression (Anti-PAF antibody). Normal lung (n = 12), LUAD (n = 55), LUSC (n = 48), small cell lung cancer (SCLC) (n = 8), and large cell carcinoma (LCC) (n = 4). PAF protein is mainly localized in the nucleus of tumor cells. Scale bars = 100 μm.
(E) PAF protein expression analyses in human normal lung and non-small cell lung cancer (NSCLC) samples. Five normal lung tissues and three PDX samples (TC241, TC303, and TC314) were examined by immunoblotting for PAF with an anti-PAF antibody. Tubulin served as loading control. SE: short exposure; LE: long exposure.
(F) Increased expression of PAF is associated with poor prognosis of lung cancer patients. Kaplan–Meier (KM) survival curves of patients with NSCLC, LUAD, and LUSC based on PAF expression. The analysis included 1926 patients with NSCLC, 720 with LUAD, and 524 with LUSC in a publicly available database (KM plotter; Probe=211713_x_at).
(G) KM survival curves of 481 TCGA patients with LUAD by PAF expression. The lowest quartile was used as the cutoff for dividing PAF-low and PAF-high groups (GEPIA; TCGA).
(H) PAF expression in LUAD cell lines. Whole-cell lysates of LUAD and SCLC cell lines were analyzed by immunoblotting for PAF with an anti-PAF antibody. Tubulin served as loading control.
(I) Paf is expressed in mouse LUAD but not in normal lung tissues. IHC of normal mouse lungs and KrasLSL-G12D/+; Trp53floxed/floxed (KP) lung tumors (3 months after Ad-Cre administration). Scale bars = 50 μm.
(J) Ectopic expression of KRASG12D induces PAF expression. Three non-transformed cell lines (3T3, BJ, and IMR-90) were transiently transfected with plasmids encoding KRASG12D (HA-tagged). After 48 hours, each cell line was harvested for immunoblotting analysis of endogenous PAF expression. SE: short exposure; LE: long exposure.
Representative images are shown.
We further confirmed that PAF was highly upregulated in various LUAD cell lines (Figure 1H). The primary PAF expression in LUAD cells was transcribed by a large transcriptional variant (Variant 1) among the two PAF variants (Figures S1E and S1F). Also, PAF expression was induced in two well-defined LUAD mouse models, KrasLSL-G12D/+ (K) and KrasLSL-G12D/+;Trp53floxed/floxed (KP) mice (Figures 1I and S1G) (DuPage et al., 2009). Moreover, the transient expression of KRASG12D in non-PAF-expressing and non-transformed cells (3T3, BJ, and IMR-90) induced PAF expression (Figure 1J), implying that PAF expression in LUAD is likely to be associated with oncogenic KRAS signaling.
Paf Knockout Suppresses Lung Tumorigenesis
We found that Paf-expressing cells were among the proliferating cells in KP LUAD mouse tumors (54.5% of Ki67-positive and 29.4% of PCNA-positive cells, indicating proliferating cells, expressed Paf) (Figures 2A-2C, S2A, and S2B). Having observed the robust expression of PAF in both human and mouse LUADs, we asked whether PAF is required for lung tumorigenesis in vivo. We generated Paf knockout (KO) mice on KP compound strains (Paf−/−; KrasLSL-G12D/+; Trp53floxed/floxed [PKP]) and administered Ad-Cre to induce oncogenic KrasG12D expression and Trp53 loss in the lungs. Strikingly, PKP mice exhibited significant suppression of lung tumorigenesis, as assessed by macroscopic, microscopic, and micro-computed tomographic (Micro-CT) analyses of lung tumors (Figures 2D-2F, S2C, and S2D). The lung tumor numbers and tumor burden were also remarkably lower in PKP mice than in KP mice (Figures 2G and 2H). Furthermore, mice with Paf KO lung tumors (PKP mice) had reduced tumor cell proliferation as shown by Ki67 staining (Figures 2I and S2E), with no difference in cell death, as shown by cleaved caspase-3 staining, from that in KP mice (Figures S2F and S2G). Importantly, PKP mice had dramatically longer life spans (median survival duration, 353 days) than did KP mice (median survival duration, 90 days), and three of the nine PKP mice survived for more than 2 years, having only a few small lung adenomas (Figures 2J and 2K). Additionally, we examined the impact of Paf KO on KrasG12D-driven mouse lung tumorigenesis in mice with wild-type Trp53 alleles. Similar to the results of the KP model, Paf KO also suppressed KrasG12D-driven lung tumorigenesis and significantly extended mouse life spans (median survival duration, 193 days in KrasLSL-G12D/+ mice versus 645 days in Paf−/−; KrasLSL-G12D/+ mice) (Figures 2L-2P and S2H-S2K), suggesting that the role of PAF in lung tumorigenesis is somewhat independent of TP53 status. Of note, we confirmed similar genetic recombination events in KrasLSL-G12D/+ and Paf−/−; KrasLSL-G12D/+ mice after Ad-Cre infection by evaluating the number of KrasG12D-expressing cells (Figures S2L and S2M), indicating that the tumor-suppressive effect of Paf KO is not due to either intrinsic defects of lung epithelial cells on Ad-Cre viral infection or different efficiency of Cre-loxP recombination. These in vivo results suggest that Paf is required for lung tumorigenesis in mice.
Figure 2. Suppression of Lung Tumorigenesis by Paf Knockout.

(A-C) PAF expression in proliferating lung cancer cells. (A) Co-immunostaining of Paf/Pcna and (B) Paf/Ki67 in KP mouse lung tumors; scale bars = 20 μm. (C) Quantification of Paf+ cells among Ki67+ and Pcna+ cell populations in KP lung tumors; data are from at least 5 fields, n > 200 tumor cells were analyzed. Error bars: SEM.
(D-F) Macroscopic analysis of lungs from KP and PKP mice at 3 or 4 months (mo) after Ad-Cre induction. (D) Extensive lung tumor nodules were visible on the surface of KP lungs, whereas no tumor nodules were found on the surface of PKP lungs; scale bars = 2 mm. (E) Hematoxylin and eosin (H&E) staining of lungs from KP (3 mo) and PKP mice (4 mo). Scale bars = 2 mm for whole lung sections and 100 μm for magnified images. (F) Micro-CT images of lungs from KP (3 mo; n = 6) and PKP (3 mo; n = 6) mice; scale bars = 2 mm; H: heart; asterisk: tumor lesion.
(G and H) Paf knockout (KO) suppressed lung tumor growth. (G) Quantification of tumor number and (H) tumor burden in KP and PKP lung samples. The middle sections of mouse lungs were analyzed to quantify tumor number. Tumor burden (% of total lung area) was calculated by measuring the tumor area in the middle sections of mouse lungs (KP 3 mo, n = 6; PKP 3 mo, n = 5, PKP 4 mo, n = 4); error bars: SEM.
(I) Paf KO reduced lung tumor cell proliferation. Quantification of Ki67+ cells in KP and PKP lung tumors (see Figure S6C); at least 15 fields of 200× magnified images from KP (n = 4) and PKP (n = 9) lung tumors were analyzed; error bars: SD.
(J) Representative images of H&E-stained lung sections of surviving PKP mice at the end of observation (2 years); 3 of 9 PKP mice (33.3%) survived until euthanasia.
(K) Paf KO extended mouse life span. KM survival curves of KP and PKP mice. KP median survival = 90 days (n = 10), PKP median survival = 353 days (n = 9). Log-rank (Mantel-Cox) test.
(L-P) Paf KO suppressed KrasG12D-driven lung tumorigenesis. Lung samples from KrasLSL-G12D/+ (4 mo after Ad-Cre induction, n = 4) and Paf−/−; KrasLSL-G12D/+ mice (4 mo after Ad-Cre induction, n = 5) were analyzed. (L) Images of H&E-stained lung sections; scale bars = 2 mm for whole lung sections and 100 μm for magnified images of tumors. (M) Quantification of tumor number from the middle sections of mouse lung samples. (N) Quantification of tumor burden calculated as in (H). (O) Cell proliferation analysis by quantification of Ki67+ cells; at least 15 fields of 200× magnified images from KrasLSL-G12D/+ (n = 4) and Paf−/−; KrasLSL-G12D/+ (n = 5) lung tumors were analyzed; error bars: SD. (P) KM survival curves; KrasLSL-G12D/+ median survival = 193 days (n = 6), Paf−/−;KrasLSL-G12D/+ median survival = 645 days (n = 7). Of 7 Paf−/−; KrasLSL-G12D/+ mice, 3 (42.8%) survived until the end of observation (2 years). Log-rank (Mantel-Cox) test.
Representative images are shown; *P < 0.05; **P < 0.01; ***P < 0.001.
PAF Depletion Induces Cell Quiescence and Growth Arrest of Lung Cancer Cells
Having determined that Paf KO suppresses in vivo lung tumorigenesis, we next sought to address the impacts of PAF on LUAD cell proliferation. Using lentiviruses encoding short hairpin RNAs (shRNAs), we depleted the expression of endogenous Paf in KP lung tumor cell lines (derived from lung tumors of KP mice) (Figures S3A-S3C). Paf knockdown (KD) with shRNAs inhibited the growth of lung tumor cells (Figures 3A-3C). The growth-inhibitory effect of Paf depletion was reversed by ectopic expression of Paf (Figures 3D and S3D), confirming the specificity of shRNA-mediated Paf targeting. Similarly, PAF depletion using shRNAs inhibited the growth of human LUAD cell lines (KRAS-mutated [A549] and KRAS/TP53-mutated [H23, H358, H1792, and H1355] cells), which was also rescued by ectopic expression of PAF (Figures 3E and S3E-S3G). Of note, cell viability, assessed by immunostaining of the apoptosis marker cleaved Caspase-3, was not affected by PAF KD (Figures S3H and S3I).
Figure 3. PAF Depletion Induces Quiescence and Growth Arrest of Lung Cancer Cells.

(A-E) Cell growth inhibition by PAF depletion. (A) Cell proliferation was assessed by crystal violet staining of control and Paf knockdown (KD) mouse lung cancer cells (KP); two shRNAs targeting Paf (shPaf #1 and #2) were used. (B) Cumulative population doublings of control and Paf KD KP cells. (C) Cumulative population doublings of two different KP mouse lung cancer cell lines with Paf KD (KP836 and KP952 were established from two different Ad-Cre–induced KP mice). (D) Cumulative population doublings for Paf rescue experiment in Paf KD KP cells. Cells were stably transduced with PAF. (E) Cell proliferation analysis of human LUAD cell lines with PAF KD; cumulative population doublings of five LUAD cell lines (A549, H23, H358, H1792, and H1355) that were stably transduced with lentiviruses encoding shPAF#1 or #2. Two-way ANOVA with Tukey post hoc test.
(F-J) G0/G1 arrest by PAF KD in mouse and human LUAD cells. (F) Cell cycle distribution of control (shCtrl) and PAF KD (shPaf) mouse lung cancer cells was assessed by propidium iodide (PI) staining followed by fluorescence-activated cell sorting (FACS) analysis (n = 30,000 cells). (G) Cell cycle distribution of control (shCtrl) and PAF-depleted (shPAF) human lung cancer cells (A549 and H1792); PI staining with FACS analysis, n = 30,000 cells. (H) Analysis of cell cycle distribution in synchronized control and Paf-depleted KP cells by thymidine double block and PI staining-FACS analyses. (I) Visualization of G0/G1 cells by nuclear localization of DHB-Venus in control and Paf KD A549 and H1792 lung cancer cells stably transfected with shCtrl or shPAF with DHB-Venus; scale bars = 50 μm. (J) Quantification of nuclear localization of DHB-Venus in control and PAF KD A549 and H1792 cells; n > 500 cells in at least 10 different fields were counted.
(K and L) Increase of cell quiescence (G0) by PAF KD. (K) Density scatter plots of control versus PAF KD H1792 cells. G0 cells were assessed by pyronin Y and 7-aminoactinomycin D (7-AAD) double staining followed by FACS analysis; cells with low RNA content (low pyronin Y) in G0/G1 phase were considered as G0 cells (Schmid et al., 2000). (L) Quantification of cell cycle phases in H1792 cells (control and PAF KD).
Representative images are shown; error bars: SEM; *P < 0.05; **P < 0.01; ***P < 0.001.
We next examined the effects of PAF depletion on the cell cycle. Fluorescence-activated cell sorting (FACS) analysis showed that the population of PAF-depleted lung cancer cells at the G0/G1 phase was higher than that of control mouse and human lung cancer cells (Figures 3F, 3G, and S3J). Cell synchronization assays further showed that Paf KD induced G0/G1 arrest in KP cells and extended the cell division time (Figure 3H). Nuclear and cytosolic localization of a fluorescent CDK2 activity sensor, DHB-Venus, indicates G0/G1 and non-G0/G1 phases, respectively (Spencer et al., 2013). Consistent with FACS results, the CDK2 reporter assay showed an increased G0/G1 population of PAF-depleted lung cancer cells (Figures 3I and 3J). A time-lapse analysis showed that PAF KD lung cancer cells slowly or barely divided (Figure S3K). Consistently, we detected more PAF KD lung cancer cells than control cells at the G0 phase (Figures 3K and 3L). These results suggest that PAF depletion induces cell quiescence and growth arrest in LUAD cells.
Given the roles of PCNA in cell cycle regulation and DNA replication (Moldovan et al., 2007), we asked whether PAF depletion-induced phenotypes are due to the disruption of PCNA functions. Previous in vitro studies showed that the PIP motif (62QKGIGEFF69) of PAF is essential for binding to PCNA (Emanuele et al., 2011; Hosokawa et al., 2007; Jung et al., 2013; Povlsen et al., 2012). Also, it has been suggested that the ubiquitination of PAF at lysine (Lys) residues 15 and 24 is essential for PCNA binding to bypass the replication fork stalling that occurs when DNA is damaged (Povlsen et al., 2012). The PAF deubiquitination mutants (PAFK15R, PAFK24R, or PAFK15R/K24R) dissociates PAF from PCNA and induces replication fork stalling in S phase (Povlsen et al., 2012). We found that, similar to the PAF wild type (WT) cells (Figure S3G), the ectopic expression of PAF PIP mutant (PAF mutPIP) or PAFK15R, PAFK24R, or PAFK15R/K24R mutants, which no longer interact with PCNA, fully rescued PAF KD-induced cell growth inhibition (Figures S3L and S3M). These results suggest that PAF depletion-induced lung cancer cell quiescence is independent of the PAF-PCNA interaction.
PAF Positively Modulates Global Cell Cycle Genes Regulated by the DREAM Complex
PAF upregulates cell proliferation-related genes (Jun et al., 2013; Jung et al., 2013), which led us to explore the effects of PAF expression on gene regulation during lung tumorigenesis. For this purpose, we used mouse KP (KrasG12D/+/Trp53 KO) and human LUAD (H1792, KRAS/TP53-mutated) cell lines for transcriptional profiling. RNA sequencing (RNA-Seq) with Gene Set Enrichment Analysis (GSEA) determined that cell cycle-related genes were markedly enriched in both mouse and human PAF-activated gene sets (Figures 4A, 4B, S4A, and Table S2). Notably, the DREAM complex-controlled gene sets, which are generally associated with cell cycle regulation and cell quiescence, were significantly enriched both in mouse and human PAF-activated gene sets (Figures 4B-4D, Tables S2 and S3). Also, the G2/M phase-related and E2F4-bound gene sets, which are regulated by the DREAM complex, were highly enriched in the mouse and human PAF-related transcriptomes (Figures 4B and 4C). Moreover, these PAF-upregulated DREAM target genes were also associated with the gene set of poor LUAD survival (Figures 4B, 4C, 4E, and Table S3) (Director's Challenge Consortium for the Molecular Classification of Lung et al., 2008). Quantitative real-time polymerase chain reaction (qRT-PCR) analysis validated the downregulation of DREAM target gene expression by PAF KD in murine KP and human LUAD cells (Figures 4F and 4G). Furthermore, in silico analyses showed a strong pattern of co-expression of PAF with the DREAM complex target genes in LUAD patients (Figure S4B and Table S4). These results suggest that PAF positively modulates the global expression of cell cycle-related genes, governed by the DREAM complex.
Figure 4. PAF Positively Modulates Global Cell Cycle Genes Regulated by the DREAM Complex.

(A) Hierarchically clustered heatmaps of differentially expressed genes (DEGs) in control versus PAF-depleted mouse (KP) and human (H1792) lung cancer cells. DEGs were analyzed by RNA-Seq. Mean values are shown (n = 2).
(B) PAF-upregulated pathways in GSEA. Representative cell cycle- and cancer-related pathways that were highly enriched (high normalized enrichment score [NES] with the lowest P-values) and overlapped with PAF-upregulated pathways in mouse (KP) and human (H1792) lung cancer cell lines are shown. Complete GSEA results are in Table S3.
(C) GSEA plots for the DREAM_TARGETS, BOUND_BY_E2F4, and LUNG_CANCER_POOR_SURVIVAL pathways which were upregulated by PAF in mouse KP and human lung cancer H1792 cell lines. The Fischer_DREAM_TARGETS (gene set size, n = 967) gene sets were highly associated with PAF-upregulated genes.
(D) Venn diagram showing overlap of PAF and DREAM complex target genes. PAF upregulated a considerable number (n = 429/967, H1792 cells) of DREAM target genes.
(E) Venn diagram showing overlap of PAF-DREAM targets and genes related to poor lung cancer survival.
(F and G) Validation of expression of PAF-DREAM complex-regulated genes in control versus (F) PAF KD mouse (KP836 and KP952) and (G) human (A549 and H1792) lung cancer cell lines; qRT-PCR assays; error bars: SEM; *P < 0.05.
PAF Leads to Cell Quiescence Exit and Cell Proliferation via the DREAM Complex
Having observed the requirement of PAF for G0/G1 bypass, cell proliferation, and the transcriptional activation of DREAM target genes (see Figures 3 and 4), we next asked whether the repressive DREAM complex mediates PAF depletion-induced cell quiescence and growth arrest. Dual-specificity tyrosine phosphorylation-regulated kinase 1A (DYRK1A) phosphorylates serine residue 28 (Ser28) of LIN52, a component of the MuvB complex that is required for the interaction between p130 and the MuvB complex to form the repressive DREAM complex for G0/G1 arrest (Litovchick et al., 2011). Conversely, harmine, an inhibitor of DYRK1A, suppresses the Ser28 phosphorylation of LIN52 and dissociates p130 from the MuvB complex, which results in bypass of G0/G1 arrest (Litovchick et al., 2011). Intriguingly, harmine treatment reduced G0/G1 arrest in PAF-depleted murine KP and human LUAD cells (Figures 5A-5C and S5A-S5E). To complement our harmine treatment experiments, we also depleted the endogenous DYRK1A (using shRNA) and ectopically expressed the LIN52S28A mutant that no longer binds to p130 in a dominant-negative fashion (Litovchick et al., 2011). Similar to the harmine treatment results, DYRK1A depletion or LIN52S28A mutant expression reduced the G0/G1 arrest induced by PAF depletion (Figures 5D, 5E, S5F and S5G). Furthermore, the genetic ablation of endogenous p130 also reduced the G0/G1 arrest and rescued the cell growth inhibition induced by PAF KD (Figures 5F-5K). These results suggest that the repressive DREAM complex mediates PAF depletion-induced cell quiescence and growth arrest.
Figure 5. PAF leads to cell quiescence exit and cell proliferation through repression of the DREAM complex.

(A-C) Harmine treatment rescues the G0/G1 arrest of PAF-depleted A549 (A) and H1792 (B) cells. (C) quantifications of cell cycle distribution shown in A, B, and Figure S5C. The cell cycle distribution of each cell line was analyzed by PI staining and FACS.
(D and E) Ectopic expression of LIN52S28A mutant that no longer binds to p130 in a dominant-negative manner rescues the G0/G1 arrest of PAF KD A549 cells. (D) The cell cycle phases in the indicated conditions were analyzed by FACS with PI staining. LIN52 wild-type (WT) cells served as a control group. (E) Quantification of cell cycle phases.
(F-K) p130 KO rescues the G0/G1 and growth arrest induced by PAF KD. (F) Immunoblotting validation of p130 KO in A549 cells targeted by the CRISPR/Cas9 system (five sgRNAs were used). (G) Cumulative population doublings of PAF KD A549 cells with p130 KO (two sgRNAs [#2 and #4]). Two-way ANOVA with Tukey post hoc test. (H and J) Cell cycle analysis of PAF KD with p130 KO (sgCtrl versus p130 KO) in A549 and H1792 cells; PI staining and FACS. (I and K) Quantification of cell cycle phases in H and J.
(L-O) PAF per se induces cell quiescence exit and dissociation of p130 from DREAM complex target promoters. (L) Immunoblotting validation of PAF ectopic expression in 3T3 cells, in which PAF is not expressed. (M) PAF ectopic expression reduces the serum starvation-induced G0/G1 phase of 3T3 cells; PI staining-FACS analysis. (N) Quantification of cell cycle phases. (O) PAF inhibits the recruitment of p130 to the DREAM complex target gene promoters of serum-starved 3T3 cells. ChIP-qPCR analysis of the DREAM target gene promoters (Plk1 and Ccnb1) from each cell line (3T3, 3T3 in serum starvation, and 3T3 ectopically expressing PAF in serum starvation); the ActB promoter served as a negative control.
Representative images are shown; error bars: SEM; *P < 0.05; **P < 0.01.
To complement the PAF loss-of-function approaches, we also employed a gain-of-function approach by ectopically expressing PAF in cells that did not express it. 3T3 cells contain the intact DREAM complex machinery (Litovchick et al., 2011) but display no expression of PAF (see Figure 1J) (Hosokawa et al., 2007; Liu et al., 2012). We found that PAF expression reduced cell quiescence induced by serum starvation in 3T3 cells (Figures 5L-5N). Moreover, PAF expression diminished the serum starvation-induced recruitment of p130 to the DREAM target gene promoters (Figure 5O). These results suggest that PAF expression per se is sufficient to bypass cell quiescence, possibly via the DREAM complex.
PAF Binds to RBBP4 and Antagonizes DREAM Complex Formation by Inhibiting p130 Recruitment
To dissect the underlying mechanism by which PAF modulates the DREAM complex, we sought to identify PAF-interacting proteins using tandem affinity purification and mass spectrometry (TAP-MS) of nuclear extracts of HeLa S3 cells stably expressing an epitope-tagged PAF protein, as recently performed (Jung et al., 2018). Intriguingly, TAP-MS identified RBBP4, a component of the MuvB core in the DREAM complex, as a binding partner of PAF (Figure 6A and Table S5). Co-immunoprecipitation (IP) validated the PAF-RBBP4 interaction in mouse and human lung cancer cells at both the exogenous and endogenous levels using anti-PAF and anti-RBBP4 antibodies (Figures 6B, S6A, and S6B). We also found that PAF interacts with LIN9 and LIN54, which are also MuvB core subunits, and the transcription factor BMYB, but not with p130 and E2F4 (Figures S6C-S6F). We searched for putative PAF-binding motifs in RBBP4 based on the existing amino acid sequences of PAF-interacting proteins. RBBP4 serves as a platform for transcriptional complexes to bind to the chromosome (histone H4); this binding is mediated by the C-terminus of RBBP4 (Zhang et al., 2013). RBBP4 is composed of seven WD (Trp-Asp) repeats, followed by the extruded region (D346-G362 amino acids [AA]). We located a putative PAF-binding site (D-L-S-x-I-G) in RBBP4’s extruded region that was similar to one of PAF’s interaction motifs in PCNA (De Biasio et al., 2015) (Figures 6C, 6D, and S6G-S6J). Of note, the PAF-PCNA interaction mainly happens through the PIP motif (Q62-F69 AA) of PAF, but the interaction between PAF N51-T58 AA and PCNA R149-D156 AA regions also partially contributes to the PAF-PCNA interaction (De Biasio et al., 2015) (Figures 6D and S6H). Binding domain mapping analysis showed that this extruded region (S346-E352 AA) of RBBP4 is essential for the PAF-RBBP4 interaction (Figure 6E). Moreover, we validated that the RBBP4-binding motif (RBM) is required for RBBP4 binding in lung cancer cells by using PAF RBM mutant (mutRBM) (Figures 6F and 6G).
Figure 6. PAF Binds to RBBP4 and Antagonizes DREAM Complex Formation by Inhibiting p130 Recruitment.

(A) Identification of PAF-interacting proteins. HeLa S3 cells stably expressing PAF were processed for TAP–MS/MS. PAF-interacting protein candidates were listed.
(B) Endogenous interaction between PAF and RBBP4. Co-immunoprecipitation (IP)-immunoblotting (IB) analysis in A549 cells. PAF-IP (upper panel) and RBBP4-IP (lower panel). Immunoglobulin IgG: negative control for IP; LC: light-chain of IgG.
(C) Comparative amino acid sequence analysis of potential PAF binding motif in RBBP4 with that in PCNA. Pale green dots: AAs for PAF binding in RBBP4 and PCNA; violet dots: AAs for Histone H4 (HH4) binding in RBBP4.
(D) Potential RBBP4-binding motif (RBM) in PAF. Putative RBM (51NPVCVRPT58) is located in PCNA-interacting region. Of note, PAF binds to PCNA via PIP motif (62QKGIGEFF69) and 51NPVCVRPT58 region (De Biasio et al., 2015).
(E) In vitro binding assay of mutant RBBP4 (Δ347-362 and Δ348-352) with PAF. Each protein generated by in vitro transcription and translation was used for co-IP and IB.
(F and G) Putative RBM sequence of PAF is required for RBBP4 binding. Amino acid sequences of PAF wild-type (PAF WT), PAF RBM mutant (PAF mutRBM), and PAF PIP mutant (PAF mutPIP)(F). Binding assay of RBBP4 with FLAG-tagged PAF WT and PAF mutRBM (G). Stably transfected A549 cells were used for co-IP and IB.
(H) Enrichment of the DREAM components on target gene promoters. The promoter occupancy of p130, RBBP4, and LIN54 on the representative DREAM complex target gene promoters (CCNB1, TOP2A, PLK1, and UBE2C) were analyzed by ChIP-qPCR using human (H1792; control: EV [empty vector] versus shPAF).
(I and J) Increased association of p130-E2F4 with MuvB complex by PAF depletion. Co-IP analysis of DREAM complex using anti-p130 (I) or anti-E2F4 (J) antibodies in control versus PAF KD KP and H1792 cells. IgG served as a negative control for co-IP.
(K) Enrichment of PAF on the DREAM target gene promoters. A549 cells stably expressing FLAG-PAF were analyzed by ChIP-qPCR. No-antibody condition and GAPDH served as negative controls.
(L) Inhibition of p130-RBBP4 binding by PAF. In vitro competition assay of p130, RBBP4, and PAF. In vitro transcribed and translated p130, RBBP4, and PAF proteins were mixed and processed for co-IP and IB. Asterisks indicate the IgG heavy chain.
(M and N) The replacement of RBBP4 with RBBP4 Δ347-362 mutant induced G0/G1 arrest. The cell cycle phases were analyzed in A549 cells that transiently expressed shRBBP4 with GFP (control), RBBP4 wild-type (RBBP4 WT), or RBBP4 Δ347-362 mutant (RBBP4 Δ347-362). PI staining with FACS analysis (M) and the quantification of cell cycle phases (N).
(O and P) The PAF mutRBM could not rescue the G0/G1 arrest induced by PAF depletion. The cell cycle phases were analyzed in A549 shPAF cells that stably expressed GFP (control), PAF wild-type (PAF WT), or PAF mutRBM. PI staining with FACS analysis (O) and the quantification of cell cycle phases (P).
(Q) The illustration of the working model, PAF-deregulated DREAM complex for cell quiescence exit and proliferation. PAF dissociates p130-E2F4, gene repression unit, from the DREAM complex, leading to transactivation of the cell proliferative genes (DREAM targets) and promote cell quiescence exit and proliferation of lung cancer cells.
The representative images were shown; error bars: SEM; *P < 0.05; **P < 0.01; ***P < 0.001.
Given the requirement of PAF for DREAM target gene transactivation and the PAF-RBBP4 interaction, we next asked whether PAF directly modulates the DREAM complex on the promoters of DREAM target genes. Chromatin immunoprecipitation (ChIP) experiments showed that PAF depletion increased recruitment of p130, RBBP4, and LIN54 to the promoters of the DREAM target genes (CCNB1, TOP2A, PLK1, and UBE2C) in both human (H1792) and mouse (KP) lung cancer cells (Figures 6H and S6K). Also, co-IP results showed that PAF KD increased the interaction between the inhibitory components (p130 and E2F4) and MuvB core subunits (RBBP4, LIN54, and LIN9) in mouse and human lung cancer cells (Figures 6I and 6J). Of note, ChIP and sequential ChIP assays showed that PAF occupied the DREAM target gene promoters in association with the MuvB core components (RBBP4 and LIN54) and BMYB in human and mouse lung cancer cells (Figures 6K and S6L).
On the basis of PAF’s interaction with RBBP4 and co-occupancy of the DREAM target gene promoters, we next tested whether PAF negatively regulates the repressive DREAM complex formation on target gene promoters. Based on the p130-RBBP4 interaction (Litovchick et al., 2011) and PAF-RBBP4 binding, we speculated that PAF might inhibit the binding of p130 to RBBP4. In vitro pull-down assays showed that PAF reduced the p130-RBBP4 interaction in a dose-dependent manner (Figure 6L). To further validate our hypothesis, we replaced endogenous RBBP4 with a PAF binding-deficient RBBP4 mutant (Δ347-362). Of note, RBBP4 KD induced severe cell cycle arrest and induced cell death at a later time point compared to control cells (Figure 6M). Replacement of endogenous RBBP4 by RBBP4 wild-type (WT) rescued the cell cycle arrest, whereas the RBBP4 Δ347-362 mutant induced cell cycle arrest at G0/G1, similar to PAF depletion (Figures 6M and 6N), indicating that the PAF-RBBP4 interaction is required for the exit of cell cycle arrest. We confirmed that RBBP4 Δ347-362 mutant maintains the interaction with DREAM complex and its enrichment on the DREAM complex target gene promoters (Figures S6M and S6N). Moreover, the RBBP4 binding-deficient PAF mutant (Figure 6G) could not rescue the PAF depletion phenotypes, whereas PAF WT and PAF mutPIP did fully rescue the cell cycle arrest (Figures 6O, 6P, and S6O). These data indicate again that the PAF-RBBP4 interaction is crucial for remodeling the repressive DREAM complex for cell quiescence exit. Briefly, PAF binds to RBBP4 and blocks the repressive DREAM complex formation via inhibition of p130 binding to RBBP4, which leads to transcriptional activation of cell proliferation-related DREAM target genes (Figure 6Q).
Suppression of Lung Tumorigenesis by Pharmacologically Mimicking PAF-DREAM Axis Inhibition
Given the significant suppression of in vivo lung tumorigenesis by Paf KO, we next sought to address whether pharmacological mimicking of global PAF-DREAM target gene downregulation could confer vulnerability to lung cancer cell growth. To identify chemicals that downregulate PAF-DREAM complex target genes, we employed Connectivity Map (CMAP, https://clue.io/cmap), a drug repurposing tool (Subramanian et al., 2017) (Table S6). Based on the high correlation of gene signatures between PAF KD transcriptomes (both human and mouse) and ones induced by chemicals, we selected 13 candidates from among 2,837 chemical compounds for further validation (Figures 7A, 7B, and Table S6). We next analyzed the clinical availability of the 13 chemical compounds and their effects on G0/G1 cell cycle arrest and DREAM target gene downregulation (Figures 7B-7D, S7A, and S7B), which identified pitavastatin and cyclosporin A (CsA) as potent chemicals mimicking the PAF-depleted transcriptional signature. Indeed, treatment with pitavastatin or CsA reduced the growth of multiple LUAD cell lines in a dose-dependent manner (Figures S7C and S7D). Additionally, PAF overexpression partially restored the LUAD cell growth inhibited by pitavastatin or CsA (Figure 7E), which validated the PAF-dependent mode of these two chemicals. Moreover, harmine, which inhibits the repressive DREAM complex, rescued pitavastatin- or CsA-induced G0/G1 arrest of LUAD cells (Figures 7F, 7G, and S7E). Similarly, p130 KO also rescued pitavastatin- or CsA-induced LUAD cell growth arrest (Figure 7H). These data suggest that pitavastatin and CsA suppress lung cancer cell growth in a manner that is partially but prominently dependent on the PAF-DREAM axis.
Figure 7. Suppression of Lung Tumorigenesis by Pharmacological Mimicking of PAF-DREAM Axis Inhibition.

(A) Connectivity MAP (CMAP) analysis of PAF-depleted human (H1792) and mouse (KP) transcriptomes (RNA-Seq). The chemicals displaying perturbagens with high percentage of connection (PC) were selected for further analysis.
(B) Schematic of the screening for PAF depletion-mimicking drugs.
(C) G0/G1 arrest induced by pitavastatin and CsA. Cell cycle analysis of control versus pitavastatin- (1 μM, 24 h) and CsA- (5 μM, 24 h) treated KP lung cancer cells by FACS.
(D) Downregulation of DREAM target genes by pitavastatin (1 μM, 48 h) and CsA (5 μM, 48 h) in KP cells; qRT-PCR; error bars: SEM.
(E) Partial rescue of pitavastatin- or CsA-induced growth inhibition by ectopic expression of PAF. The cell growth of PAF-overexpressing (PAF-oe) A549 cells and parental cells treated with pitavastatin (5 μM) and CsA (5 μM) is shown.
(F-H) Rescue of pitavastatin- or CsA-induced growth inhibition by DREAM complex dissociation. Harmine treatment reduced the G0/G1 arrest induced by (F) pitavastatin or (G) CsA treatment; PI staining-FACS analysis. (H) p130 KO rescued the growth inhibition induced by pitavastatin or CsA treatment. Stably transduced sgCtrl and p130 KO (sgRNA2) A549 cells were used.
(I-L) Growth inhibition of LUAD xenografts by pitavastatin or CsA. Immunocompromised mice were subcutaneously injected with H1792 cells. (I) Relative tumor volumes of vehicle- (n = 4) or pitavastatin- (n = 6) treated H1792 xenografts. (J) Reduced cell proliferation of H1792 xenografts by pitavastatin; quantification of Ki67 staining in vehicle- versus pitavastatin-treated H1792 xenografts. (K) Relative tumor volumes of vehicle- (n = 3) or CsA- (n = 4) treated H1792 xenografts. (L) Reduced cell proliferation of H1792 xenografts by CsA; quantification of Ki67 staining in vehicle- versus CsA-treated H1792 xenografts. Tumors were monitored for 6 weeks. Images of xenograft tumors at the endpoints are shown, error bars: SD. Student t-test was used in (J) and (L). Two-way ANOVA with Tukey post hoc test was used in I and K.
(M-P) Inhibition of LUAD PDX growth by pitavastatin. (M) Relative tumor volumes of TC241 PDXs treated with vehicle (n = 5) or pitavastatin (n = 5, 10 mg/kg); error bars: SD. Two-way ANOVA with Tukey post hoc test. (N and O) Reduced PAF expression and cell proliferation of PDX by pitavastatin. (N) Representative images of PAF and Ki67 immunostaining and (O) quantification of Ki67 in vehicle- versus pitavastatin-treated TC241 PDXs; error bars: SD. (P) Downregulation of DREAM target gene expression by pitavastatin; qRT-PCR (n = 3), error bars: SEM.
(Q-T) Inhibition of LUAD PDX growth by CsA. (Q) Relative tumor volumes of TC241 PDXs treated with vehicle (n = 6) or CsA (n = 6, 10 mg/kg); error bars: SD. Two-way ANOVA with Tukey post hoc test. (R and S) Reduced PAF expression and cell proliferation in PDXs by CsA. (R) Representative images of PAF and Ki67 immunostaining and (S) quantification of Ki67 in the vehicle- versus CsA-treated TC241 PDXs; error bars: SD. (T) Downregulation of DREAM target gene expression by CsA; qRT-PCR (n = 3), error bars: SEM.
Representative images are shown; *P < 0.05; **P < 0.01; ***P < 0.001.
Next, we assessed the impact of pitavastatin and CsA on in vivo tumor growth. Treatment of xenograft-bearing mice with either pitavastatin or CsA markedly inhibited the in vivo tumor growth of LUAD cell line xenografts and KRAS/TP53-mutated LUAD PDXs (TC241) with reduced PAF expression and cell proliferation (Figures 7I-7L, 7M-7O, 7Q-7S and S7F). Also, we confirmed the downregulation of DREAM target genes in pitavastatin- or CsA-treated PDX tumors (Figures 7P and 7T). These results suggest that the pharmacological mimicking of PAF depletion inhibits in vivo lung tumor growth.
DISCUSSION
Accumulating evidence suggests the potential repressive role of the DREAM complex in lung tumorigenesis. For instance, the deletion of p130, an inhibitory subunit of the DREAM complex, accelerates lung tumorigenesis (Ho et al., 2009), but the ablation of Lin9, a core subunit of the MuvB complex, suppresses it (Reichert et al., 2010). Furthermore, the DREAM target genes FOXM1 and ECT2 were identified as biomarkers of poor prognosis in lung cancer patients and are required for tumorigenesis (Arinaga et al., 2003; Fields and Justilien, 2010; Justilien et al., 2017; Kim et al., 2006; Wang et al., 2014). However, how the DREAM complex is deregulated in lung tumorigenesis remains elusive. Our comprehensive approaches identified PAF as an RBBP4-interacting protein. PAF remodels the repressive DREAM complex formation by inhibiting recruitment of p130 to the MuvB complex, which transactivates global expression of cell proliferation-related DREAM complex target genes. Moreover, the overexpression of the PAF-DREAM target gene sets is closely correlated with poor clinical outcomes in LUAD (Figure 4E and Table S3), suggesting a pivotal role of the PAF-DREAM axis in lung tumorigenesis.
It is noteworthy that PAF has been previously reported as a target of the DREAM complex (Beshiri et al., 2012; Fischer et al., 2016). Here, we found that PAF, as a downstream target of RAS signaling (see Figure 1), inhibits formation of the DREAM complex and induces global expression of cell cycle-regulating genes, indicating a potential positive feedback mechanism between RAS and the PAF-DREAM axis. Although our experimental results ruled out the involvement of PCNA in PAF-induced cell quiescence exit and cell proliferation (see Figures S3L and S3M), we cannot completely exclude the impacts of PAF-mediated DNA repair and DNA replication on lung tumorigenesis. Nonetheless, recent studies also showed that PAF’s oncogenic roles are independent of PCNA-mediated DNA repair and DNA replication (Kim et al., 2018; Ong et al., 2017; Wang et al., 2016). Moreover, PAF ectopic expression per se accelerates the cell cycle (Emanuele et al., 2011) and induces cell transformation (Hosokawa et al., 2007; Kim et al., 2018; Liu et al., 2012; Wang et al., 2016). Also, PAF and PCNA show different cellular expression patterns in vivo (Kim et al., 2018) (see also Figure 2). Moreover, Paf KO mice are viable without any discernible phenotypes (Kim et al., 2018), whereas Pcna KO is embryonically lethal in mice (Moldovan et al., 2007). Most importantly, PAF mutants that no longer bind to PCNA are still engaged in LUAD cell proliferation (Figures S3L, S3M, 6G, 6O, 6P, and S6O). Hence, our results and those of previous studies support the notion that independently of PCNA, PAF remodels the DREAM complex for cell quiescence exit and cell proliferation for lung tumorigenesis. Whereas PAF hyperactivates Wnt/β-catenin signaling as a co-factor of the β-catenin transcriptional complex in colorectal cancer (Jung et al., 2013), we observed that PAF did not alter Wnt/β-catenin signaling in LUAD cells (see Figure 4), implying that PAF-mediated gene regulation might be somehow context-dependent.
Although PAF is essential for lung tumorigenesis, Paf KO mice display no overt phenotypes (Kim et al., 2018), indicating that PAF is dispensable for development and tissue homeostasis. However, the genetic ablation of Lin9, Bmyb, or Foxm1, DREAM complex components, leads to embryonic lethality in mice (Krupczak-Hollis et al., 2004; Reichert et al., 2010; Tanaka et al., 1999). Therefore, molecular targeting of PAF rather than the DREAM complex may be appealing as a cancer therapy because it is likely to have minimal effects on normal cells. The synthetically lethal interaction between PAF and RAS oncogene (Luo et al., 2009) also implies the potential of PAF targeting for treatment of RAS-dependent cancers.
Our drug repurposing approach could include cytostatic drugs, which might also inhibit cell growth along with DREAM target gene downregulation. However, it should be noted that not all of the 13 drugs identified from our CMAP analyses induced G0/G1 arrest and downregulated DREAM target genes (See Figures S7A and S7B), indicating how transcriptome-based drug repositioning (CMAP) differs from conventional drug screening. As is common with cytostatic drugs, it remains unclear whether the withdrawal of drugs targeting the PAF-DREAM axis would restore cancer cell growth, a topic that needs to be addressed in future studies.
Our transcriptome-based drug repositioning and validation analyses determined that pitavastatin and CsA mimic the transcriptional signatures of PAF depletion, but how pitavastatin and CsA suppress DREAM target genes remains unclear. Pitavastatin is a third-generation lipophilic statin that inhibits the mevalonate pathway (Duggan, 2012). However, among the statins in our CMAP analysis (n = 13 total perturbagens), only pitavastatin strongly mimicked the PAF-depleted transcriptome (see Table S6). Thus, further studies regarding pitavastatin’s specific inhibitory effects on lung cancer growth are required. CsA has been used as an immunosuppressive drug for patients undergoing organ transplantation and those with autoimmune disease; it decreases T-cell activity through inhibiting Ca2+ signaling (Dunn et al., 2001). Also, CsA has been recently tested for treatment of several advanced cancers in combination with other drugs (https://clinicaltrials.gov/: NCT00983424, NCT02188264 and NCT00003950). Our CMAP analysis also identified two other Ca2+ regulatory drugs, NNC-55-0396 and FK506. Both CsA and FK506 interfere with Ca2+-NFAT signaling (Mancini and Toker, 2009), which is implicated in cancer. Though the mechanisms of action of pitavastatin and CsA need to be further explored in the future, we demonstrated that both drugs suppress lung tumor growth via suppressing the PAF-DREAM axis (see Figures 7E-7H), in line with the significant suppression of mouse lung tumorigenesis by Paf KO. These results strongly suggest that pharmacological intervention targeting the PAF-DREAM axis might confer therapeutic vulnerabilities in lung cancer.
In sum, our study unveiled how PAF deregulates the DREAM complex to promote cell quiescence exit and proliferation for lung tumorigenesis. Furthermore, our comprehensive approaches propose the PAF-DREAM axis as a target for lung cancer treatment.
Limitations
Although our comprehensive RNA-Seq analysis validated the regulation of global DREAM complex target genes by PAF, we cannot exclude the possibility that PAF is also associated with the regulation of other pathways that promote lung cancer progression. For instance, as RBBP4 is implicated in a variety of histone modification complexes, such as the PRC2 complex, the PAF-RBBP4 interaction may also affect other transcriptional machinery. Additionally, although we validated the PAF/DREAM complex-dependent inhibitory effects of pitavastatin and CsA on lung cancer cell growth, the underlying mechanisms by which pitavastatin and CsA suppress DREAM-regulated global cell cycle genes remain unclear and need further study.
STAR METHODS
RESOURCES AVAILABILITY
Lead Contact:
Additional information and requests for resources and reagents should be directed to and will be fulfilled by the Lead Contact, Jae-Il Park (jaeil@mdanderson.org).
Materials Availability:
The materials will be available upon request.
Data and Code Availability:
Raw data are available from Mendeley Data under: doi:10.17632/vdz3856jdy.1. The accession numbers for RNA-Seq data reported in this paper are GSE136571 and GSE147305.
EXPERIMENTAL MODELS AND SUBJECT DETAILS
Mice
All mouse experiments were approved by the MD Anderson Institutional Animal Care and Use Committee (IACUC) and performed under MD Anderson guidelines and Association for Assessment and Accreditation of Laboratory Animal Care (AAALAC) international standards. Paf KO mice from a previously established model (Kim et al., 2018) were used. KrasLSL-G12D/+ (#008179) and Trp53floxed/floxed (#008462) mice were obtained from the Jackson Laboratory. KrasLSL-G12D/+;Trp53floxed/floxed (KP), Paf−/−; KrasLSL-G12D/+ (PK), and Paf−/−; KrasLSL-G12D/+; Trp53floxed/floxed (PKP) compound strains were generated by breeding, with validation of genotypes as previously described (DuPage et al., 2009). To induce murine lung tumors, male and female mice (8–10 weeks old) were anesthetized by isoflurane and intratracheally administered 2.5 × 10⁷ plaque-forming units of Ad-Cre (The University of Iowa Viral Vector Core Facility).
Cell lines and cell culture
Human NSCLC cell lines (A549, H358, H460, H23, H1792, H1975, H1355, and H1299) and NIH/3T3 cell line were purchased from ATCC. All NSCLC cell lines were grown in RPMI 1640 medium with 10% fetal bovine serum (FBS) and 1% penicillin/streptomycin (10,000 U/mL). NIH/3T3 cells were grown in Dulbecco’s modified Eagle medium (DMEM) with 10% FBS and 1% penicillin/streptomycin. To establish murine lung cancer cell lines, 4 to 10 weeks after Ad-Cre infection, lung tumor nodules of KP mice were collected, minced, and dissociated with Trypsin LE. The cell lines were established after eight passages with complete removal of fibroblasts. Murine lung cancer cell lines (KP cell lines) were maintained in DMEM with 10% FBS and 1% penicillin/streptomycin (10,000 U/mL). Three murine KP cell lines (KP836, KP952, and KP944) were derived from three different KP mice. Genotyping of KP cell lines was confirmed by genomic DNA PCR as previously described (DuPage et al., 2009) (See Figure S3A).
Xenograft Transplantation
Female 6- to 8-week-old BALB/c nude mice were used for xenograft transplantation assays. For H1792 cell line xenografts, 5 × 10⁶ cells were mixed in a 50% volume of Matrigel (BD Bioscience) and subcutaneously injected into the dorsal flank of the mice. For PDXs (Patient-derived xenografts) transplantation, early passages (P < 6) of human LUAD sample TC241, which harbors KRAS oncogenic (G12S) and TP53 inactivating mutations (R209W), were used. Tumors were cut into pieces, and one piece of tumor was implanted per mouse. After injection or transplantation, mice were monitored daily. Caliper measurements started when tumors became visible. Tumor volumes were measured every 2 days and calculated using the following formula: tumor volume (mm3) = (l × w2) / 2, in which l (length) and w (width) refer to the long and short diameters of 2 perpendicular tumor axes, respectively. When tumor volume reached 50~70 mm3, mice were randomly assigned to treatment groups and treated with vehicle, pitavastatin (10 mg/kg), or CsA (10 mg/kg) every 2 days. Treated mice were monitored daily. Lung tumors were collected for immunohistochemistry (IHC) and qRT–PCR at 40~60 and 50~80 days after treatment, respectively. All animal procedures were performed in accordance with the guidelines of the AAALAC and with institutionally (MD Anderson Cancer Center) approved protocols (IACUC #00001377).
Human samples
PDXs were generated in accordance with protocols approved by the Institutional Review Board at The University of Texas MD Anderson Cancer Center (IRB # Lab10-0704) and IACUC (IACUC #00001377). The study was compliant with all relevant ethical regulations regarding research with animals and human participants. Information on human research participants (gender, age, pathology, mutation, and treatment categories) used in transplantation is listed in Table S7.
METHOD DETAILS
PAF expression analysis in silico and in tissue microarrays
In silico analysis of PAF expression in lung cancer patients was analyzed using Oncomine (www.oncomine.org) and the GEO database (www.ncbi.nlm.nih.gov/geo). For Oncomine data, we analyzed cDNA microarray data sets of all cancers and normal tissue samples (P < 0.0001; fold change > 2; 10% top-ranked). The accession number GDS1650 with probes and 38116_at was selected for GEO analysis. For assessing PAF expression in human lung cancer samples, lung cancer tissue microarrays (BC041115c and LC721; Biomax) were used for IHC using a PAF (G-11) antibody.
Kaplan–Meier survival analysis
Kaplan–Meier survival analysis was performed using the publicly available database Kaplan-Meier Plotter (http://kmplot.com/analysis/). In the lung cancer gene-chip data set, the correlation analysis was performed with the following options: two probes for PAF/KIAA0101 (202503_s_at and 211713_x_at); splitting patients by median; follow-up threshold: 60 months; restrict analysis to subtypes of histology: NSCLC, LUAD, and LUSC. In the pan-cancer RNA-Seq data set, the correlation analysis was performed with the following options: RNA-Seq ID: PCLAF (PAF/KIAA0101); splitting patients by median; follow-up threshold: 60 months; restrict analysis to subtypes of histology: LUAD and LUSC; log-rank test.
Plasmids, transfections, and viral infections
Viral infection and selection of human NSCLC cell lines were performed as previously described (Jung et al., 2013). Human shRNAs against PAF (shPAF#1, TRCN0000278496; shPAF#2, TRCN0000278497) were used for generating PAF KD cells. To obtain stable Paf KD murine lung cancer cell lines, shRNAs against Paf (GIPZ mouse Pclaf shRNA, Dharmacon; V2LMM_11233, V2LMM_16348) were used. Lentivirus-infected KP cells were sorted by FACS (GFP positive) and continuously selected by puromycin (2~5 μg/mL). Cell lines transfected with shGFP (TRC shRNA) or empty vector (GIPZ empty) were used as controls. Plasmids encoding the open reading frames of PAF and RBBP4 were obtained from the Functional Genomics Core Facility at MD Anderson Cancer Center. All gene expression plasmids were constructed from cDNA libraries or ORF sources using PCR and cloned into pcDNA-3xFLAG (N-terminus) or pLenti-3xFLAG (N terminus)-hygro mammalian expression plasmids, as previously performed (Jung et al., 2013). pLenti-3xFLAG (N terminus)-hygro plasmids were used for rescue experiments (hygromycin selection, 150~200 μg/mL). Mutant constructs were generated by site-directed mutagenesis using PCR. The pcDNA-HA-p130 plasmid was kindly provided by Larisa Litovchick.
CRISPR/Cas9 gene editing
Knockout (KO) of p130 was performed by CRISPR/Cas9 genome editing using pLentiCRISPRv2 (Addgene plasmid #52961). Five single guide RNA (sgRNA) targeting sequences against exon 1 of p130 were designed using Benchling software (https://www.benchling.com/crispr/) and cloned into a pLentiCRISPRv2-hygro vector. An empty sgRNA vector was used as a negative control. After 1 week of selection with 150 μg/mL hygromycin, the pool of lentivirus-infected A549 shPAF#2 cells were collected and subjected to Western blotting to determine the p130 protein level. The five targeting sequences against p130 were: #1: 5′-GGGTGCGCTATGCCGTCGGG-3′, #2: 5′-CTCAGATCCAGCAGCGGTTC-3′, #3: 5′-CCTCAACATGGACGAGGCGG-3′, #4: 5′-CAGCATGAGCGAAAGCTACA-3′, and #5: 5′-CATGAGCGAAAGCTACACGC-3′.
RNA-sequencing and GSEA
The total RNA from shCtrl- and shPAF-infected KP and H1792 LUAD cells (two biological replicates, n = 2) were used for RNA-Seq. Generation of mRNA libraries, transcriptome sequencing with differential expression analysis were performed by Novogene using an Illumina Hiseq PE150 system. Reads were mapped by Tophat2, and differentially expressed genes were defined by the DESeq2 package for R as padj < 0.05 (mouse) and padj < 0.01 (human). GSEA analysis was performed with normalized fragments per kilobase of transcript per million mapped reads (FPKM) of all genes with default parameters (number of permutations = 1000, collapse dataset = true, permutation type = gene-set, weighted [default, p = 1], and ranked metrics).
Co-expression analysis of PAF and DREAM complex targets
Genes whose expression was correlated with that of PAF were identified by cBioPortal (http://www.cbioportal.org/) using the datasets for LUAD (TCGA, pan-cancer, n = 503 and TCGA, Nature 2014, n = 230) and by co-expression analysis (mRNA expression Z-score threshold ± 2.0, Spearman correlation > 0.5, p-values and q-values < 10−5). Among the PAF co-expressed genes whose expression overlapped with that of DREAM targets are listed in Table S4.
Gene expression analysis by qRT-PCR
RNAs were extracted by TRIzol (Invitrogen) and used to synthesize cDNAs using the iScript cDNA synthesis kit (Biorad). qRT-PCR was performed using an Applied Biosystems 7500 Real-Time PCR machine with the primers listed in Table S7. Target gene expression was normalized to that of mouse Hprt1 or human GAPDH. Comparative 2−ΔΔCt methods were used for the quantification of qRT-PCR results.
Cell cycle analysis
For cell cycle analysis, trypsinized cells were fixed with 70% ethanol for 2 h at −20 °C and washed twice with phosphate-buffered saline (PBS). Next, 1 × 10⁶ cells were resuspended and incubated with RNase A (20 μg/mL) and propidium iodide solution (50 μg/mL) for 30 min. Singlet cells were analyzed by FACS. For cell synchronization assays, cells were arrested in G1/S by double thymidine block, and released cells (S phase) were collected at each time point for FACS analysis. For the assessment of cells at G0, freshly ethanol-fixed cells (1 × 10⁶) were incubated with pyronin Y (1 μg/mL) and 7-aminoactinomycin D (7-AAD; 5 μg/mL) for 45 min at 37 °C, and low-RNA-content cells (low pyronin Y signals) were defined as G0 cells on FACS analysis (Schmid et al., 2000). For analysis of the cell cycle phases of DYRK1A KD cells, an shRNA (coexpressing a GFP reporter) against DYRK1A was transiently transfected into shPAF stably transfected H1792 cells. Cells were fixed with 4% paraformaldehyde. Cell cycle phases of GFP-positive (shDYRK1A-transfected) and GFP-negative (uninfected) H1792 cells were analyzed by FACS with 7-AAD staining. All cells were cultured at 60~80% confluence.
Cell growth assays
To measure cell proliferation, the same number of cells per well were seeded onto six-well plates in triplicate and grown for 3~6 days. Cell growth rates were analyzed by daily cell counting with a Bio-Rad TC10 automated cell counter or by measuring optical density (OD values, 590 nm) at the end point after crystal violet staining. For cell growth assays with chemical treatment, fresh chemicals were added to the media every 3 days.
Tandem Affinity Purification and Mass Spectrometry
TAP-MS was performed as previously described (Jung et al., 2018). Cells were collected in 15 mL ice-cold NETN buffer (20 mM Tris, pH 8.0, 100 mM NaCl, 0.5 mM EDTA, and 0.5% NP-40; freshly supplemented with proteinase and phosphatase inhibitors) and shaken at 4 °C for 20 min. Lysates were subjected to centrifugation at 4°C and 13,148 g for 15 min. Transferred supernatants were incubated with streptavidin-conjugated beads (Amersham) for 1 h at 4 °C. After three washes with NETN buffer, the beads were transferred to a new tube, and interacting proteins were eluted with 1.5 mL NETN buffer and 2 mg/mL biotin (Sigma) for 90 min at 4 °C. The eluted proteins were transferred and incubated with S-protein beads (Novagen) for 1 h. The beads were subjected to sodium dodecyl sulfate-polyacrylamide gel electrophoresis (SDS–PAGE) after three washing steps. Protein bands were excised and subjected to mass spectrometry analysis. After excised gel bands were cut into ~1 mm3 pieces, ingel trypsin digestion was performed. Dried samples were reconstituted in 5 μL of high-performance liquid chromatography (HPLC) solvent A (2.5% acetonitrile, 0.1% formic acid). By packing 5-μm C18 spherical silica beads into a fused-silica capillary (100-μm inner diameter × ~20-cm length) with a flame-drawn tip, a nanoscale reverse-phase HPLC capillary column was created. After the column was equilibrated, each sample was loaded onto the column using a Famos autosampler (LC Packings), and peptides were eluted with increasing concentrations of solvent B (97.5% acetonitrile, 0.1% formic acid). Eluted peptides were subjected to electrospray ionization and then entered into an LTQ Velos ion-trap mass spectrometer (Thermo). After peptides were detected, isolated, and fragmented to produce a tandem mass spectrum of specific fragment ions for each peptide, peptide sequences were determined by matching protein databases (the human IPI database version 3.6) with the acquired fragmentation patterns using the software program SEQUEST (version 28) (Thermo). The specificity of the enzyme was set to partially tryptic with two missed cleavages. Carboxyamidomethyl (cysteines, fixed) and oxidation (methionine, variable) were included in the modification. Mass tolerance was set to 2.0 for precursor ions and 1.0 for fragment ions. To achieve a false discovery rate of less than 1% at the peptide level, spectral matches were filtered based on the target-decoy method. Finally, only tryptic matches were reported, and spectral matches were manually examined. Peptides that matched to multiple proteins were assigned so that only the most logical protein was included (Occam's razor).
Immunoprecipitation and immunoblotting
For IP, whole-cell lysates were extracted using EBC lysis buffer (50 mM Tris, pH 7.4, 150 mM NaCl, 0.5% NP-40; freshly supplemented with protease and phosphatase inhibitor mixtures) for 30 min at 4 °C, followed by centrifugation (12000 g for 10 min). For IP analysis of exogenous protein-protein interactions, whole-cell lysates extracted from stable cells transfected with Flag-tagged PAF or RBBP4 were incubated for 2 h with 15 μL of M2 magnetic beads (Sigma; M8823). For IP analysis of endogenous protein-protein interactions, whole-cell lysates extracted from control or stably transfected KP or A549 cells (shGFP or shPAF) were incubated overnight with protein G Dynabeads (Thermo) and 2~5 μg antibodies against PAF (Santa Cruz), PAF (Abcam), RBBP4 (GeneTex), RBBP4 (Bethyl), p130 (Cell Signaling), E2F4 (Bethyl), LIN54 (Bethyl), BMYB (Abcam), and FOXM1 (Santa Cruz). After three to five washes with EBC lysis buffer, precipitates were eluted with SDS sample buffer and analyzed using immunoblotting. For analysis of PAF protein levels in NSCLC and PAF KD cells, radioimmunoprecipitation assay buffer (25 mM Tris, pH 7.4, 150 mM NaCl, 1% NP-40, 0.5% sodium deoxycholate, 0.1% SDS, and protease and phosphatase inhibitor mixtures) was used for whole-cell lysate preparation. For in vitro transcription and translation and binding assays, FLAG-PAF, FLAG-RBBP4, and HA-p130 were obtained with an in vitro TnT coupled system (Promega) and immunoprecipitated using anti-HA magnetic beads (Thermo). Immunoblot blocking and antibody incubation were conducted using 2% bovine serum albumin or 5% nonfat dry milk in TBST (25 mM, pH 8.0, 125 mM NaCl, and 0.1% Tween-20). SuperSignal West Pico and Femto (Thermo) were used to detect horseradish peroxidase-conjugated secondary antibodies. The following antibodies were used for immunoblotting: PAF (Santa Cruz, 1:5000), RBBP4 (GeneTex, 1:10000), p130 (Cell Signaling, 1:5000), E2F4 (Bethyl, 1:10000), E2F4 (Santa Cruz, 1:2000), LIN9 (Santa Cruz, 1:2000), LIN54 (Bethyl, 1:10000), FLAG M2 (Thermo,1:20000), and HA (Roche, 1:2000).
Chromatin immunoprecipitation
ChIP assays were performed as previously described with minor modifications (Kim et al., 2018; Litovchick et al., 2007). Briefly, cells were cross-linked with 1% formaldehyde for 15 min at room temperature. Formaldehyde was quenched by adding glycine (final concentration, 0.125 M). After the cells were washed with cold PBS, the cells were harvested with lysis buffer (20 mM Tris, pH 8.0, 85 mM KCl, 0.5% NP-40, freshly supplemented with a protease inhibitor mixture) and rocked at 4 °C for 15 min. Pellets containing chromatin were collected by centrifugation, resuspended in nuclear lysis buffer (50 mM Tris, pH 8.0, 10 mM EDTA, 1% SDS), and subjected to sonication (30 s on and 30 s off, 80 times, Bioruptor 300 [Diagenode]). The supernatant was collected by centrifugation and diluted 20 times in IP buffer (50 mM Tris, pH 8.0, 150 mM NaCl, 0.5% NP-40, and a protease inhibitor mixture) and subjected to IP with each antibody. The enrichment of 300~600 bp of sheared DNA was confirmed by gel electrophoresis. Approximately 20~30 μg of DNA was used for IP. Diluted protein-DNA complexes were precleared and incubated overnight with preblocked protein G Dynabeads and antibodies at 4 °C. Immunoprecipitates were washed serially with LiCl wash buffer (Tris 50 mM, pH 8.0, EDTA 1 mM, LiCl 250 mM, 1% NP-40, and 0.5% deoxycholate), IP buffer, and Tris-EDTA buffer. For DNA extraction, immunoprecipitates were reversely cross-linked by incubation at 65 °C overnight, and further incubated with RNase A and proteinase K. Then, ChIP DNAs were isolated using a PCR purification kit (Qiagen). Control or PAF KD cells (H1792 and KP) were used for ChIP. For PAF ChIP, A549 cells stably expressing FLAG-PAF were used. The following antibodies were used for ChIP: RBBP4 (GeneTex, 1:200), p130 (Cell Signaling, 1:100), LIN54 (Bethyl, 1:200), BMYB (Abcam, 1:100), FOXM1 (Santa Cruz, 1:200), and FLAG M2 (Thermo,1:200). Previously validated DREAM binding sequences of CCNB1, TOP2A, PLK1, and UBE2C promoters were analyzed by ChIP–qPCR (primer sequences are listed in Table S7). Beads only and ACTB promoter amplicons served as negative controls.
Histology and immunohistochemistry
KrasLSL-G12D/+ (K), Paf−/−; KrasLSL-G12D/+ (PK), KrasLSL-G12D/+; Trp53floxed/floxed (KP), and Paf−/−; KrasLSL-G12D/+; Trp53floxed/floxed (PKP) mice were euthanized at the times after Ad-Cre infection indicated in the figures. Lung tissues were perfused with PBS, fixed with 10% formalin, and embedded in paraffin. Lung tumors were first examined by macroscopic observation of the surface of the whole lung and then by microscopic analysis using sectioned samples stained with hematoxylin and eosin. The total number and burden of K and KP lung tumors were measured in the middle sections of each lung. To measure the total number and burden of PK and PKP lung tumors, the tumor-bearing sections of the lungs were screened, and one 5-μm section from the center of the tumor was used for analysis. For IHC analysis, paraffin-sectioned samples were immunostained according to standard protocols (Wang et al., 2016). The following antibodies were used for immunohistochemistry: PAF (Santa Cruz, G-11), Ki67 (Abcam, ab16667), PCNA (Cell Signaling, 13110), cleaved caspase-3 (Cell Signaling, 9664), and RAS (mutated G12D) (Abcam, ab221163).
Non-Invasive Analysis of Lung Tumors
Micro-computed tomography (Micro-CT, XRAD 225Cx) of tumor-bearing KP or PKP mice was performed at the Small Animal Imaging Facility (MD Anderson Cancer Center). 180~250 of sectioned lung images were obtained from each lung. 3D lung images were then reconstituted and analyzed by Image J.
QUANTIFICATION AND STATISTICAL DETAILS
Student t-tests or two-way ANOVA were applied for comparisons of two samples. All results are presented as the mean ± standard error of the mean (SEM) or ± standard deviation (SD), as noted in the figure legends. GraphPad Prism 8 was used for statistical analysis. At least three biological and experimental replicates were used unless otherwise described in figure legends. Statistical threshold was defined as a p value was less than 0.05. *P < 0.05; **P < 0.01; ***P < 0.001.
Supplementary Material
Figure S1. PAF Expression in Lung Cancer, Related to Figure 1.
Figure S2. Suppression of Lung Tumorigenesis by Paf KO, Related to Figure 2.
Figure S3. PAF Depletion Induced Cell Quiescence and Growth Arrest in Lung Cancer Cells, Related to Figure 3.
Figure S4. Correlated Expression of PAF and DREAM Complex Targets in Lung Adenocarcinoma, Related to Figure 4.
Figure S5. DREAM Complex Mediates PAF Depletion-Induced Cell Quiescence and Growth Arrest of Lung Cancer Cells, Related to Figure 5.
Figure S6. Analysis of the Interaction between PAF and RBBP4/DREAM Complex, Related to Figure 6.
Figure S7. Screening and Validation of Candidate Compounds Mimicking the PAF-Depleted Transcriptome, Related to Figure 7.
Table S1. PAF Expression in Human Lung Cancer, Related to Figure 1.
Table S2. GSEA Analysis Using Differentially Expressed Genes (KP and H1792, shCtrl vs. shPaf), Related to Figure 4.
Table S3. PAF-DREAM Targets and Their Correlation with Poor Clinical Outcomes in LUAD, Related to Figure 4.
Table S4. Co-expression of PAF and PAF-DREAM Targets, Related to Figure 4.
Table S5. PAF-Tandem Mass Spectrometry (TAP-MS/MS), Related to Figure 6.
Table S6. CMAP Analysis of PAF-Depleted Transcriptome, Related to Figure 7.
Table S7. Information on Primer Sequences and Human Research Participants, Related to Figures 4, 5, 6, 7.
KEY RESOURCES TABLE
| REAGENT or RESOURCE | SOURCE | IDENTIFIER |
|---|---|---|
| Antibodies | ||
| Mouse anti-PAF (KIAA0101) | Santa Cruz Biotechnology | Cat# sc-390515 |
| Mouse anti-PAF (KIAA0101) | Abcam | Cat# ab56773; RRID: AB_943922 |
| Mouse anti-PAF (KIAA0101) | Abcam | Cat# ab226255 |
| Rabbit anti-PCNA | Cell Signaling Technology | Cat# 13110 RRID: AB_2636979 |
| Rabbit anti-Ki67 | Abcam | Cat# ab16667 RRID: AB_302459 |
| Rabbit anti-Cleaved Caspase-3 | Cell Signaling Technology | Cat# 9664 RRID: AB_2070042 |
| Mouse anti-RBBP4 (13D10) | GeneTex | Cat# GTX70234 RRID: AB_372871 |
| Rabbit anti-RBBP4 | Bethyl | Cat# A301-206A RRID: AB_890631 |
| Mouse anti-LIN9 | Santa Cruz Biotechnology | Cat# sc-398234 |
| Mouse anti-p130 (RBL2) | Cell Signaling Technology | Cat# 13610S RRID: AB_2798274 |
| Rabbit anti-E2F4 | Bethyl | Cat# A302-134A RRID: AB_1720353 |
| Mouse anti-E2F4 | Santa Cruz Biotechnology | Cat# sc-398543 |
| Rabbit anti-LIN54 | Bethyl | Cat# A303-799A RRID: AB_11218173 |
| Rabbit anti-B MYB (phosphor T487) | Abcam | Cat# ab76009 RRID: AB_1309969 |
| Mouse anti-FOXM1 (G-5) | Santa Cruz Biotechnology | Cat# sc-376471 RRID: AB_11150135 |
| Rabbit anti-alpha-Tubulin | Cell Signaling Technology | Cat# 2144 RRID: AB_2210548 |
| Rabbit anti-RAS (mutated G12D) | Abcam | Cat# ab221163 |
| Mouse Anti-FLAG (M2) | Sigma-Aldrich | Cat# F3165 RRID: AB_259529 |
| Mouse anti-HA (3F10) | Roche | Cat# 11867423001 RRID: AB_390918 |
| Rabbit Anti-Mouse IgG (Light Chain Specific) (D3V2A) HRP Conjugate | Cell Signaling Technology | Cat# 58802 RRID: AB_2799549 |
| Chemicals, Peptides, and Recombinant Proteins | ||
| Harmine | Abcam | Cat# ab120225 |
| Pitavastatin | Selleckchem | Cat# S1759 |
| Cyclosporin A | Selleckchem | Cat# S2286 |
| Experimental Models: Cell Lines | ||
| H322 | ATCC | Cat# CRL-5806 |
| H358 | ATCC | Cat# CRL-5807 |
| A549 | ATCC | Cat# CCL-185 |
| H23 | ATCC | Cat# CRL-5800 |
| H1299 | ATCC | Cat# CRL-5803 |
| H1355 | ATCC | Cat# CRL5865 |
| H1792 | ATCC | Cat# CRL-5895 |
| H1975 | ATCC | Cat# CRL-5908 |
| H460 | ATCC | Cat# HTB-177 |
| NIH/3T3 | ATCC | Cat#CRL-1658 |
| Biological Samples | ||
| Human normal lung samples | Laboratory of Dr. Bingliang Fang (MDACC) | N/A |
| TC241(PDX) | Laboratory of Dr. Bingliang Fang (MDACC) | N/A |
| TC303 (PDX) | Laboratory of Dr. Bingliang Fang (MDACC) | N/A |
| TC314 (PDX) | Laboratory of Dr. Bingliang Fang (MDACC) | N/A |
| Experimental Models: Organisms/Strains | ||
| Mouse: B6.129S4-Krastm4Tyj/J | The Jackson Laboratory | JAX:008179 RRID: IMSR_JAX:008179 |
| Mouse: B6.129P2-Trp53tm1Brn/J | The Jackson Laboratory | JAX:008462 RRID: IMSR_JAX:008462 |
| Mouse: NOD.CB17-Prkdcscid/J | The Jackson Laboratory | JAX: 001303 RRID: IMSR_JAX:001303 |
| Mouse: J:NU | The Jackson Laboratory | JAX: 007850 RRID: IMSR_JAX:007850 |
| Recombinant DNA | ||
| Human shPAF #1 | Sigma | TRCN0000278496 |
| Human shPAF #2 | Sigma | TRCN0000278497 |
| shGFP | Sigma | SHC005 |
| Mouse shPAF #1 | Dharmacon | V2LMM_11233 |
| Mouse shPAF #2 | Dharmacon | V2LMM_16348 |
| Human shDYRK1A | Dharmacon | V2LHS_113582 |
| GIPZ shRNA Empty | Dharmacon | RHS4349 |
| pLenti-FLAG-PAF | This paper | N/A |
| pLenti-FLAG-PAF mutRBM | This paper | N/A |
| pLenti-FLAG-PAF mutPIP | This paper | N/A |
| pLenti-FLAG-PAF mutPIP, mutRBM | This paper | N/A |
| pLenti-FLAG-PAF K15R | This paper | N/A |
| pLenti-FLAG-PAF K24R | This paper | N/A |
| pLenti-FLAG-PAF K15R/K24R | This paper | N/A |
| pCDNA-FLAG-PAF | This paper | N/A |
| pCDNA-FLAG-RBBP4 | This paper | N/A |
| pCDNA-FLAG-RBBP4 Δ347-362 | This paper | N/A |
| pCDNA-FLAG-RBBP4 Δ348-352 | This paper | N/A |
| CSII-EF-DHB-mVenus | (Spencer et al., 2013) | N/A |
| pLentiCRISPRv2-hygro | Addgene | Cat# 98291 |
| Software and Algorithms | ||
| GSEA software | Broad Institute of MIT and Harvard University | http://software.broadinstitute.org/gsea/index.jsp |
| CONNECTIVITY MAP (CMap) | Broad Institute of MIT | https://clue.io/cmap |
| GraphPad Prism 7 | GraphPad | https://www.graphpad.com/scientific-software/prism/ |
| Image J | Image J | https://imagej.net/Fiji |
| FlowJo | FlowJo LLC | https://www.flowjo.com/solutions/flowjo/ |
| Critical Commercial Assays | ||
| TnT Quick Coupled Transcription/Translation System | Promega | Cat# L1170 |
| Deposited Data | ||
| RNA-Seq data set | This paper | GEO: GSE136571 and GSE147305 |
| Oligonucleotides | ||
| Primers for qPCR, ChIP assay, and genotyping | This paper (Table S7) | N/A |
HIGHLIGHTS.
Paf KO suppresses lung adenocarcinoma (LUAD) development
PAF depletion induces cell quiescence and growth arrest of LUAD cells
PAF drives the global expression of cell cycle genes by remodeling the DREAM complex
Pharmacological mimicking of PAF-depleted transcriptomes inhibits LUAD growth
ACKNOWLEDGMENTS
We are grateful to Kwon-Sik Park, Hee Kee Kim, Pierre D. McCrea, and Amy Ninetto for constructive comments on the manuscript. We thank Sabrina L. Spencer for providing the DHB-Venus reporter and Min Gyu Lee for providing the lung cancer cell lines. We also thank Esther M. Lien, Brittney Lozzi, and Tianyu Wang for technical support. This work was supported by grants from the Cancer Prevention and Research Institute of Texas (RP140563 and RP200315 to J.-I.P.), the National Institutes of Health (2R01 CA193297 to J.-I.P.), the Department of Defense Peer Reviewed Cancer Research Program (CA140572 to J.-I.P.), an Institutional Research Grant (MD Anderson Cancer Center to J.-I.P.), Specialized Program of Research Excellence (SPORE) grant in endometrial cancer (P50 CA83639 to J.-I.P.), and Radiation Oncology Research Initiatives. PDX generation and annotation were supported by The University of Texas MD Anderson Cancer Center’s Moon Shots Program, SPORE grant (CA070907), and The University of Texas PDX Development and Trial Center grant (U54CA224065). The core facilities used (DNA sequencing, Genetically Engineered Mouse Facility, and Small Animal Imaging Facility) are supported by Cancer Center Support Grant P30 CA016672 from the National Cancer Institute to MD Anderson Cancer Center.
Footnotes
DECLARATION OF INTERESTS
The authors declare no competing interests.
Publisher's Disclaimer: This is a PDF file of an unedited manuscript that has been accepted for publication. As a service to our customers we are providing this early version of the manuscript. The manuscript will undergo copyediting, typesetting, and review of the resulting proof before it is published in its final form. Please note that during the production process errors may be discovered which could affect the content, and all legal disclaimers that apply to the journal pertain.
REFERENCES
- Arinaga M, Noguchi T, Takeno S, Chujo M, Miura T, Kimura Y, and Uchida Y (2003). Clinical implication of cyclin B1 in non-small cell lung cancer. Oncol Rep 10, 1381–1386. [PubMed] [Google Scholar]
- Beshiri ML, Holmes KB, Richter WF, Hess S, Islam AB, Yan Q, Plante L, Litovchick L, Gevry N, Lopez-Bigas N, et al. (2012). Coordinated repression of cell cycle genes by KDM5A and E2F4 during differentiation. Proc Natl Acad Sci U S A 109, 18499–18504. [DOI] [PMC free article] [PubMed] [Google Scholar]
- Cancer Genome Atlas Research, N. (2011). Integrated genomic analyses of ovarian carcinoma. Nature 474, 609–615. [DOI] [PMC free article] [PubMed] [Google Scholar]
- Cancer Genome Atlas Research, N. (2014). Comprehensive molecular profiling of lung adenocarcinoma. Nature 511, 543–550. [DOI] [PMC free article] [PubMed] [Google Scholar]
- Cheng Y, Li K, Diao D, Zhu K, Shi L, Zhang H, Yuan D, Guo Q, Wu X, Liu D, et al. (2013). Expression of KIAA0101 protein is associated with poor survival of esophageal cancer patients and resistance to cisplatin treatment in vitro. Lab Invest 93, 1276–1287. [DOI] [PubMed] [Google Scholar]
- Cox AD, Fesik SW, Kimmelman AC, Luo J, and Der CJ (2014). Drugging the undruggable RAS: Mission possible? Nat Rev Drug Discov 13, 828–851. [DOI] [PMC free article] [PubMed] [Google Scholar]
- De Biasio A, de Opakua AI, Mortuza GB, Molina R, Cordeiro TN, Castillo F, Villate M, Merino N, Delgado S, Gil-Carton D, et al. (2015). Structure of p15(PAF)-PCNA complex and implications for clamp sliding during DNA replication and repair. Nat Commun 6, 6439. [DOI] [PubMed] [Google Scholar]
- Director's Challenge Consortium for the Molecular Classification of Lung, A., Shedden K, Taylor JM, Enkemann SA, Tsao MS, Yeatman TJ, Gerald WL, Eschrich S, Jurisica I, Giordano TJ, et al. (2008). Gene expression-based survival prediction in lung adenocarcinoma: a multi-site, blinded validation study. Nat Med 14, 822–827. [DOI] [PMC free article] [PubMed] [Google Scholar]
- Duggan ST (2012). Pitavastatin: a review of its use in the management of hypercholesterolaemia or mixed dyslipidaemia. Drugs 72, 565–584. [DOI] [PubMed] [Google Scholar]
- Dunn CJ, Wagstaff AJ, Perry CM, Plosker GL, and Goa KL (2001). Cyclosporin: an updated review of the pharmacokinetic properties, clinical efficacy and tolerability of a microemulsion-based formulation (neoral)1 in organ transplantation. Drugs 61, 1957–2016. [DOI] [PubMed] [Google Scholar]
- DuPage M, Dooley AL, and Jacks T (2009). Conditional mouse lung cancer models using adenoviral or lentiviral delivery of Cre recombinase. Nat Protoc 4, 1064–1072. [DOI] [PMC free article] [PubMed] [Google Scholar]
- Emanuele MJ, Ciccia A, Elia AE, and Elledge SJ (2011). Proliferating cell nuclear antigen (PCNA)-associated KIAA0101/PAF15 protein is a cell cycle-regulated anaphase-promoting complex/cyclosome substrate. Proc Natl Acad Sci U S A 108, 9845–9850. [DOI] [PMC free article] [PubMed] [Google Scholar]
- Fields AP, and Justilien V (2010). The guanine nucleotide exchange factor (GEF) Ect2 is an oncogene in human cancer. Adv Enzyme Regul 50, 190–200. [DOI] [PMC free article] [PubMed] [Google Scholar]
- Fischer M, Grossmann P, Padi M, and DeCaprio JA (2016). Integration of TP53, DREAM, MMB-FOXM1 and RB-E2F target gene analyses identifies cell cycle gene regulatory networks. Nucleic Acids Res 44, 6070–6086. [DOI] [PMC free article] [PubMed] [Google Scholar]
- Hanahan D, and Weinberg RA (2011). Hallmarks of cancer: the next generation. Cell 144, 646–674. [DOI] [PubMed] [Google Scholar]
- Harrison MM, Ceol CJ, Lu X, and Horvitz HR (2006). Some C. elegans class B synthetic multivulva proteins encode a conserved LIN-35 Rb-containing complex distinct from a NuRD-like complex. Proc Natl Acad Sci U S A 103, 16782–16787. [DOI] [PMC free article] [PubMed] [Google Scholar]
- Ho VM, Schaffer BE, Karnezis AN, Park KS, and Sage J (2009). The retinoblastoma gene Rb and its family member p130 suppress lung adenocarcinoma induced by oncogenic K-Ras. Oncogene 28, 1393–1399. [DOI] [PMC free article] [PubMed] [Google Scholar]
- Hosokawa M, Takehara A, Matsuda K, Eguchi H, Ohigashi H, Ishikawa O, Shinomura Y, Imai K, Nakamura Y, and Nakagawa H (2007). Oncogenic role of KIAA0101 interacting with proliferating cell nuclear antigen in pancreatic cancer. Cancer Res 67, 2568–2576. [DOI] [PubMed] [Google Scholar]
- Iness AN, and Litovchick L (2018). MuvB: A Key to Cell Cycle Control in Ovarian Cancer. Front Oncol 8, 223. [DOI] [PMC free article] [PubMed] [Google Scholar]
- Jain M, Zhang L, Patterson EE, and Kebebew E (2011). KIAA0101 is overexpressed, and promotes growth and invasion in adrenal cancer. PLoS One 6, e26866. [DOI] [PMC free article] [PubMed] [Google Scholar]
- Jun S, Lee S, Kim HC, Ng C, Schneider AM, Ji H, Ying H, Wang H, DePinho RA, and Park JI (2013). PAF-mediated MAPK signaling hyperactivation via LAMTOR3 induces pancreatic tumorigenesis. Cell Rep 5, 314–322. [DOI] [PMC free article] [PubMed] [Google Scholar]
- Jung HY, Jun S, Lee M, Kim HC, Wang X, Ji H, McCrea PD, and Park JI (2013). PAF and EZH2 induce Wnt/beta-catenin signaling hyperactivation. Mol Cell 52, 193–205. [DOI] [PMC free article] [PubMed] [Google Scholar]
- Jung YS, Jun S, Kim MJ, Lee SH, Suh HN, Lien EM, Jung HY, Lee S, Zhang J, Yang JI, et al. (2018). TMEM9 promotes intestinal tumorigenesis through vacuolar-ATPase-activated Wnt/beta-catenin signalling. Nat Cell Biol 20, 1421–1433. [DOI] [PMC free article] [PubMed] [Google Scholar]
- Justilien V, Ali SA, Jamieson L, Yin N, Cox AD, Der CJ, Murray NR, and Fields AP (2017). Ect2-Dependent rRNA Synthesis Is Required for KRAS-TRP53-Driven Lung Adenocarcinoma. Cancer Cell 31, 256–269. [DOI] [PMC free article] [PubMed] [Google Scholar]
- Kim IM, Ackerson T, Ramakrishna S, Tretiakova M, Wang IC, Kalin TV, Major ML, Gusarova GA, Yoder HM, Costa RH, et al. (2006). The Forkhead Box m1 transcription factor stimulates the proliferation of tumor cells during development of lung cancer. Cancer Res 66, 2153–2161. [DOI] [PubMed] [Google Scholar]
- Kim MJ, Xia B, Suh HN, Lee SH, Jun S, Lien EM, Zhang J, Chen K, and Park JI (2018). PAF-Myc-Controlled Cell Stemness Is Required for Intestinal Regeneration and Tumorigenesis. Dev Cell 44, 582–596 e584. [DOI] [PMC free article] [PubMed] [Google Scholar]
- Korenjak M, Taylor-Harding B, Binne UK, Satterlee JS, Stevaux O, Aasland R, White-Cooper H, Dyson N, and Brehm A (2004). Native E2F/RBF complexes contain Myb-interacting proteins and repress transcription of developmentally controlled E2F target genes. Cell 119, 181–193. [DOI] [PubMed] [Google Scholar]
- Krupczak-Hollis K, Wang X, Kalinichenko VV, Gusarova GA, Wang IC, Dennewitz MB, Yoder HM, Kiyokawa H, Kaestner KH, and Costa RH (2004). The mouse Forkhead Box m1 transcription factor is essential for hepatoblast mitosis and development of intrahepatic bile ducts and vessels during liver morphogenesis. Dev Biol 276, 74–88. [DOI] [PubMed] [Google Scholar]
- Lewis PW, Beall EL, Fleischer TC, Georlette D, Link AJ, and Botchan MR (2004). Identification of a Drosophila Myb-E2F2/RBF transcriptional repressor complex. Genes Dev 18, 2929–2940. [DOI] [PMC free article] [PubMed] [Google Scholar]
- Litovchick L, Florens LA, Swanson SK, Washburn MP, and DeCaprio JA (2011). DYRK1A protein kinase promotes quiescence and senescence through DREAM complex assembly. Genes Dev 25, 801–813. [DOI] [PMC free article] [PubMed] [Google Scholar]
- Litovchick L, Sadasivam S, Florens L, Zhu X, Swanson SK, Velmurugan S, Chen R, Washburn MP, Liu XS, and DeCaprio JA (2007). Evolutionarily conserved multisubunit RBL2/p130 and E2F4 protein complex represses human cell cycle-dependent genes in quiescence. Mol Cell 26, 539–551. [DOI] [PubMed] [Google Scholar]
- Liu L, Chen X, Xie S, Zhang C, Qiu Z, and Zhu F (2012). Variant 1 of KIAA0101, overexpressed in hepatocellular carcinoma, prevents doxorubicin-induced apoptosis by inhibiting p53 activation. Hepatology 56, 1760–1769. [DOI] [PubMed] [Google Scholar]
- Luo J, Emanuele MJ, Li D, Creighton CJ, Schlabach MR, Westbrook TF, Wong KK, and Elledge SJ (2009). A genome-wide RNAi screen identifies multiple synthetic lethal interactions with the Ras oncogene. Cell 137, 835–848. [DOI] [PMC free article] [PubMed] [Google Scholar]
- MacDonald J, Ramos-Valdes Y, Perampalam P, Litovchick L, DiMattia GE, and Dick FA (2017). A Systematic Analysis of Negative Growth Control Implicates the DREAM Complex in Cancer Cell Dormancy. Mol Cancer Res 15, 371–381. [DOI] [PubMed] [Google Scholar]
- Malumbres M, and Barbacid M (2001). To cycle or not to cycle: a critical decision in cancer. Nat Rev Cancer 1, 222–231. [DOI] [PubMed] [Google Scholar]
- Mancini M, and Toker A (2009). NFAT proteins: emerging roles in cancer progression. Nat Rev Cancer 9, 810–820. [DOI] [PMC free article] [PubMed] [Google Scholar]
- Mizutani K, Onda M, Asaka S, Akaishi J, Miyamoto S, Yoshida A, Nagahama M, Ito K, and Emi M (2005). Overexpressed in anaplastic thyroid carcinoma-1 (OEATC-1) as a novel gene responsible for anaplastic thyroid carcinoma. Cancer 103, 1785–1790. [DOI] [PubMed] [Google Scholar]
- Moldovan GL, Pfander B, and Jentsch S (2007). PCNA, the maestro of the replication fork. Cell 129, 665–679. [DOI] [PubMed] [Google Scholar]
- Muller PA, and Vousden KH (2014). Mutant p53 in cancer: new functions and therapeutic opportunities. Cancer Cell 25, 304–317. [DOI] [PMC free article] [PubMed] [Google Scholar]
- Nor Rashid N, Yusof R, and Watson RJ (2011). Disruption of repressive p130-DREAM complexes by human papillomavirus 16 E6/E7 oncoproteins is required for cell-cycle progression in cervical cancer cells. J Gen Virol 92, 2620–2627. [DOI] [PubMed] [Google Scholar]
- Ong DST, Hu B, Ho YW, Sauve CG, Bristow CA, Wang Q, Multani AS, Chen P, Nezi L, Jiang S, et al. (2017). PAF promotes stemness and radioresistance of glioma stem cells. Proc Natl Acad Sci U S A 114, E9086–E9095. [DOI] [PMC free article] [PubMed] [Google Scholar]
- Perou CM, Sorlie T, Eisen MB, van de Rijn M, Jeffrey SS, Rees CA, Pollack JR, Ross DT, Johnsen H, Akslen LA, et al. (2000). Molecular portraits of human breast tumours. Nature 406, 747–752. [DOI] [PubMed] [Google Scholar]
- Povlsen LK, Beli P, Wagner SA, Poulsen SL, Sylvestersen KB, Poulsen JW, Nielsen ML, Bekker-Jensen S, Mailand N, and Choudhary C (2012). Systems-wide analysis of ubiquitylation dynamics reveals a key role for PAF15 ubiquitylation in DNA-damage bypass. Nat Cell Biol 14, 1089–1098. [DOI] [PubMed] [Google Scholar]
- Reichert N, Wurster S, Ulrich T, Schmitt K, Hauser S, Probst L, Gotz R, Ceteci F, Moll R, Rapp U, et al. (2010). Lin9, a subunit of the mammalian DREAM complex, is essential for embryonic development, for survival of adult mice, and for tumor suppression. Mol Cell Biol 30, 2896–2908. [DOI] [PMC free article] [PubMed] [Google Scholar]
- Sadasivam S, and DeCaprio JA (2013). The DREAM complex: master coordinator of cell cycle-dependent gene expression. Nat Rev Cancer 13, 585–595. [DOI] [PMC free article] [PubMed] [Google Scholar]
- Sadasivam S, Duan S, and DeCaprio JA (2012). The MuvB complex sequentially recruits B-Myb and FoxM1 to promote mitotic gene expression. Genes Dev 26, 474–489. [DOI] [PMC free article] [PubMed] [Google Scholar]
- Schmid I, Cole SW, Korin YD, Zack JA, and Giorgi JV (2000). Detection of cell cycle subcompartments by flow cytometric estimation of DNA-RNA content in combination with dual-color immunofluorescence. Cytometry 39, 108–116. [DOI] [PubMed] [Google Scholar]
- Soria JC, Jang SJ, Khuri FR, Hassan K, Liu D, Hong WK, and Mao L (2000). Overexpression of cyclin B1 in early-stage non-small cell lung cancer and its clinical implication. Cancer Res 60, 4000–4004. [PubMed] [Google Scholar]
- Spencer SL, Cappell SD, Tsai FC, Overton KW, Wang CL, and Meyer T (2013). The proliferation-quiescence decision is controlled by a bifurcation in CDK2 activity at mitotic exit. Cell 155, 369–383. [DOI] [PMC free article] [PubMed] [Google Scholar]
- Subramanian A, Narayan R, Corsello SM, Peck DD, Natoli TE, Lu X, Gould J, Davis JF, Tubelli AA, Asiedu JK, et al. (2017). A Next Generation Connectivity Map: L1000 Platform and the First 1,000,000 Profiles. Cell 171, 1437–1452 e1417. [DOI] [PMC free article] [PubMed] [Google Scholar]
- Tanaka Y, Patestos NP, Maekawa T, and Ishii S (1999). B-myb is required for inner cell mass formation at an early stage of development. J Biol Chem 274, 28067–28070. [DOI] [PubMed] [Google Scholar]
- Travis WD, Brambilla E, Nicholson AG, Yatabe Y, Austin JHM, Beasley MB, Chirieac LR, Dacic S, Duhig E, Flieder DB, et al. (2015). The 2015 World Health Organization Classification of Lung Tumors: Impact of Genetic, Clinical and Radiologic Advances Since the 2004 Classification. J Thorac Oncol 10, 1243–1260. [DOI] [PubMed] [Google Scholar]
- Wang IC, Ustiyan V, Zhang Y, Cai Y, Kalin TV, and Kalinichenko VV (2014). Foxm1 transcription factor is required for the initiation of lung tumorigenesis by oncogenic Kras(G12D.). Oncogene 33, 5391–5396. [DOI] [PubMed] [Google Scholar]
- Wang X, Jung YS, Jun S, Lee S, Wang W, Schneider A, Sun Oh Y, Lin SH, Park BJ, Chen J, et al. (2016). PAF-Wnt signaling-induced cell plasticity is required for maintenance of breast cancer cell stemness. Nat Commun 7, 10633. [DOI] [PMC free article] [PubMed] [Google Scholar]
- Whitfield ML, Sherlock G, Saldanha AJ, Murray JI, Ball CA, Alexander KE, Matese JC, Perou CM, Hurt MM, Brown PO, et al. (2002). Identification of genes periodically expressed in the human cell cycle and their expression in tumors. Mol Biol Cell 13, 1977–2000. [DOI] [PMC free article] [PubMed] [Google Scholar]
- Wong N, Yeo W, Wong WL, Wong NL, Chan KY, Mo FK, Koh J, Chan SL, Chan AT, Lai PB, et al. (2009). TOP2A overexpression in hepatocellular carcinoma correlates with early age onset, shorter patients survival and chemoresistance. Int J Cancer 124, 644–652. [DOI] [PubMed] [Google Scholar]
- Yu P, Huang B, Shen M, Lau C, Chan E, Michel J, Xiong Y, Payan DG, and Luo Y (2001). p15(PAF), a novel PCNA associated factor with increased expression in tumor tissues. Oncogene 20, 484–489. [DOI] [PubMed] [Google Scholar]
- Yuan RH, Jeng YM, Pan HW, Hu FC, Lai PL, Lee PH, and Hsu HC (2007). Overexpression of KIAA0101 predicts high stage, early tumor recurrence, and poor prognosis of hepatocellular carcinoma. Clin Cancer Res 13, 5368–5376. [DOI] [PubMed] [Google Scholar]
- Zhang W, Tyl M, Ward R, Sobott F, Maman J, Murthy AS, Watson AA, Fedorov O, Bowman A, Owen-Hughes T, et al. (2013). Structural plasticity of histones H3-H4 facilitates their allosteric exchange between RbAp48 and ASF1. Nat Struct Mol Biol 20, 29–35. [DOI] [PMC free article] [PubMed] [Google Scholar]
Associated Data
This section collects any data citations, data availability statements, or supplementary materials included in this article.
Supplementary Materials
Figure S1. PAF Expression in Lung Cancer, Related to Figure 1.
Figure S2. Suppression of Lung Tumorigenesis by Paf KO, Related to Figure 2.
Figure S3. PAF Depletion Induced Cell Quiescence and Growth Arrest in Lung Cancer Cells, Related to Figure 3.
Figure S4. Correlated Expression of PAF and DREAM Complex Targets in Lung Adenocarcinoma, Related to Figure 4.
Figure S5. DREAM Complex Mediates PAF Depletion-Induced Cell Quiescence and Growth Arrest of Lung Cancer Cells, Related to Figure 5.
Figure S6. Analysis of the Interaction between PAF and RBBP4/DREAM Complex, Related to Figure 6.
Figure S7. Screening and Validation of Candidate Compounds Mimicking the PAF-Depleted Transcriptome, Related to Figure 7.
Table S1. PAF Expression in Human Lung Cancer, Related to Figure 1.
Table S2. GSEA Analysis Using Differentially Expressed Genes (KP and H1792, shCtrl vs. shPaf), Related to Figure 4.
Table S3. PAF-DREAM Targets and Their Correlation with Poor Clinical Outcomes in LUAD, Related to Figure 4.
Table S4. Co-expression of PAF and PAF-DREAM Targets, Related to Figure 4.
Table S5. PAF-Tandem Mass Spectrometry (TAP-MS/MS), Related to Figure 6.
Table S6. CMAP Analysis of PAF-Depleted Transcriptome, Related to Figure 7.
Table S7. Information on Primer Sequences and Human Research Participants, Related to Figures 4, 5, 6, 7.
Data Availability Statement
Raw data are available from Mendeley Data under: doi:10.17632/vdz3856jdy.1. The accession numbers for RNA-Seq data reported in this paper are GSE136571 and GSE147305.