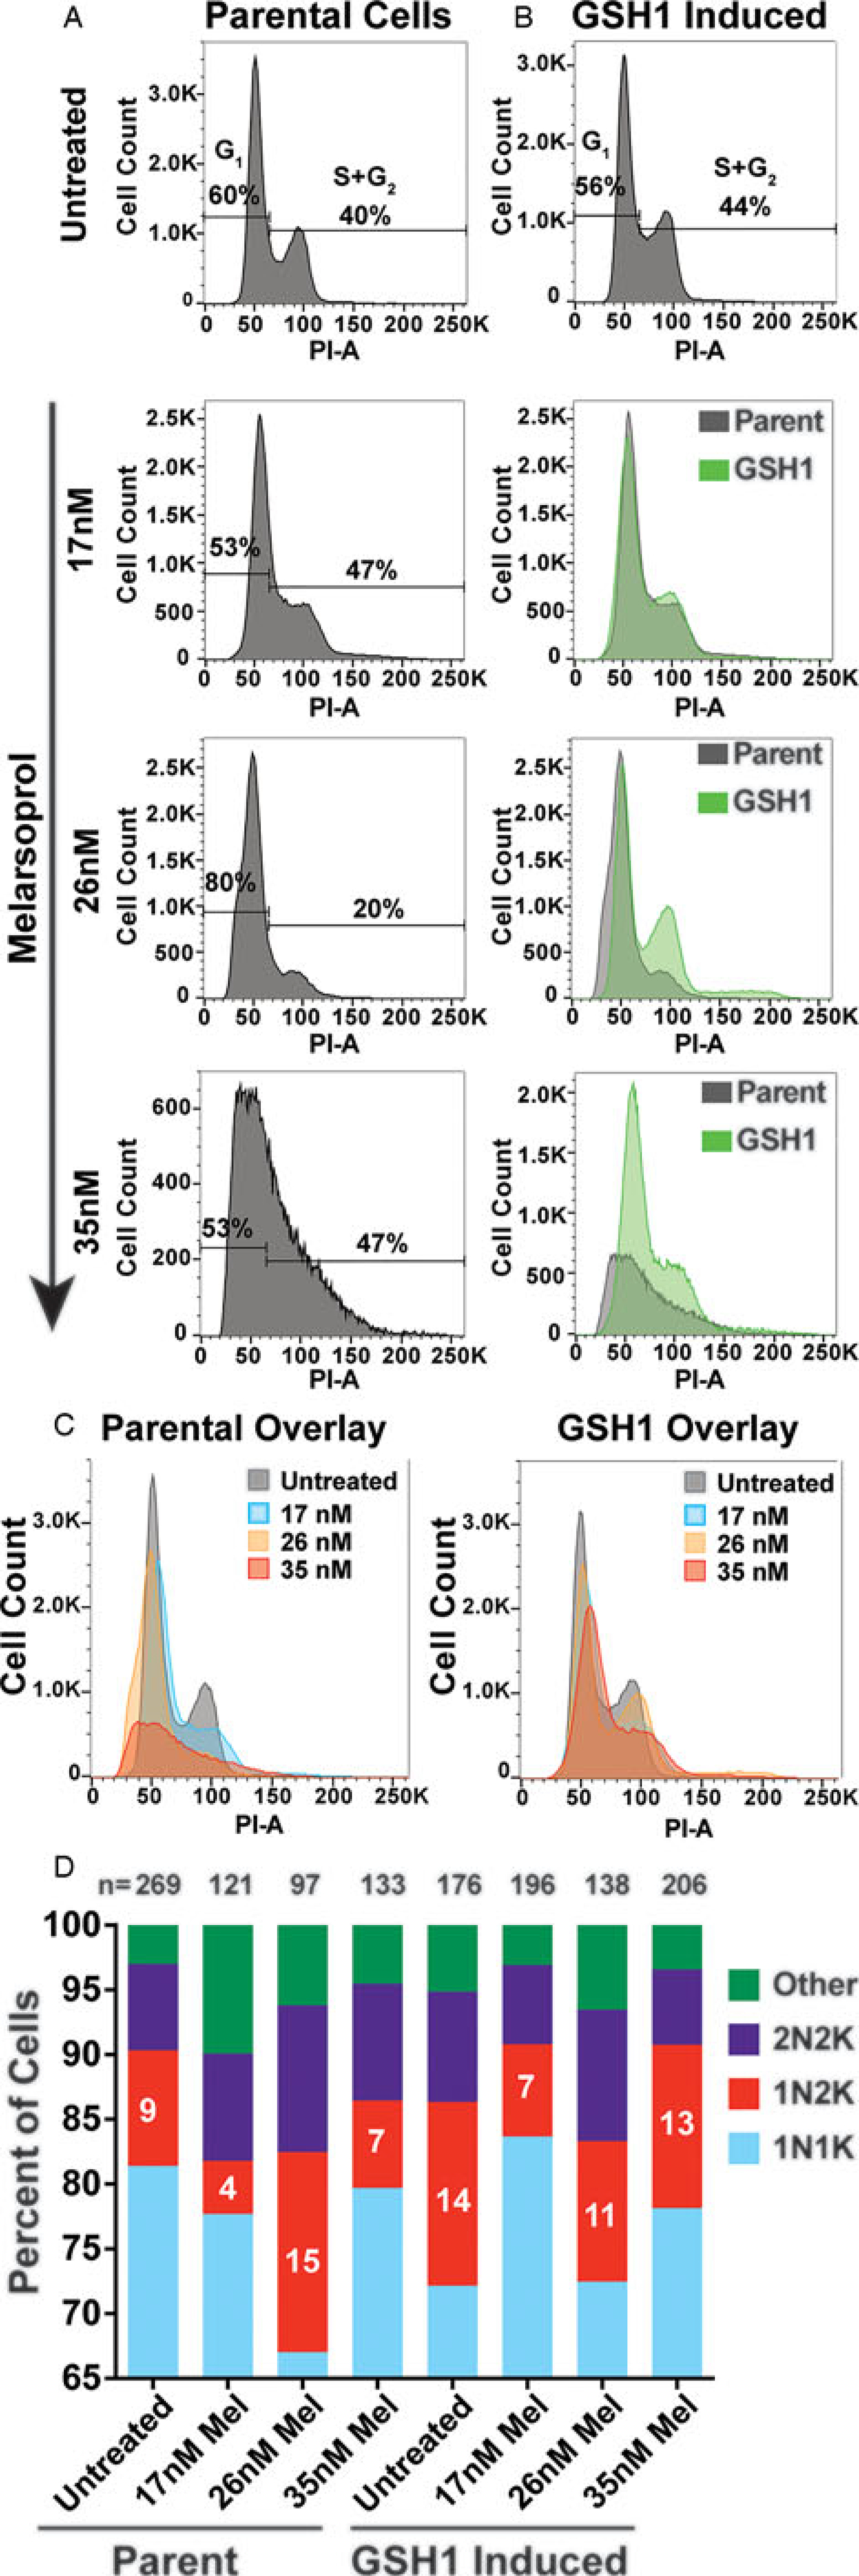
Fig. 2.

Cell cycle defects arising from melarsoprol treatment. (A) Cell cycle analysis of parental cell line (SM) untreated or treated with melarsoprol at 17, 26 and 35 nm for 24 h. (B) Cell cycle analysis of cell line overexpressing GSH1 untreated or treated with melarsoprol at 17, 26 and 35 nm for 24 h shown as an overlay (green) with parental cells under the same treatment conditions. (C) Left - overlay of parental cells under all melarsoprol treatment conditions in comparison with untreated. Right - overlay of GSH1-induced cells under all melarsoprol treatment conditions in comparison with untreated. Flow cytometry data are presented as a single replicate representative of at least three biological replicates. (D) Counts of nuclei and kinetoplasts per cell following immunofluorescent microscopy analysis using DAPI staining after 24h of melarsoprol treatment at the indicated concentrations. n = the number of cells counted per condition. Per cent of cells counted as 1N2K are shown as white text in the red portion of the bar graph. Microscopy slides were made from a single biological replicate experiment and the number of cells counted (n =) are shown at the top of each bar.
