Abstract
Objective:
Articular cartilage is an avascular tissue. Accordingly, diffusivity represents a fundamental transport mechanism for nutrients and other molecular signals regulating its cell metabolism and maintenance of the extracellular matrix. Understanding how solutes spread into articular cartilage is crucial to elucidating its pathologies, and to designing treatments for repair and restoration of its extracellular matrix. As in other connective tissues, diffusivity in articular cartilage may vary depending both its composition and the specific diffusing solute. Hence, this study investigated the roles of solute size and tissue composition on molecular diffusion in knee articular cartilage.
Design:
FRAP tests were conducted to measure diffusivity of five molecular probes, with size ranging from ~332Da to 70,000Da, in human knee articular cartilage. The measured diffusion coefficients were related to molecular size, as well as water and glycosaminoglycan (GAG) content of femoral and tibial condyle cartilage.
Results:
Diffusivity was affected by molecular size, with the magnitude of the diffusion coefficients decreasing as the Stokes radius of the probe increased. The values of diffusion coefficients in tibial and femoral samples were not significantly different from one another, despite the fact that tibial samples exhibited significantly higher water content and lower GAG content of the femoral specimens. Water content did not affect diffusivity. In contrast, diffusivities of large molecules were sensitive to GAG content.
Conclusions:
This study provides new knowledge on the mechanisms of diffusion in articular cartilage. Our findings can be leveraged to further investigate osteoarthritis and to design treatments for cartilage restoration or replacement.
Keywords: Fluorescence recovery after photobleaching (FRAP), Glycosaminoglycan (GAG), Water content, Stokes radius
INTRODUCTION
Osteoarthritis (OA) is the most prevalent joint disorder in the United States, affecting 1 in 2 adults and costing upwards of $100 billion annually in the US alone [1]. Moreover, the majority of OA cases occur in the articular cartilage in the knee, making it the most susceptible joint. Available treatments of OA are limited, and generally include symptoms management and joint arthroplasty in the late stages [2]. Recently, intra-articular delivery of agents, such as drugs or cytokines, has been heralded as a promising new strategy for the treatment of knee OA [3, 4]. In order to design novel strategies for the efficient transport and delivery of drugs into the tissue, understanding the mechanism of molecular transport in cartilage is necessary.
Transport mechanisms in articular cartilage are affected by the tissue structure and composition [5]. Cartilage is a highly hydrated tissue, with water making up approximately 70% of the wet weight of the tissue. The extracellular matrix (ECM) is primarily composed of collagen type II and aggrecans [6, 7]. The ECM of articular cartilage is negatively charged due to the presence of aggrecans, which contain negatively charged glycosaminoglycan (GAG) side chains. This negative fixed charge density contributes to the swelling property of the tissue, which is key to its mechanical functioning in the joint. Overall, the densely packed arrangement of the ECM significantly hinders solute transport in the tissue, especially for larger and branched molecules [8–10]. The average pore size of the tissue is approximately 6 nm, which is similar in size to some of the proposed therapeutic agents [5]. However, additional molecule properties, such as shape and charge, also play critical roles in their delivery and transport in cartilage.
Articular cartilage is also an avascular tissue, which means that essential molecules, including nutrients, metabolic wastes, and other molecules such as cytokines, growth factors, and enzymes, must be transported through the ECM from the surrounding vasculature. This transport may occur by diffusion or by convection (i.e., fluid flow due to tissue compression). In general, the transport of small solutes, such as nutrients, is primarily via diffusion, whereas that of larger molecules may be augmented by fluid flow [11–18]. In order to more fully understand the nutritional supply and pathophysiology of articular cartilage, knowledge of transport mechanisms through the tissue is essential. The diffusion of a wide range of molecules has been measured in articular cartilage from human and animal sources, see reviews [5, 19, 20]. These studies have shown that solute size and mass strongly influence molecular transport in articular cartilage, with an inverse relationship between solute size and diffusion coefficient which holds for a wide range of molecular sizes.
In order to better understand tissue pathophysiology, an expanded knowledge of transport mechanisms in cartilage is crucial. To successfully translate the potential of intra-articular drug delivery for the clinical treatment of OA, the rate and efficiency of delivery of different molecules must be known. Similarly, such information is needed for developing novel tissue engineered replacement tissues, which will need to interface with native tissue and allow for efficient transport of molecules. Quantitative data and structure-function relations for molecular transport in cartilage can also be employed in computational modeling of cartilage, which can be utilized for designing new therapies. Thus, the results of this study have the potential to contribute to the development of novel strategies to treat and/or repair articular cartilage in a variety of areas. Earlier studies have investigated the diffusivity of a range of solutes in knee cartilage, the majority of which was measured in animal tissues [20]. Here, we investigate solute diffusion in human articular cartilage, which will allow for a more direct clinical translation of these results to develop new regenerative approaches to treating OA.
In this study, we investigated the diffusivity of a range of solutes in articular cartilage harvested from the femoral condyles and the tibial plateaus of human knees. Solutes ranged in size from 332 Da to 70,000 Da, which captures sizes ranging from nutrients, growth factors, and potential drugs for the treatment of OA. Using our custom fluorescence recovery after photobleaching (FRAP) technique[21–23], we measured the diffusion coefficient of 6 differently sized molecules using a consistent experimental design, which allows for direct comparison within our results for different solutes in human cartilage. In order to understand the influence of the tissue ECM composition on solute transport, we sought to correlate the diffusion coefficient with the tissue water and GAG contents, two critical compositional features of cartilage. This study provides a comprehensive picture of solute diffusion in human articular cartilage, which will contribute to new knowledge on transport behavior in the tissue that can be translated to new therapeutic strategies to treat OA.
MATERIALS AND METHODS
Molecular probes:
A broad range of sizes of the molecular probes was selected to provide an inclusive picture on diffusivity of solutes as small as nutrients (~200Da) to those as large as growth factors, enzymes, cytokines and potential drugs for treatment of osteoarthritis (from few hundreds of Da to hundreds of thousands of Da). Accordingly, the following probes were selected: fluorescein, insulin, bovine serum albumin (BSA), and two dextrans (D3K and D70K), see Table 1 for details.
Table 1.
Summary of molecular probes used in this study.
| Molecule | Source | Abbreviation | MW [Da] | rs (Å) | Concentration in PBS [M] |
|---|---|---|---|---|---|
| Fluorescein | Sigma-Aldrich | Fluorescein | 332 | 5.02a | 10−4 |
| Insulin-FITC labeled human | Sigma-Aldrich | Insulin | 5,807 | 10.5b | 4.3 × 10⁻⁵ |
| Albumin from Bovine Serum (BSA), Alexa Fluor™ 488 conjugate | Molecular Probes | BSA | 66,000 | 34.8c | 3.8 × 10⁻⁶ |
| Dextran, Fluorescein, 3000 MW | Molecular Probes | D3K | 3,000 | 14d | 1.7 × 10⁻⁴ |
| Dextran, Fluorescein, 70000 MW | Molecular Probes | D70K | 70,000 | 60d | 1.8 × 10⁻⁵ |
Specimen preparation:
Tissue samples were harvested after autopsy from eight femurs and eight tibias of age ranging from 60 to 72 y.o. Before tissue harvesting, knees were visually inspected to determine the degradation grade of the articular cartilage, which was deemed to be 0 or 1 according to Outerbridge classification [24]. Subsequently, using a Small Joint OATS system (Arthrex, Inc. Naples, FL) cylindrical cartilaginous plugs of 5mm diameter were obtained from femoral and tibial medial condyles. Each plug was placed in a compresstome (VF-210–0Z, Precisionary Instruments, Inc., Natick, MA) to obtain a cylindrical sample of 0.5mm height from the upper radial zone of the cartilage [25]. Similar to our previous studies [22, 26], specimens were confined within two porous plates and a perforated impermeable spacer, and equilibrated overnight in a PBS solution (Sigma-Aldrich Co., St. Louis, MO) containing the molecular probe of interest. Molar concentrations for each solute investigated are reported in Table 1. For each molecule investigated, 8 tibial samples and 8 femoral samples were tested (one sample from each tibia and one from each femur), and a minimum of 3 FRAP tests were performed and averaged on each sample. For each condyle investigated, additional tissue samples, for measurements of water and GAG content, were obtained from the cartilage region adjacent to that where specimens for diffusivity measurements were harvested. A schematic of specimen harvesting and preparation is reported in Figure 1.
Figure 1:
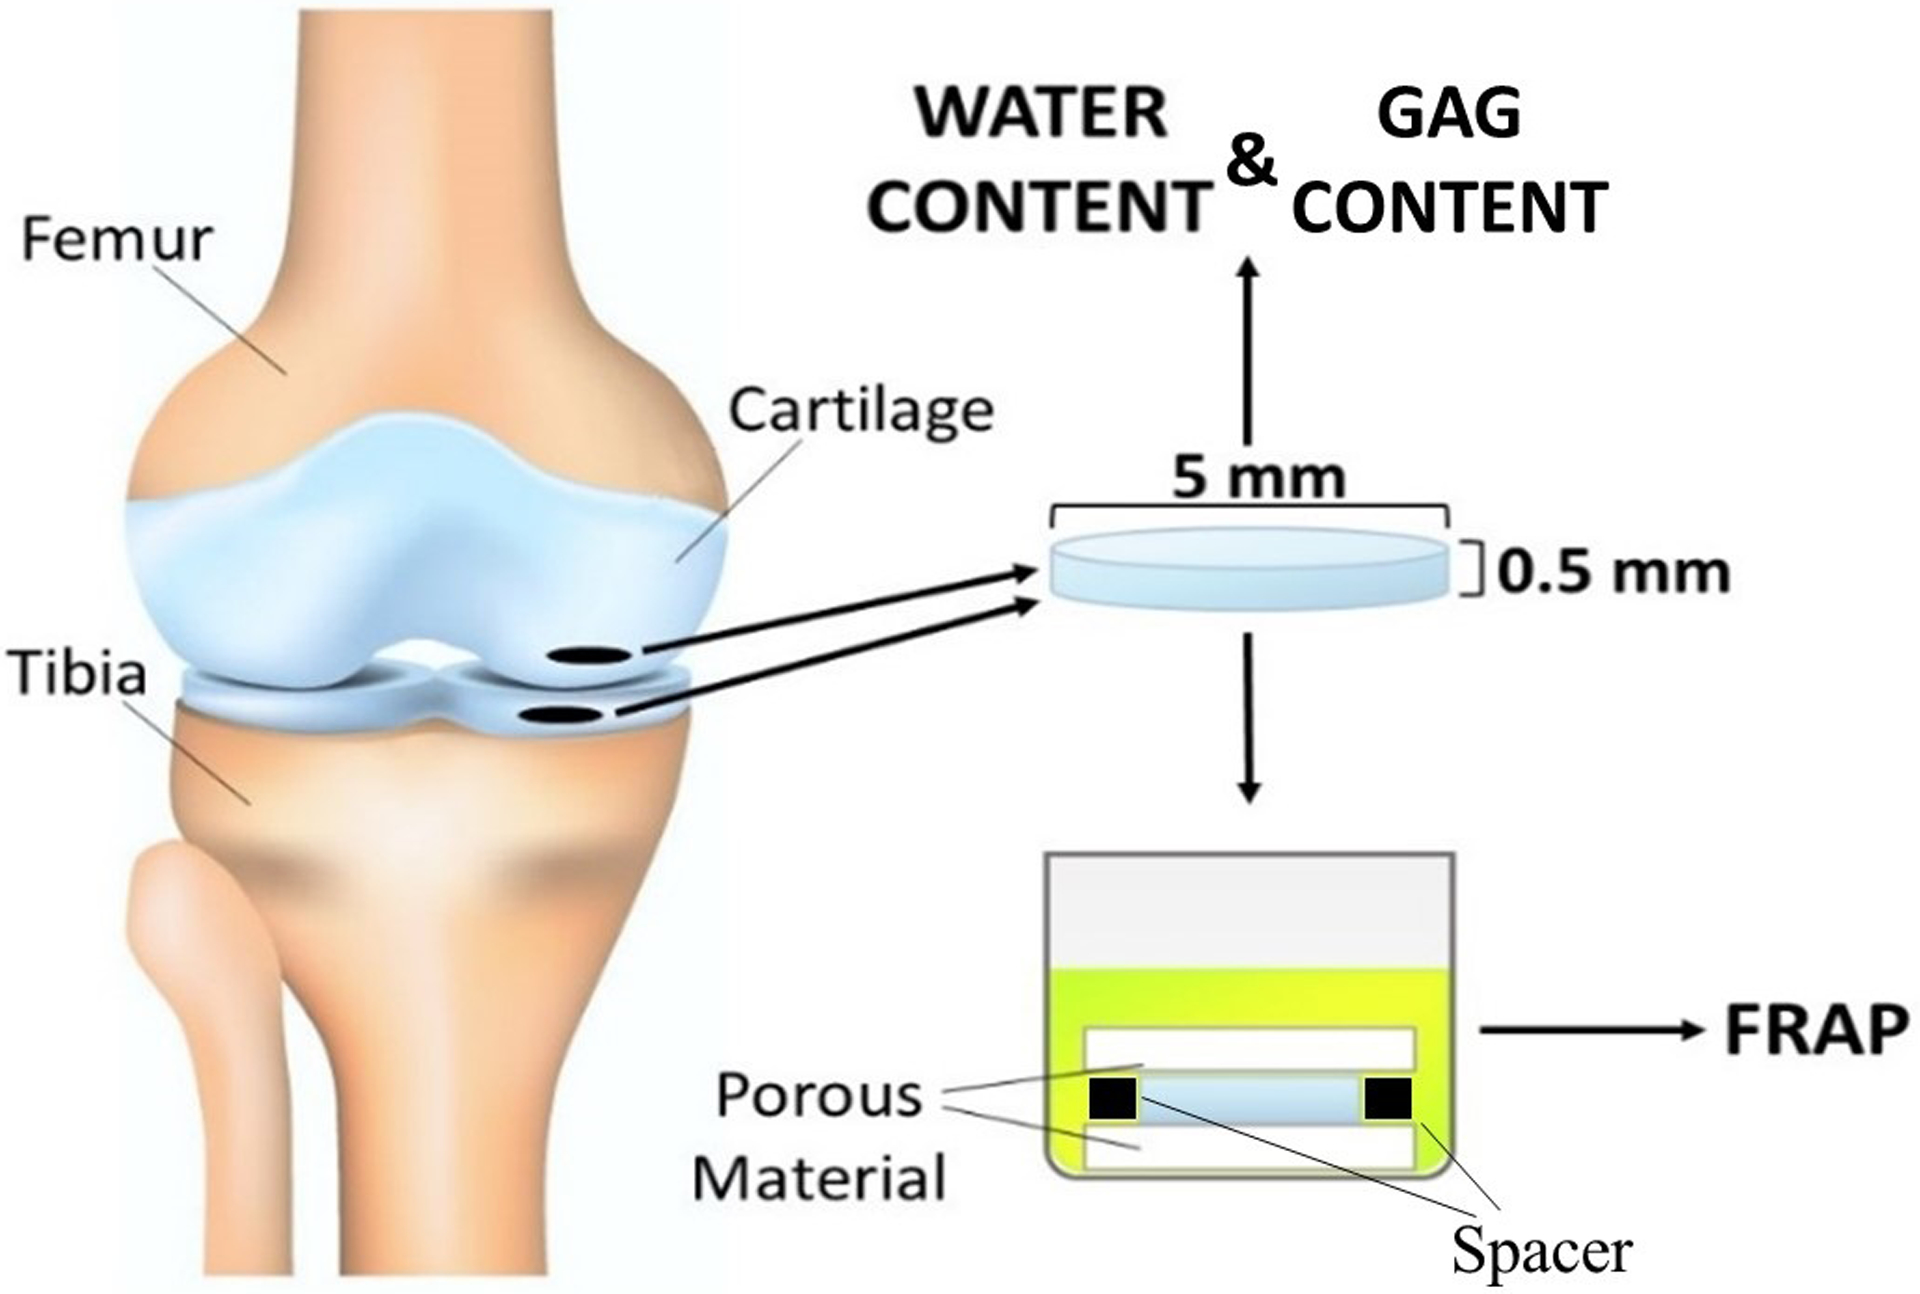
Schematic of specimen preparation. Location and size of the specimens is shown. For FRAP tests, cylindrical specimens with a height of 0.5 mm and a diameter of 5 mm were prepared from the central region of the meniscus along the axial direction. Additional specimens were harvested for measurement of water and GAG content in the tissue.
Measurement of diffusivity:
A custom FRAP technique was used to yield solutes diffusion coefficients (D) in the tissues [22]. Briefly, it was assumed that diffusive fluorescence recovery was a two-dimensional (2D) phenomenon occurring in the focal plane (x,y) of the microscope objective, following Fick’s second law. It was also assumed that the concentration of fluorescent probe was proportional to the intensity of its fluorescent emission. Hence, the mass balances over the diffusing fluorescent probe reads:
| (1) |
where c denotes the molar concentration of the probe and D is the diffusion coefficient. Equation (1) can be transformed and solved in the 2D Fourier space defined by the dimensionless frequencies (u,v) [27]:
| (2) |
where C(u,v,t) is the 2D Fourier transform of c(x,y,t). The values of D can be determined by curve-fitting of experimental data, represented by confocal microscope video images, with Equation (2).
Experiments were carried out at room temperature (22 °C) using a confocal laser scanning microscope (A1R-SI, Nikon, Japan). The specimens were excited and photobleached by an argon laser (488 nm wavelength) using a Plan Apo 20x/0.75 DIC N2 WD 1.0 objective (Nikon, Japan), and emitted fluorescence in the green range of wavelengths. To minimize the error due to the out-of-plane diffusivity contribution, a multi-layer bleaching protocol was implemented as previously reported [21, 22, 26]. Each test consisted of five pre-bleach images followed by a time series of 200 post-bleach images. The size of the images was 128×128 pixel (460.7×460.7 μm2), with an initial circular bleach spot of 16 pixel diameter. The time lapse between two consecutive images was 0.25s. In order to minimize the contribution of the fluorescence emission of the background, pre-bleach images were averaged and then subtracted from the post-bleach image series. Image analysis was carried out using a custom MATLAB-based algorithm [23].
Measurement of tissue composition: Determination of Tissue Composition:
The contents of water, and GAGs in the cartilaginous specimens was measured. Specifically, specimens were weighed immediately after preparation (Wwet) and after lyophilization (Wdry). Weight measurements were conducted using an analytical balance (Model ML104, Mettler Toledo, Columbus, OH) with a readability of 0.1 mg and a repeatability of 0.1 mg. Average values of Wwet and Wdry were 22 mg and 5 mg, respectively. The fraction of water content was measured as:
| (3) |
Subsequently, following an established experimental protocol [28], a DMMB assay was utilized to determine the masses of GAGs, whose mass fraction was defined with respect to tissue dry weight as:
| (4) |
Statistical Analysis:
A first question of interest was to determine the effect of solute size on the magnitude of diffusivity in both tibia and femur cartilage. Accordingly, ANOVA followed by post-hoc Tukey test was used to investigate significant differences in the magnitudes of diffusion coefficients across solutes. Also, two-sample t-test was used to determine whether, for each solute investigated, the type of tissue (femoral or tibial cartilage) had any significant effect on the magnitude of the diffusion coefficient. Moreover, a simple linear regression model was used to investigate correlation among solute diffusion coefficients and their Stokes radii (rs). Additional simple linear regression models were used to investigate correlations among solutes diffusion coefficients and water and GAG content in the cartilage samples. All the statistical analyses were conducted using Minitab®19 statistical software (Minitab, LLC, State College, PA). For each test conducted, a level of significance of 0.05 (α = 0.05) was used. All the data are reported in terms of mean ± standard deviation.
RESULTS
A summary of the measured diffusion coefficients for all the molecular probes and tissue type investigated in this study is reported in Table 2. In both femoral and tibial cartilage, the magnitudes of diffusivities were significantly different between molecular probes (p < 0.01) with those of fluorescein being the largest (114.1±32.6 μm2/s and 107.8.5±26.1, respectively), and those of D70K being the smallest (14.7±0.9 μm2/s and 14.3±1.2 μm2/s, respectively). Also, for each molecular probe investigated, the magnitudes of D in femoral and tibial cartilage were not statistically different (p > 0.05). Therefore, in all the subsequent statistical analyses and data representations, values of diffusion coefficients in femoral and tibial cartilaginous samples were pooled together. Through a simple linear regression analysis, it was found that D was positively correlated to the inverse of the Stokes radii (R2 = 0.91), see Figure 2.
Table 2.
Summary of molecular probes diffusivities. Data are reported in terms of mean ± standard deviation. Grouping of pairwise comparison obtained after Tukey test are reported.
| Molecular Probe | Femur | Tibia | ||
|---|---|---|---|---|
| D [μm2/s] | Grouping | D [μm2/s] | Grouping | |
| Fluorescein | 114.1±32.6 | A | 107.8.5±26.1 | A |
| Insulin | 60.4±15.1 | B | 62.2±12.9 | B |
| D3K | 69.2±11.6 | B | 66.5±15.2 | B |
| BSA | 39.3±6.4 | C | 38.3±6.0 | C |
| D70K | 14.7±0.9 | D | 14.3±1.2 | D |
Figure 2:
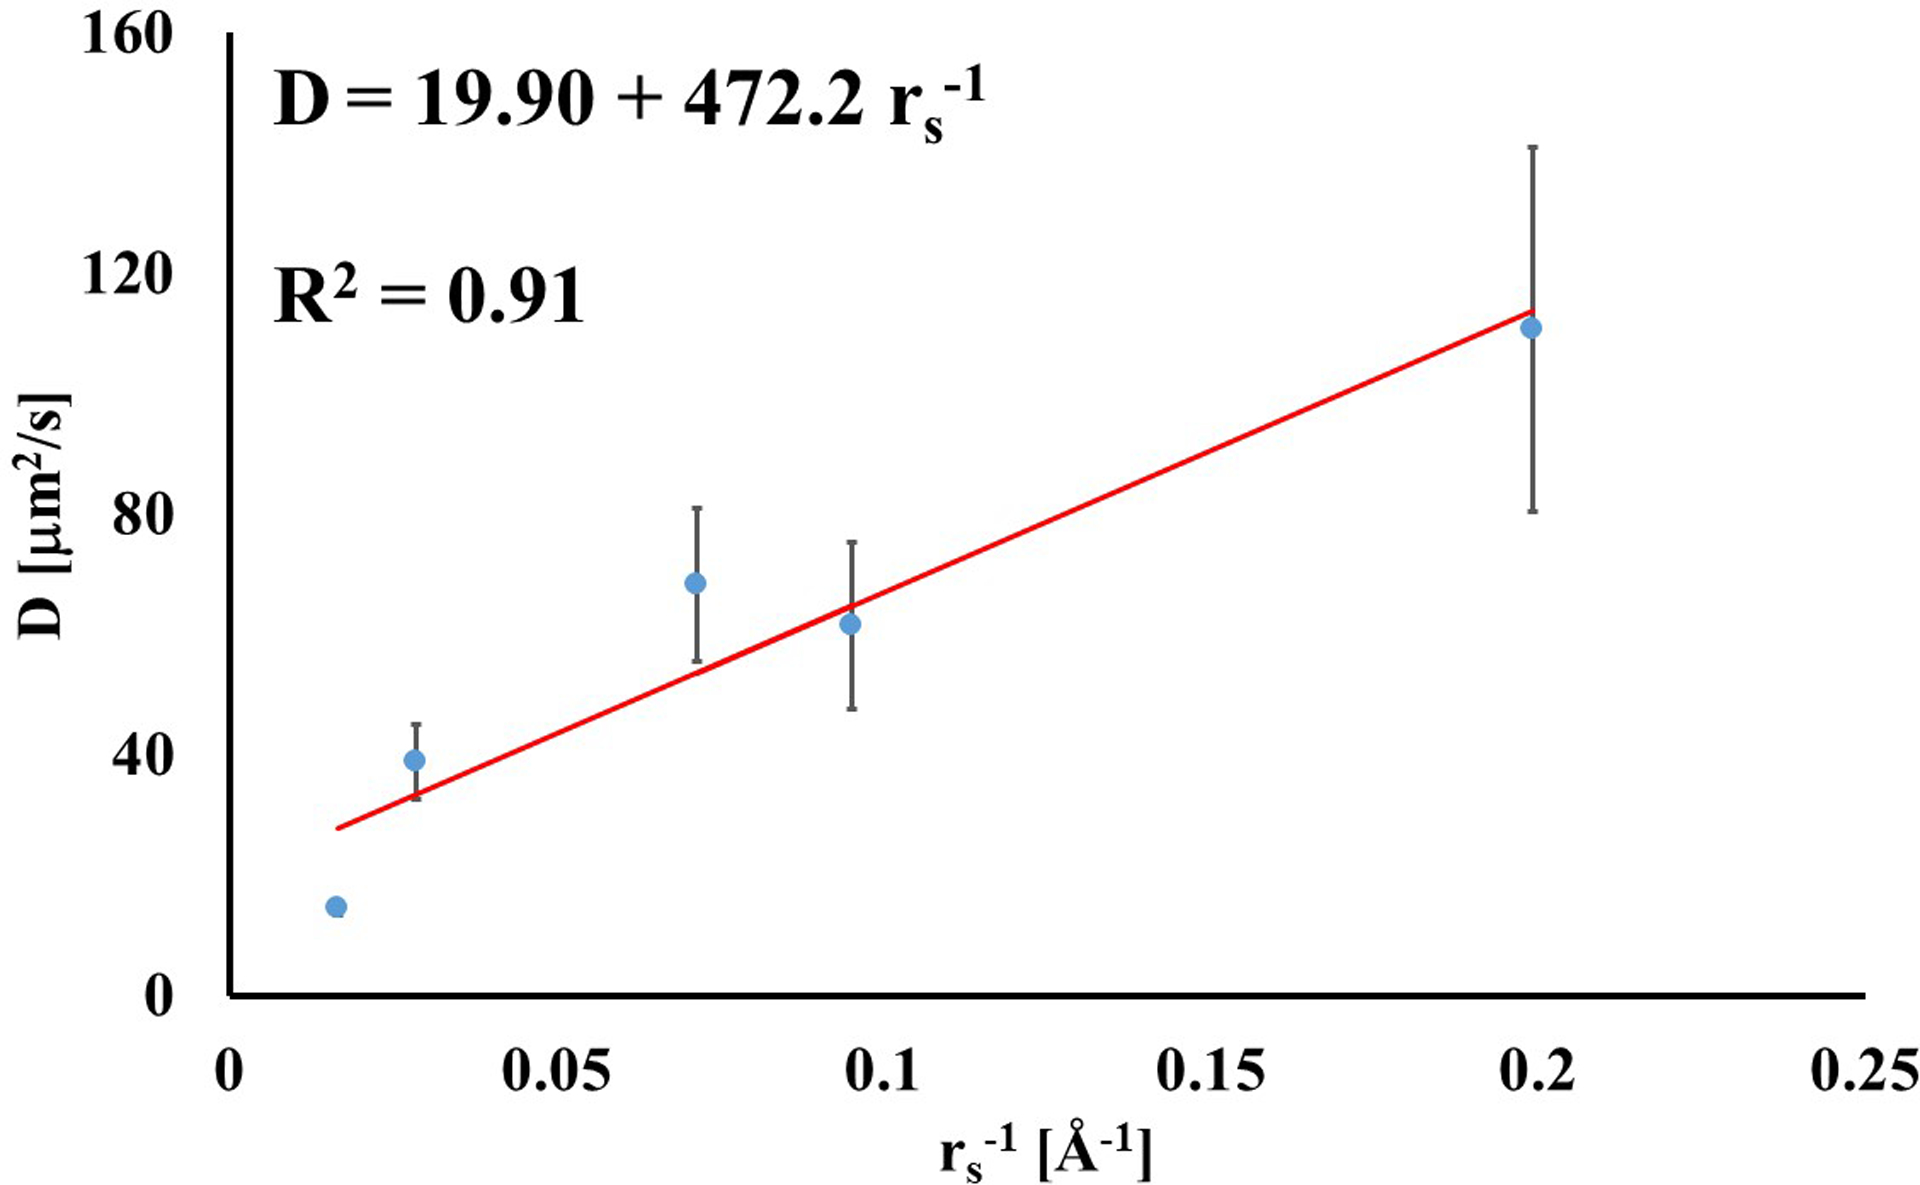
Diffusivity is related to the inverse of the solute Stokes radius. For the data reported in the figure, diffusion coefficients of tibial and femoral cartilage were averaged together.
A summary of tissue composition measurements is reported in Table 3. A significant difference (p < 0.05) in tissue composition between tibial and femoral samples was observed: tibial samples were characterized by larger water content (0.75±0.02) and less GAG content (0.078±0.004) when compared to femoral samples (0.71±0.02 and 0.087±0.006, respectively).
Table 3.
Summary of tissues composition. Data are reported in terms of mean ± standard deviation.
| Tissue | Water fraction on total weight (ϕw) | GAG fraction on dry weight |
|---|---|---|
| Tibia | 0.75±0.02 | 0.078±0.004 |
| Femur | 0.71±0.02 | 0.087±0.006 |
In investigating the effect of tissue water content on solute diffusivity, only the values of D associated to fluorescein, D3K and BSA exhibited a significant (p < 0.05), yet weak (R2 < 0.2) positive correlation with φw, Figure 3.
Figure 3:
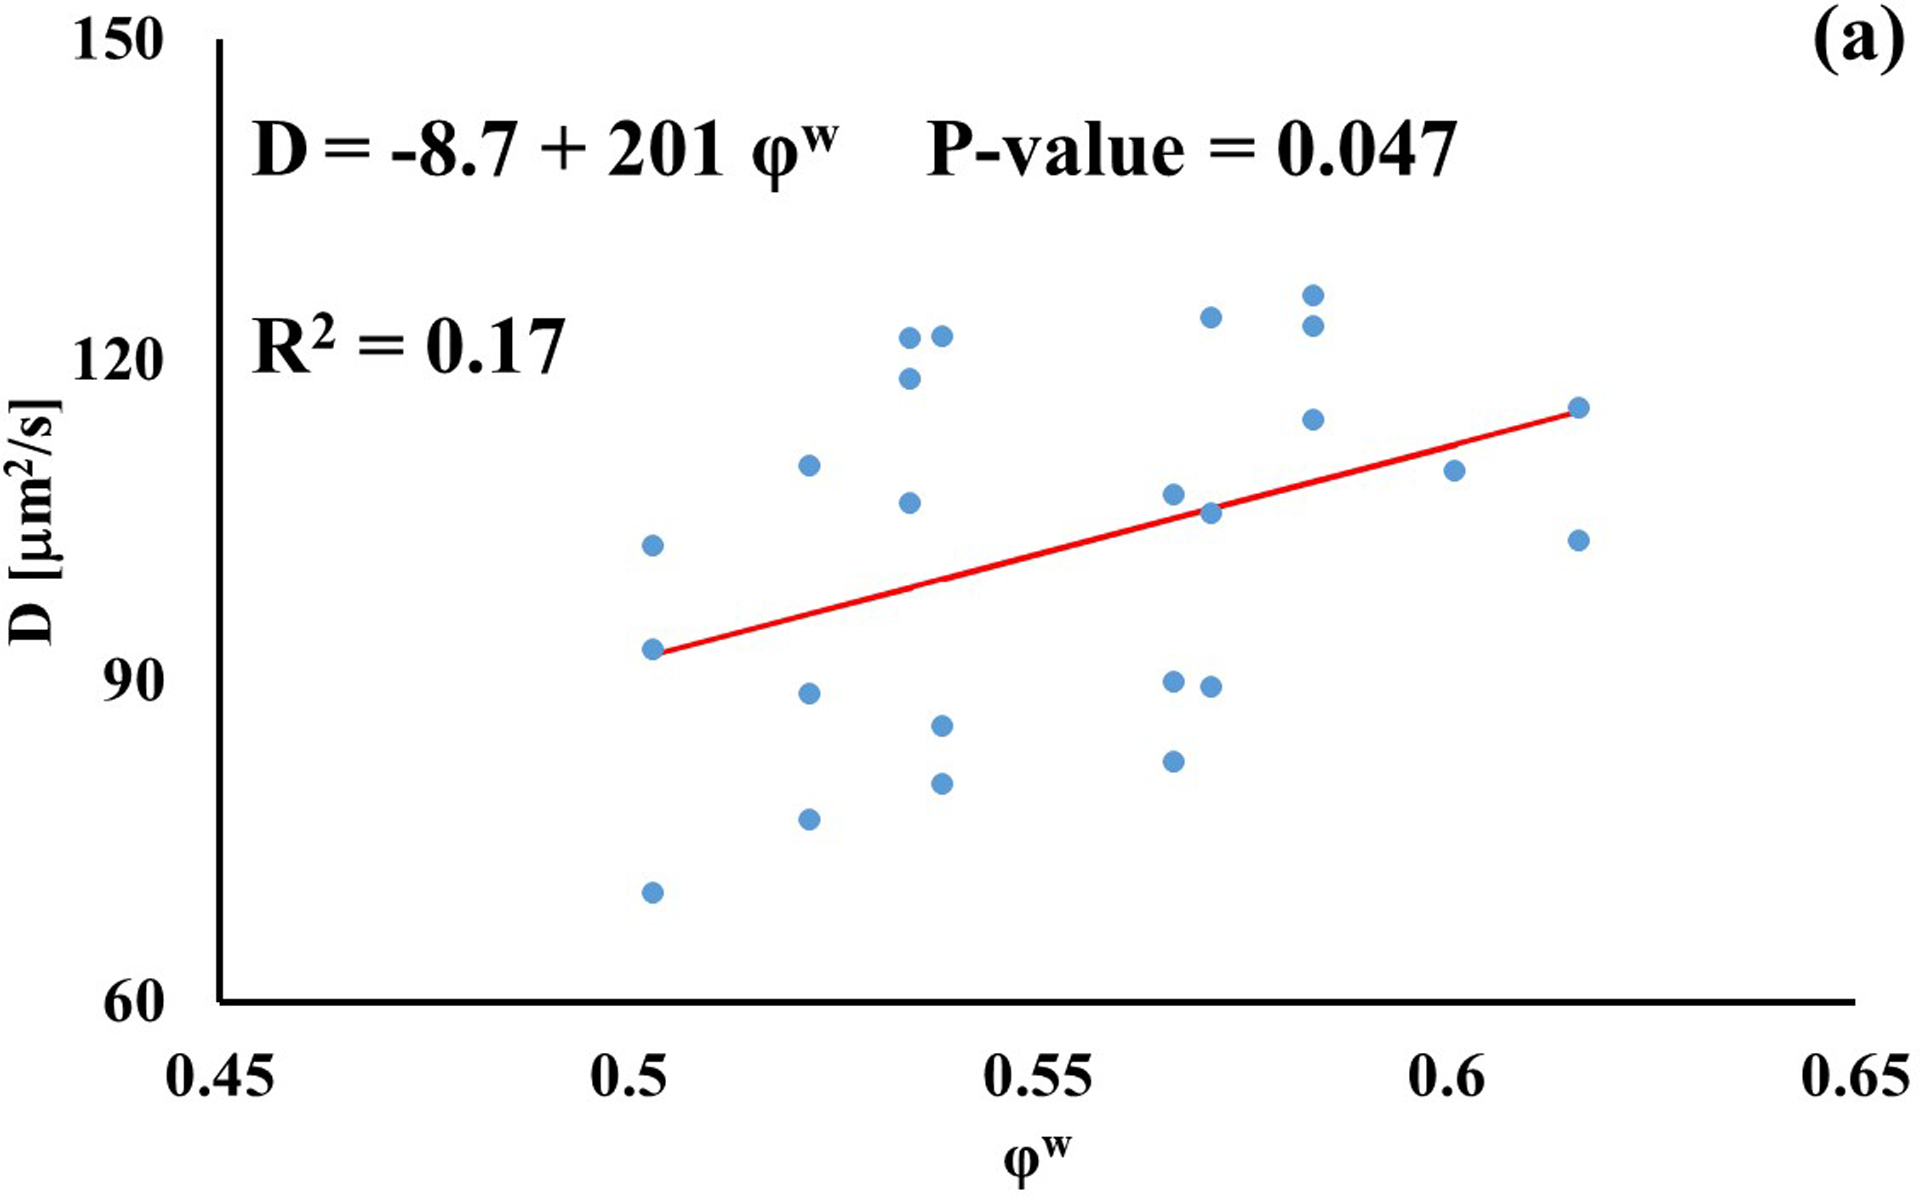
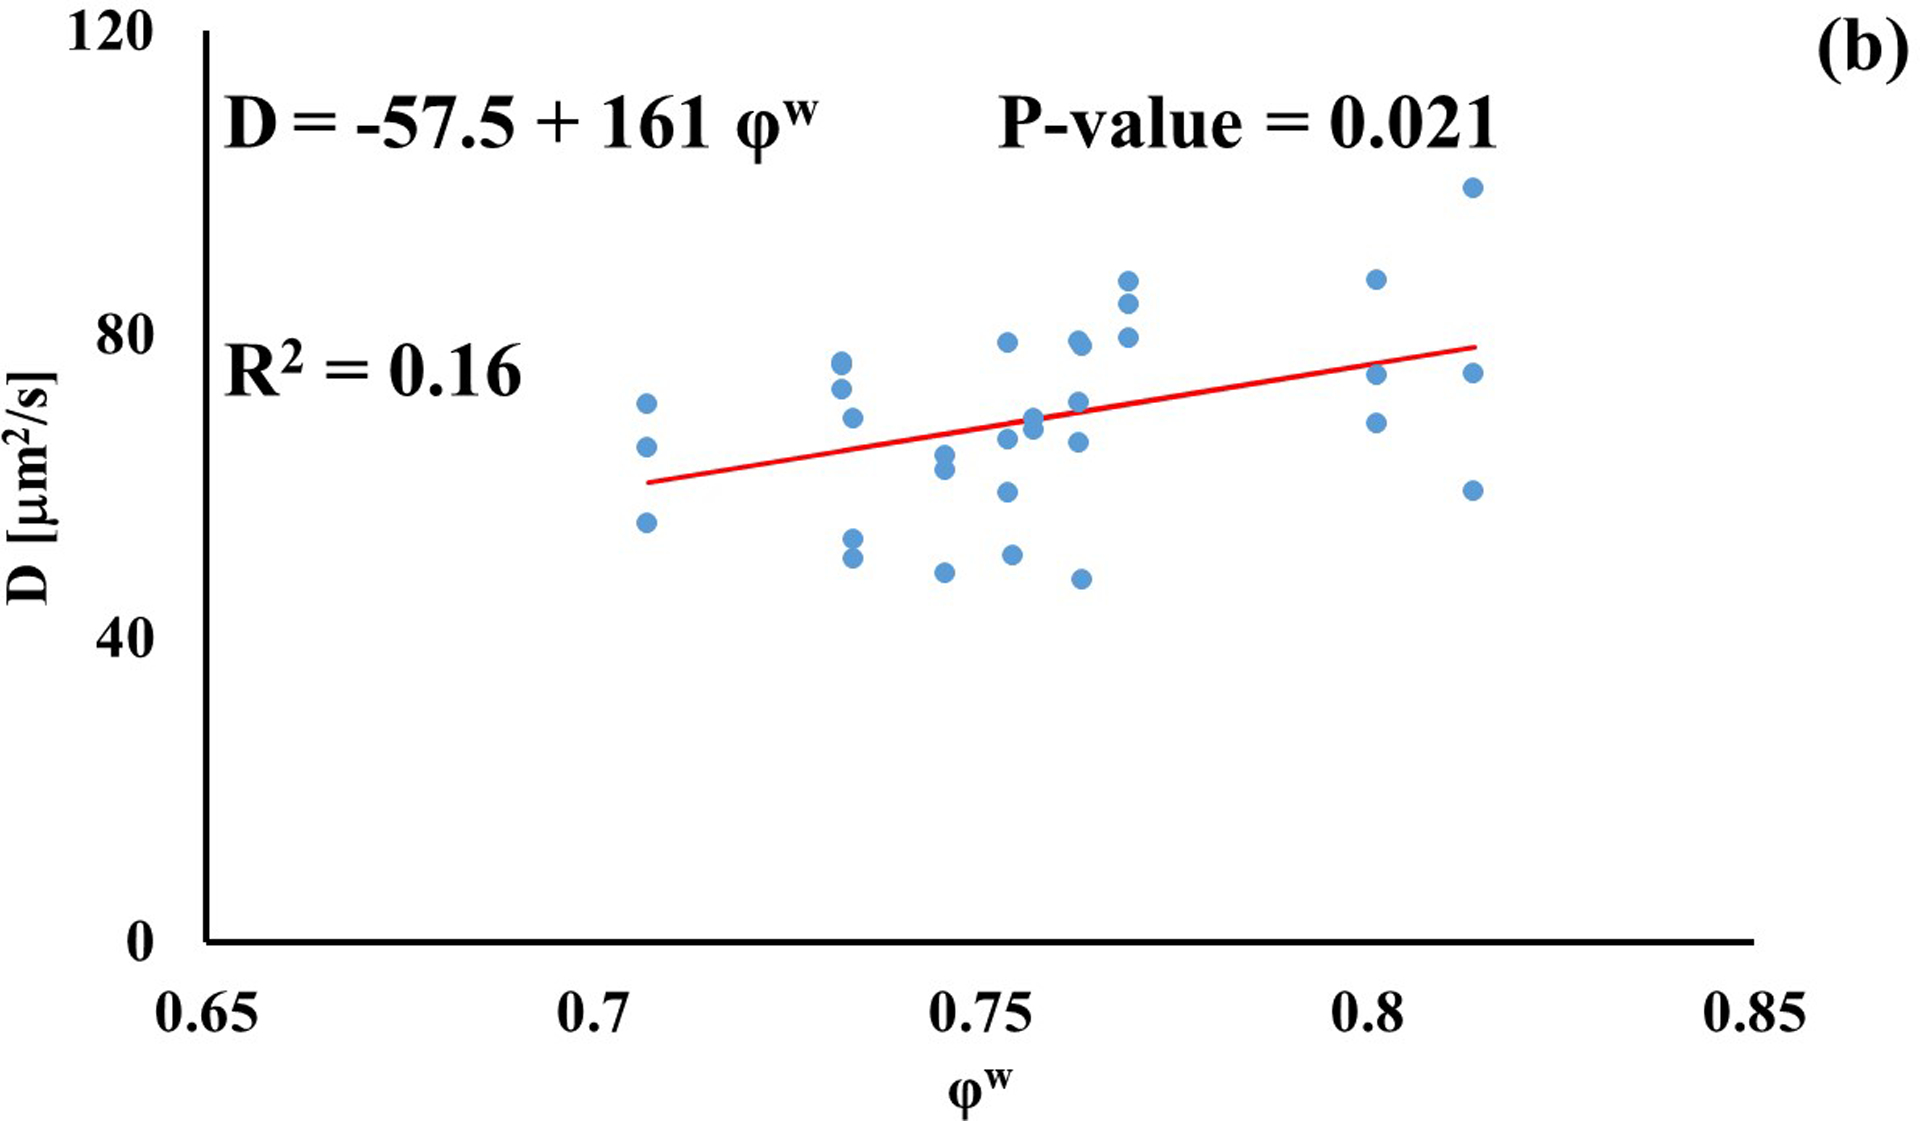
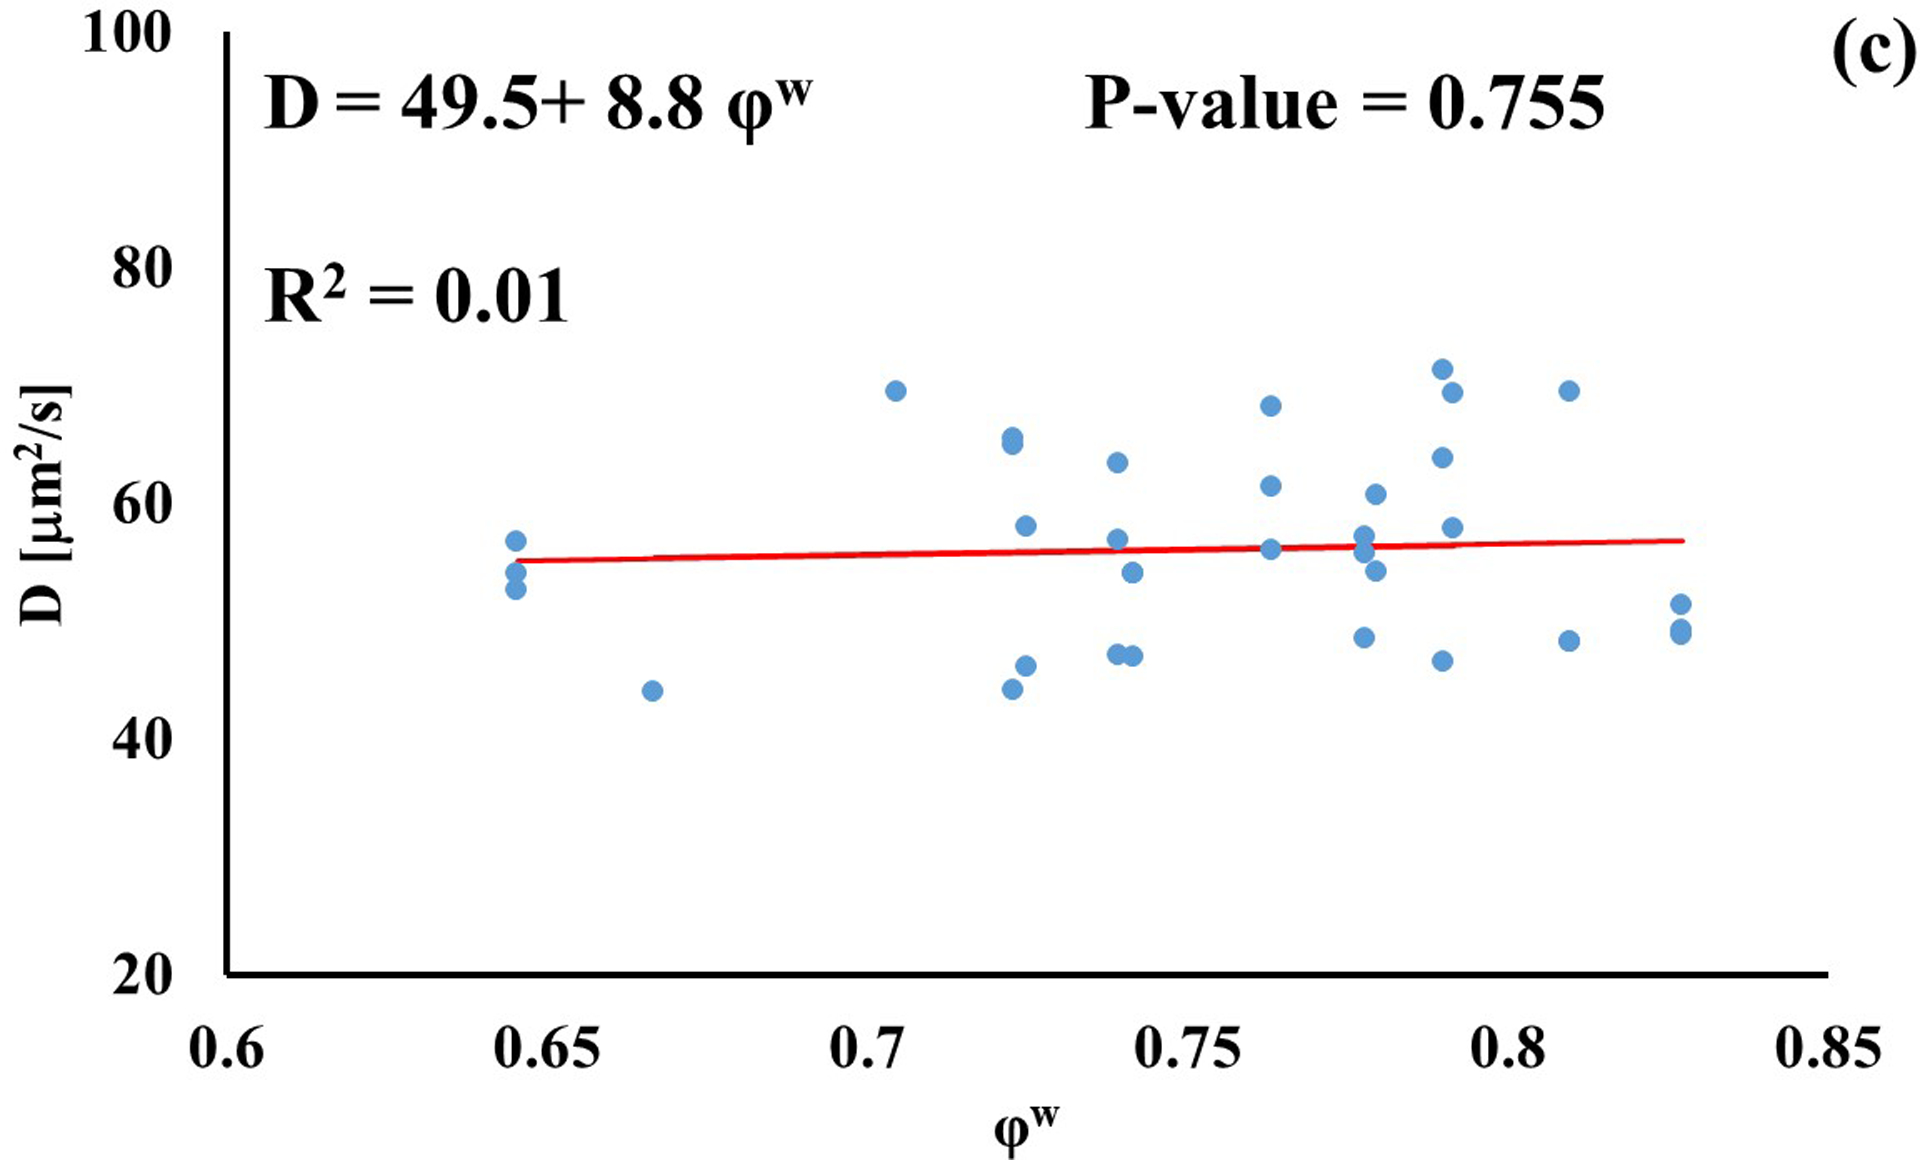
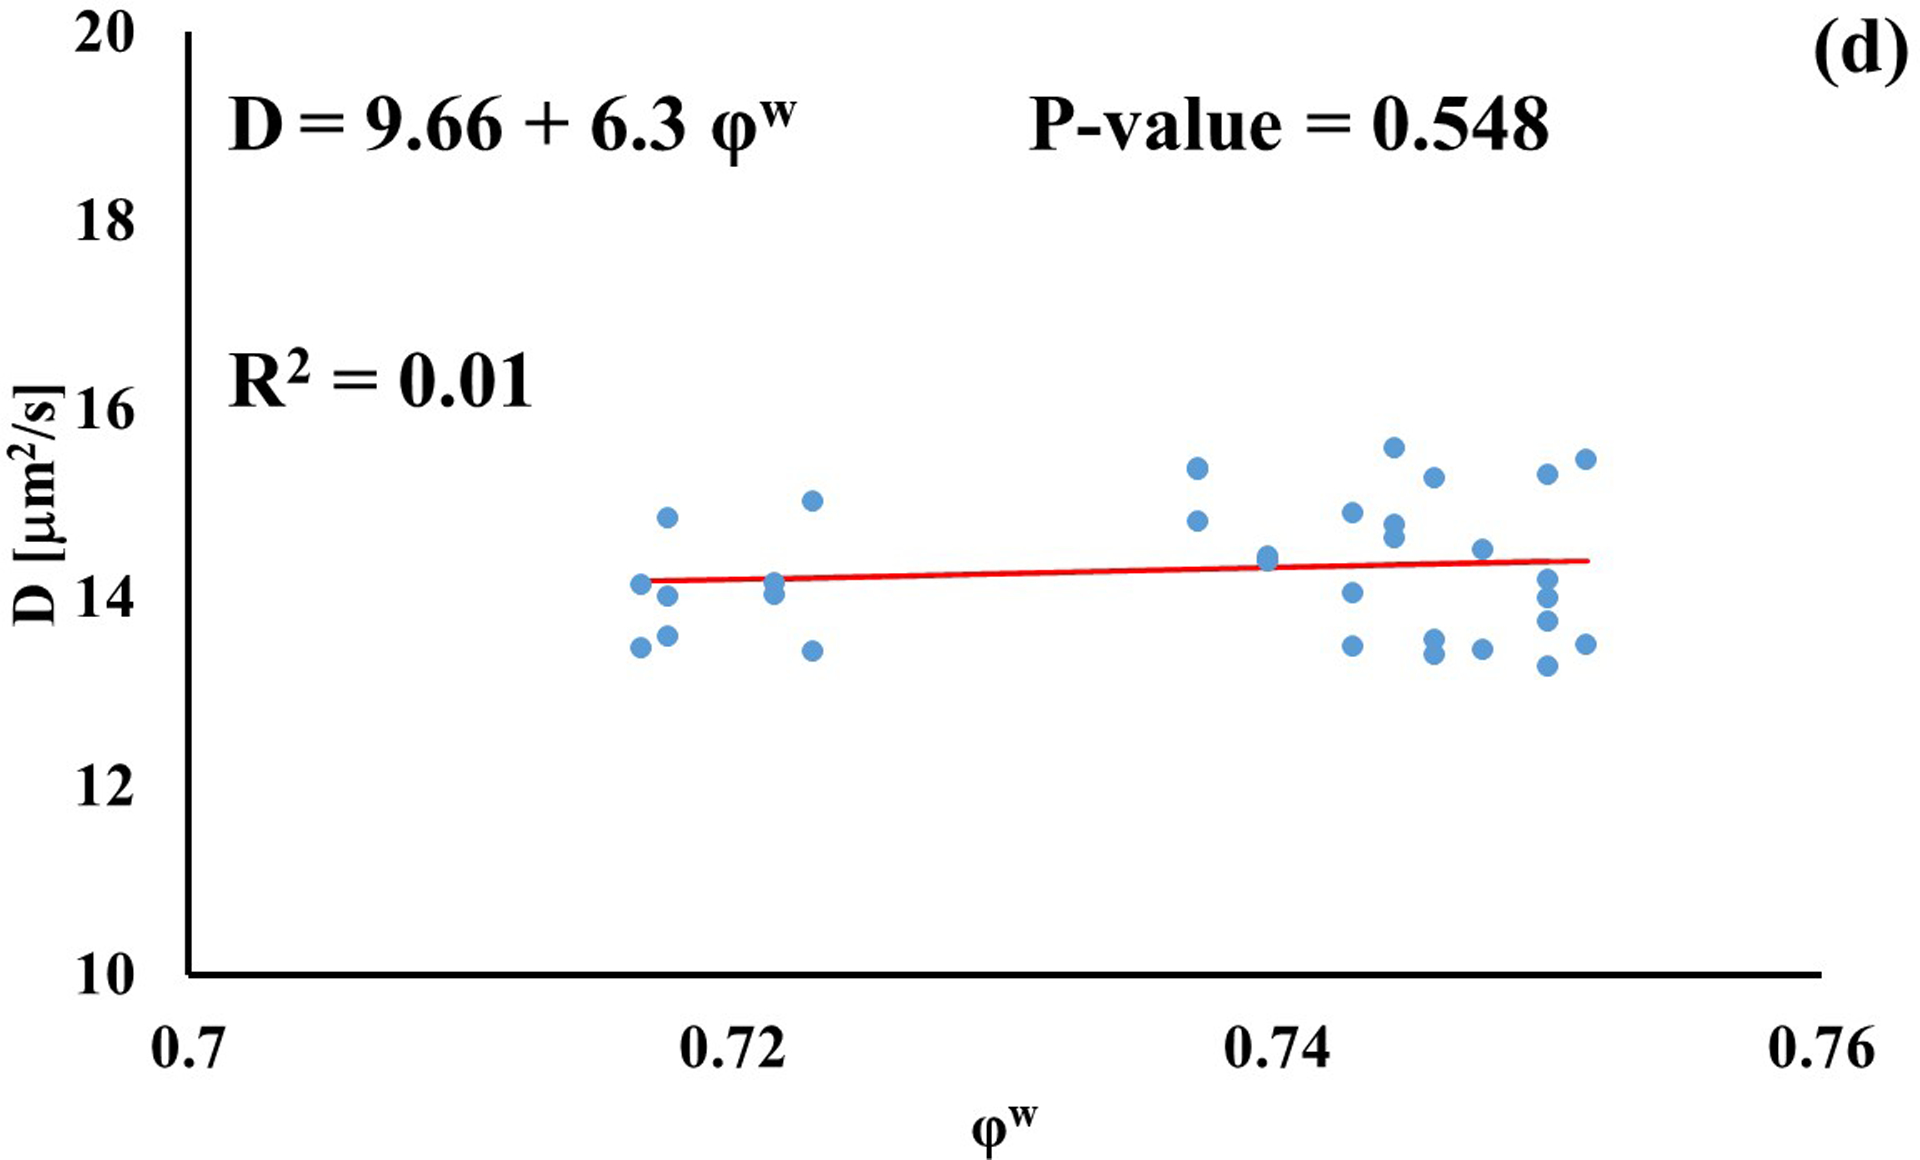
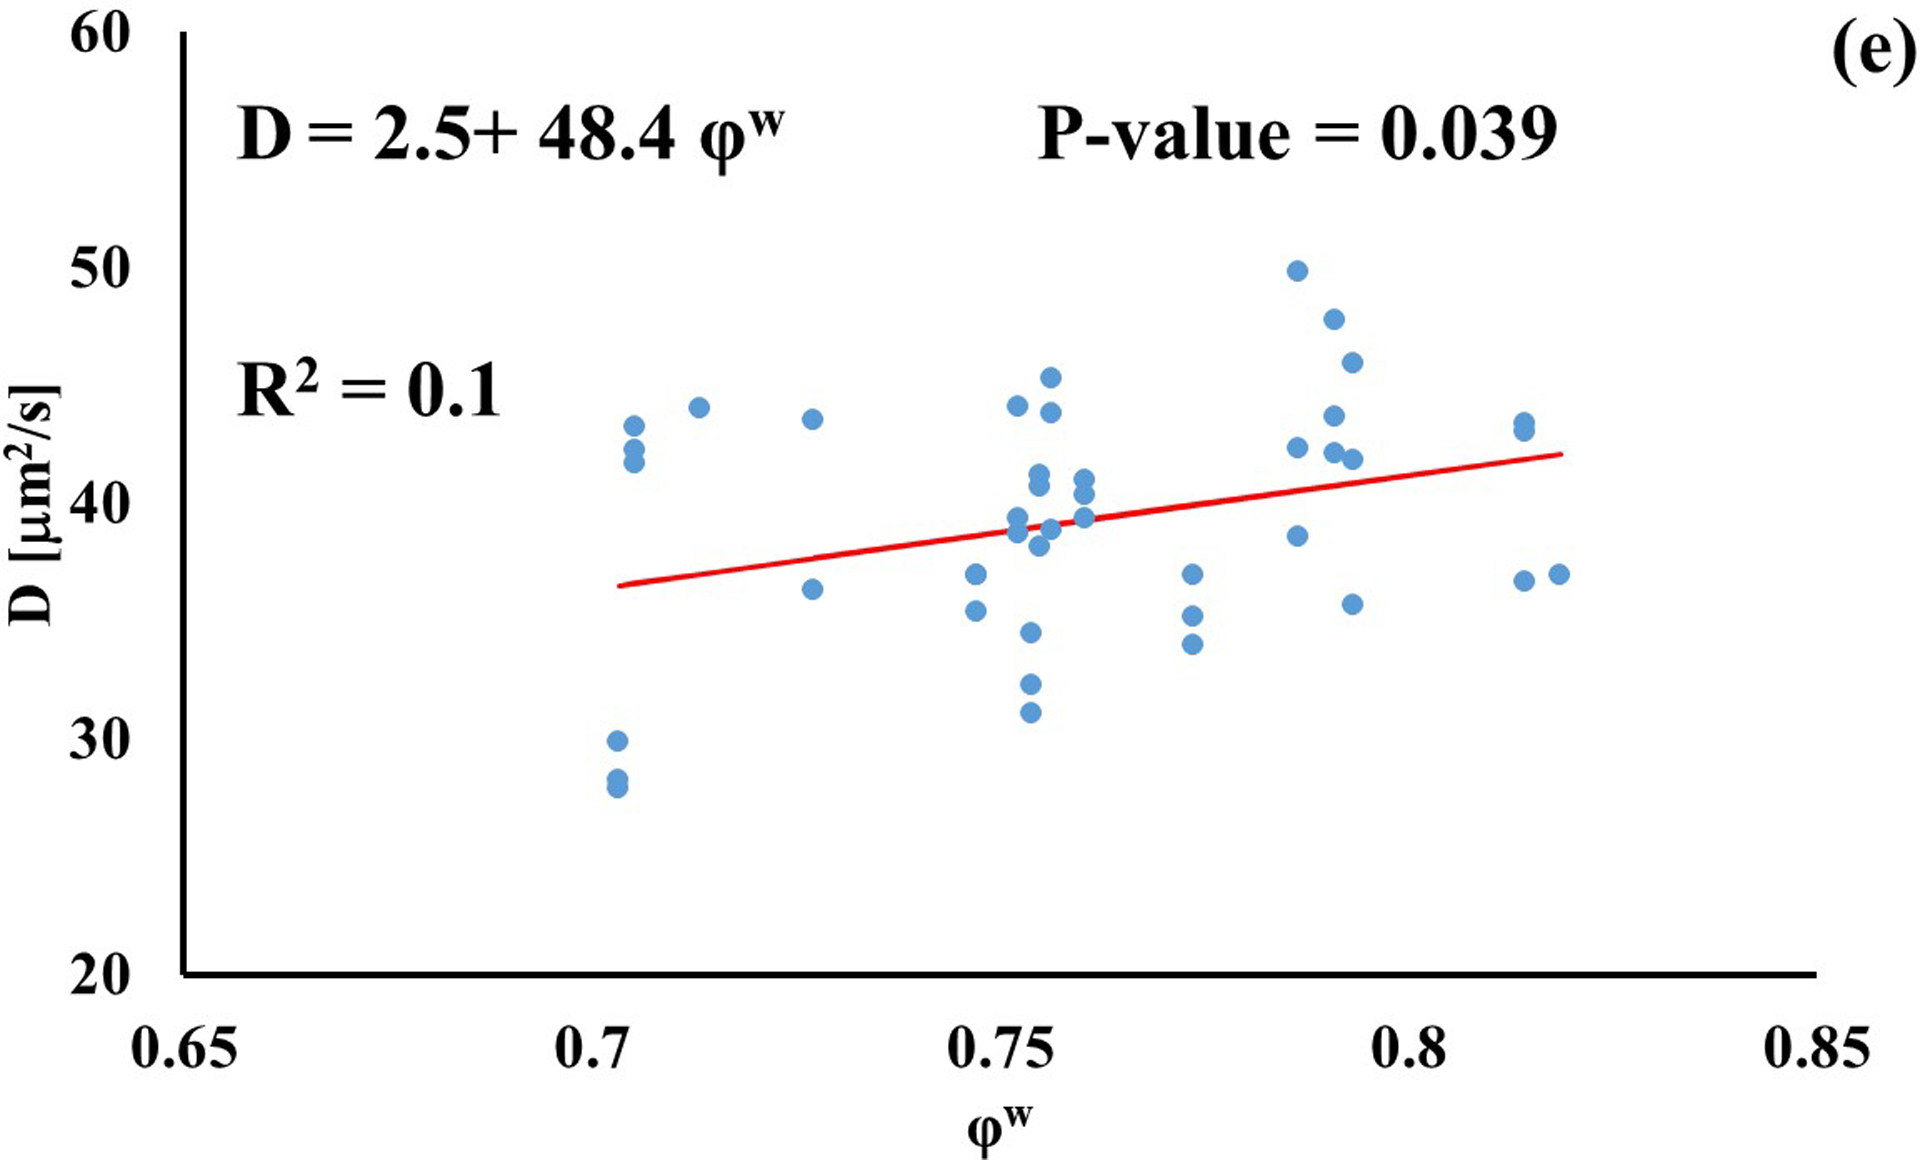
Relationship between solute diffusivity and water content: (a) Fluorescein; (b) D3K; (c) Insulin; (d) D70K; (e) BSA. For each solute investigated, diffusion coefficients of tibial and femoral cartilage samples were pooled together.
Stronger relationships were found among GAG content and diffusivities: the values of D for D3K and D70K were positively correlated to φGAG (R2 = 0.67 and R2 = 0.22, respectively), while those for BSA were negatively correlated to the amount of GAGs in the tissue (R2 = 0.46). Diffusivities of fluorescein and insulin were not significantly affected by GAG content (p > 0.05), see Figure 4.
Figure 4:
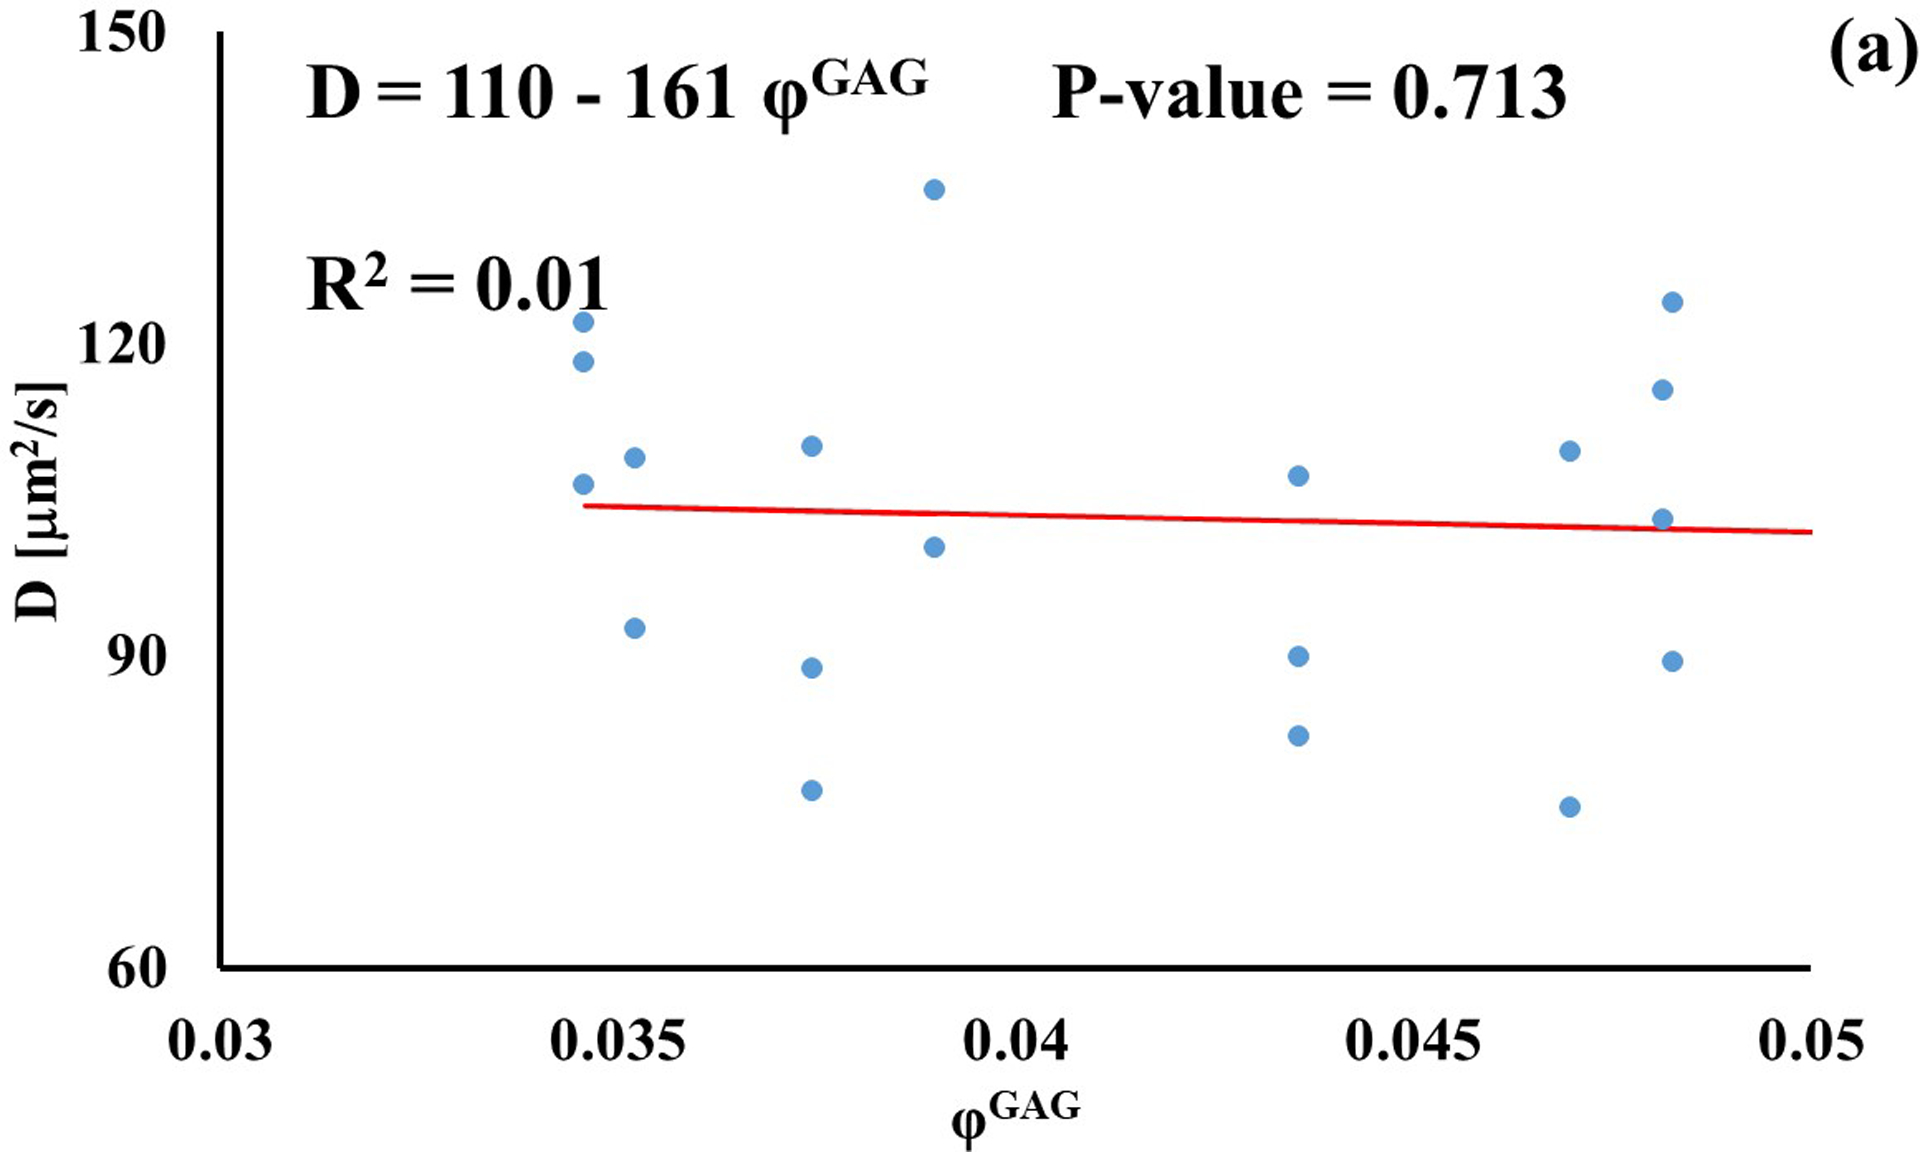
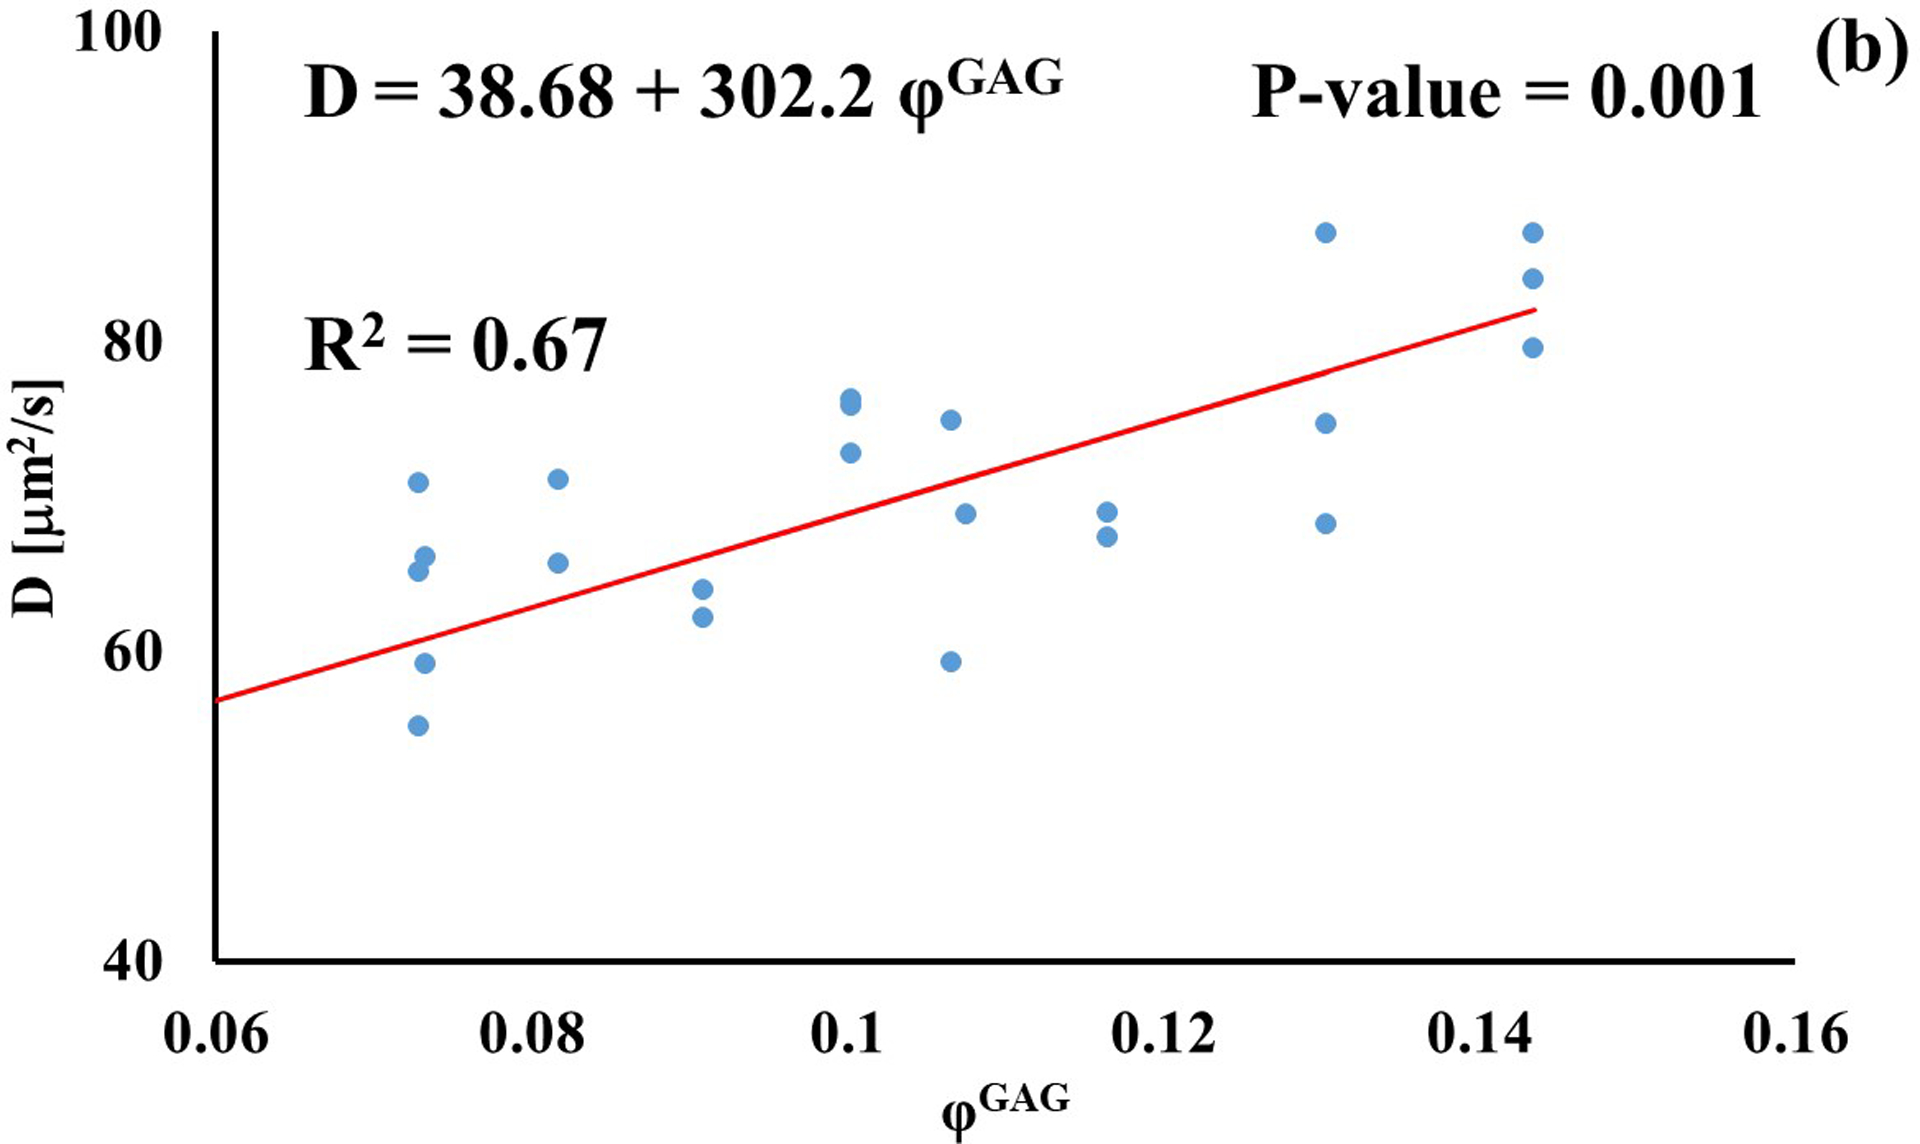
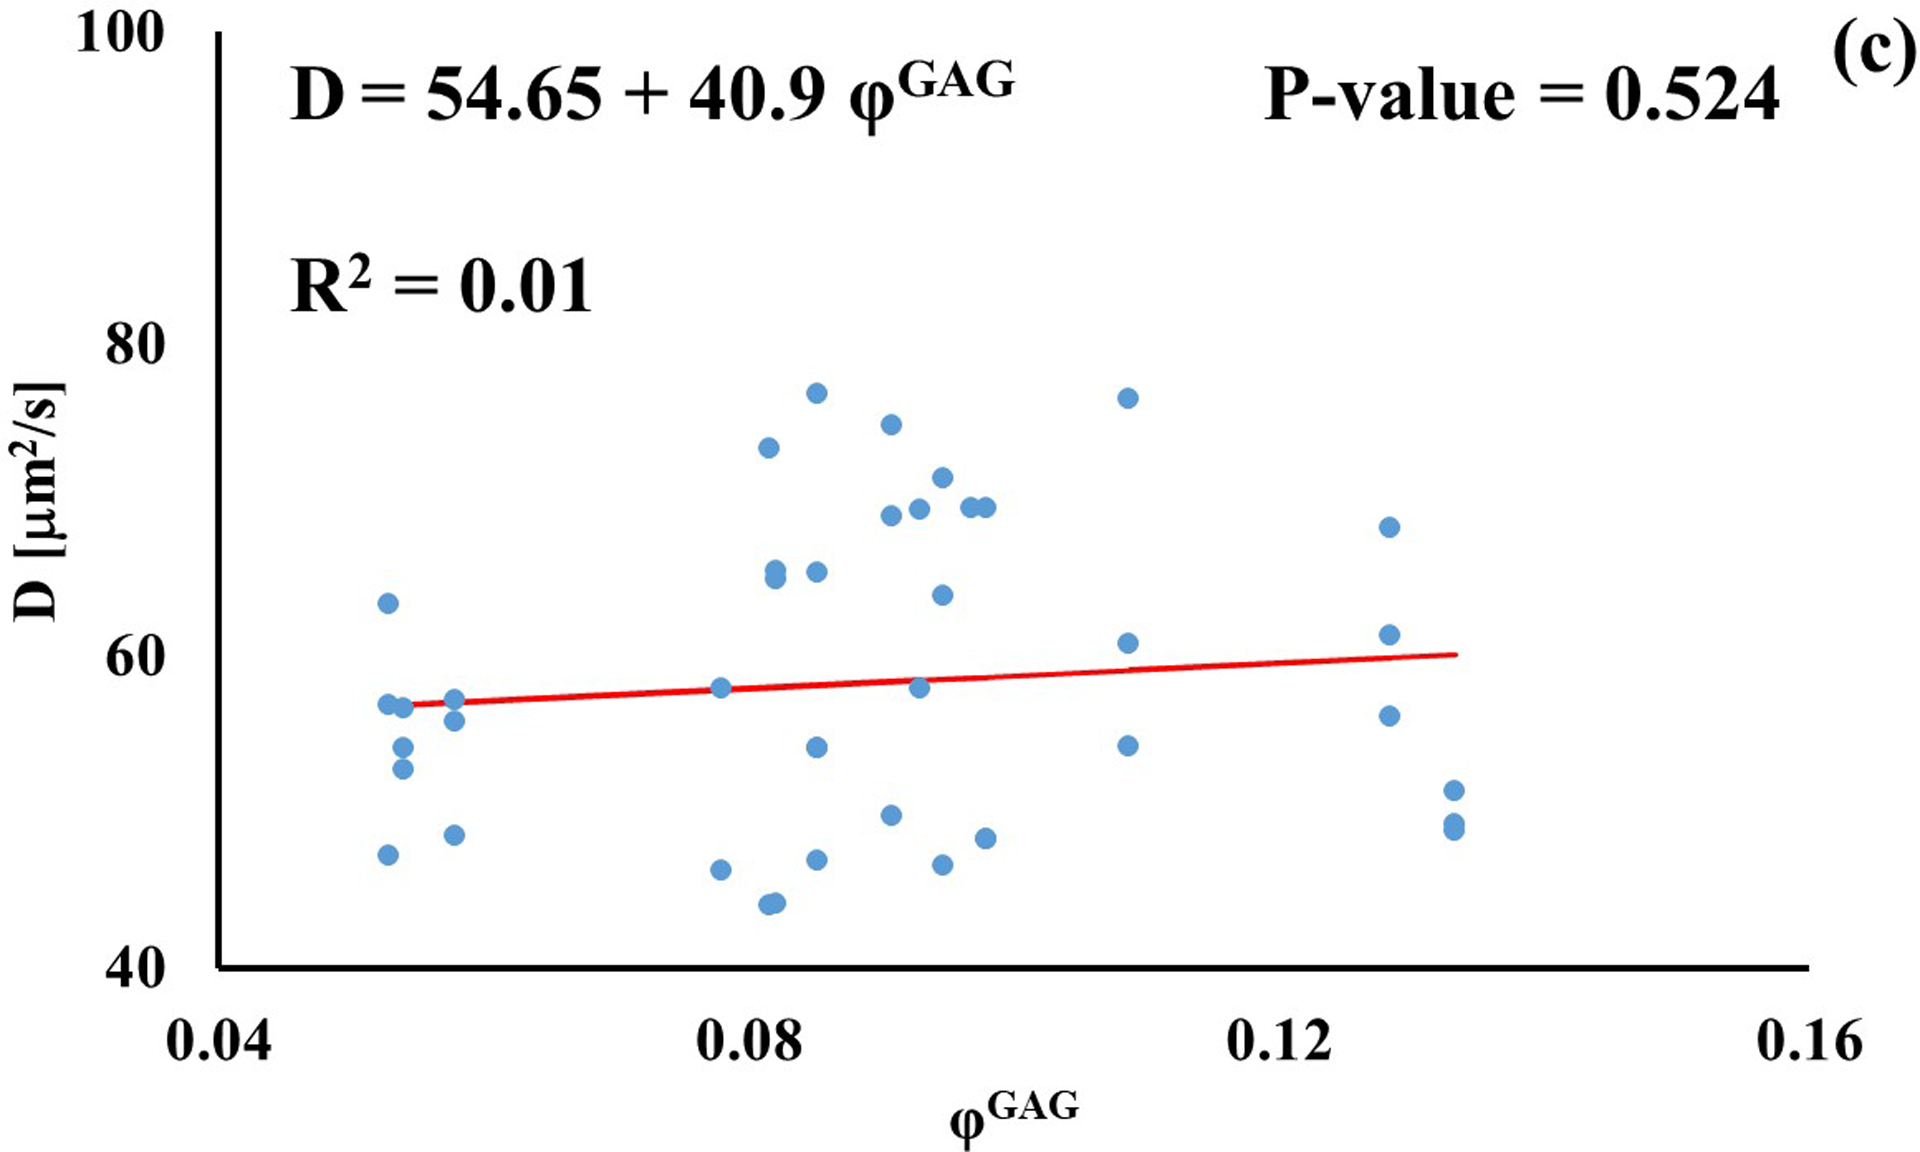
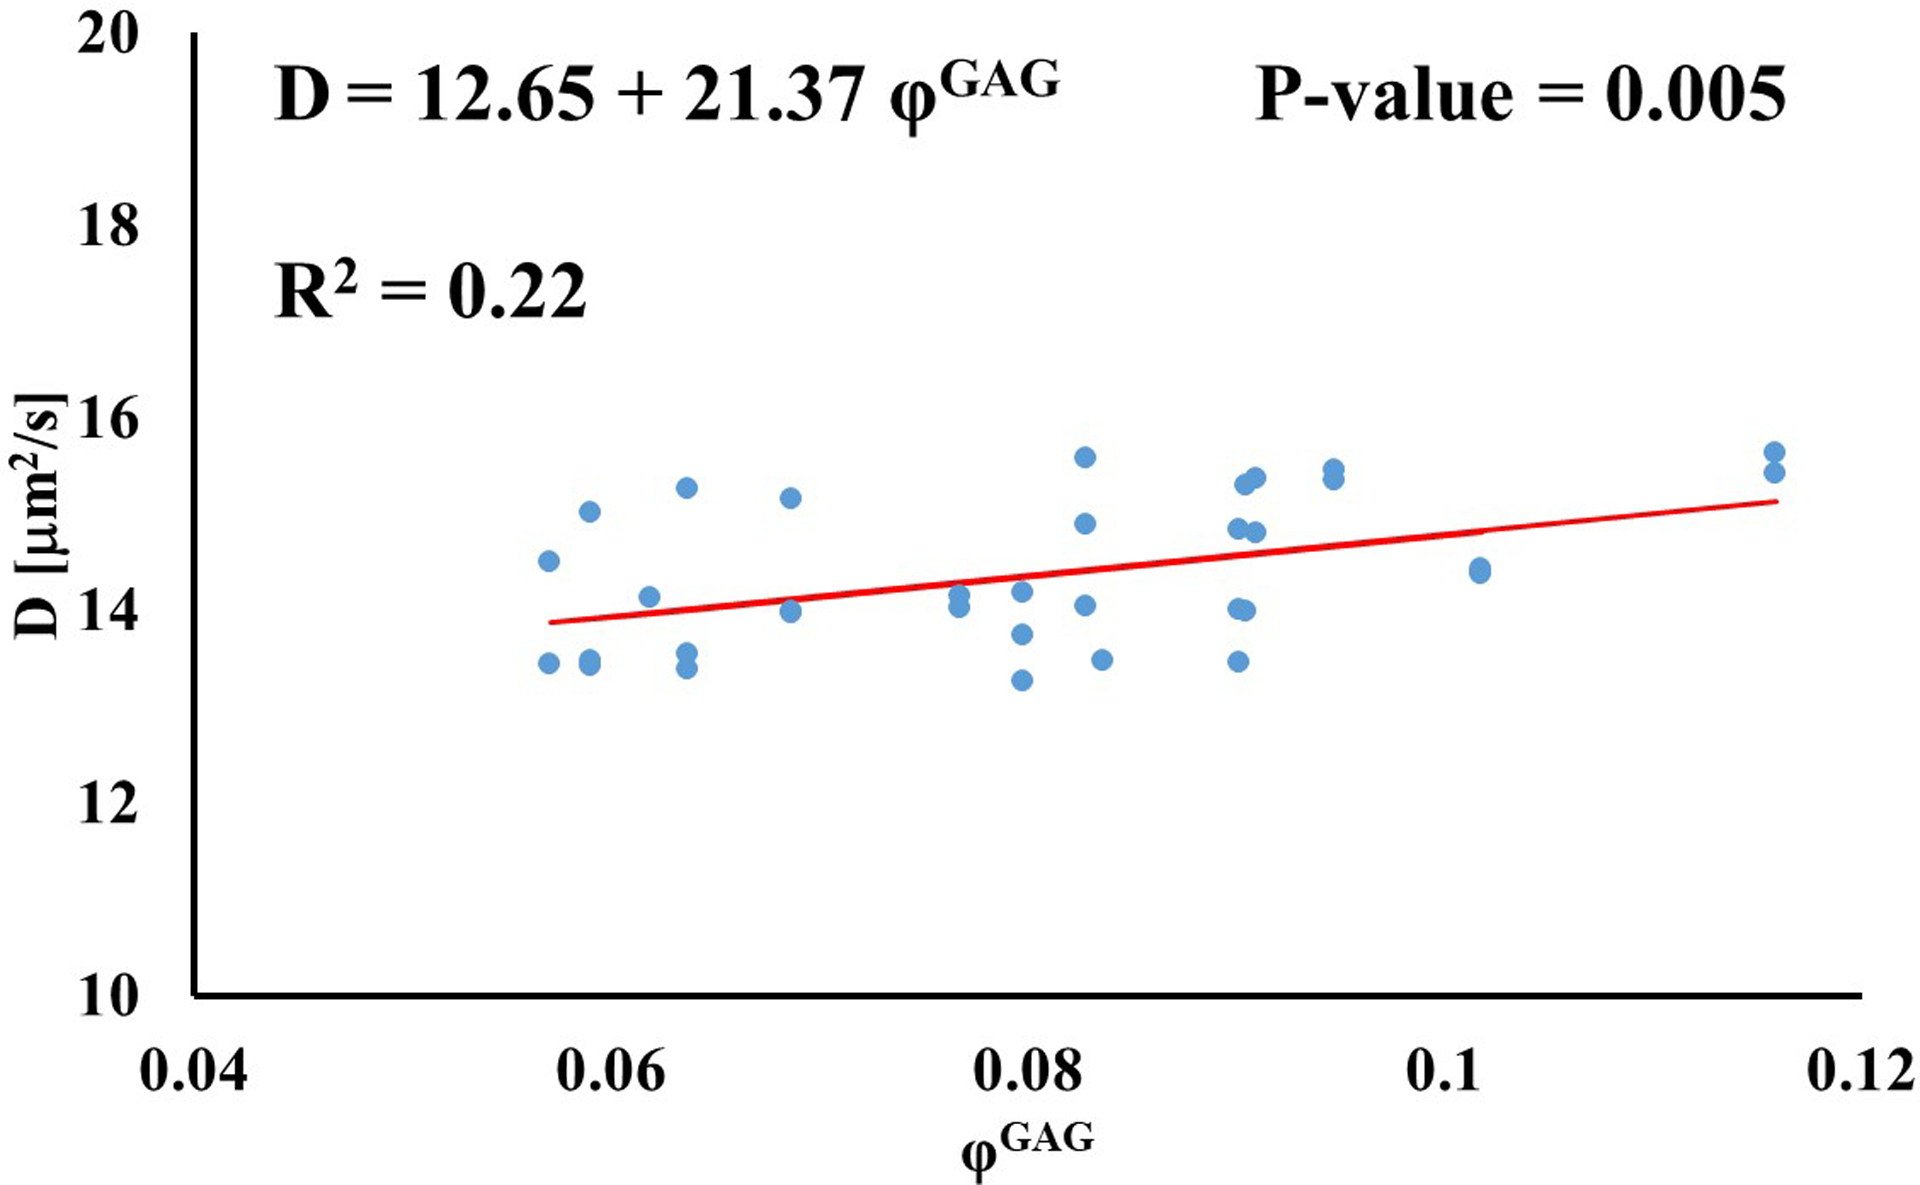
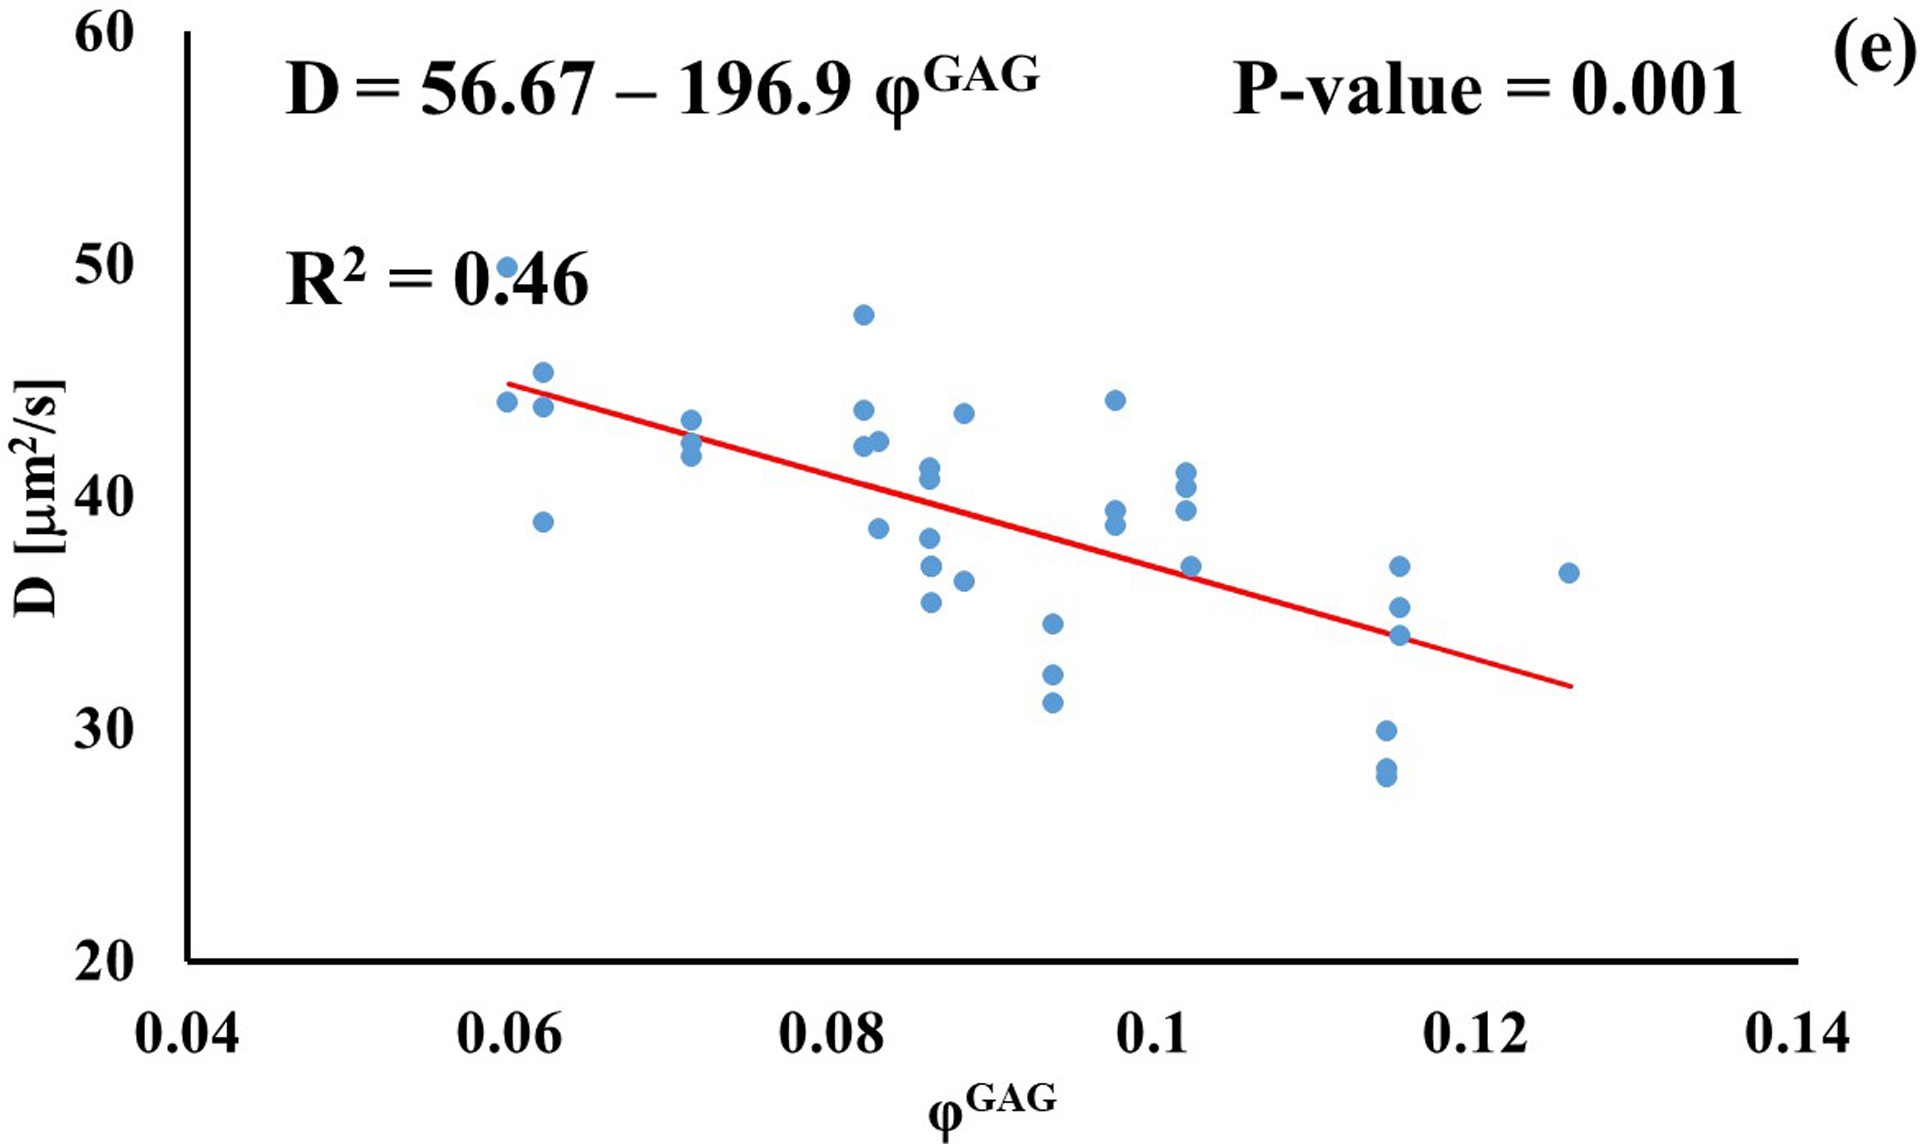
Relationship between solute diffusivity and GAG content: (a) Fluorescein; (b) D3K; (c) Insulin; (d) D70K; (e) BSA. For each solute investigated, diffusion coefficients of tibial and femoral cartilage samples were pooled together.
DISCUSSION
This study investigated the solute diffusive transport of a wide range of molecular probes and their relationship with molecular size and tissue composition in the articular cartilage of the human knee.
Experiments were conducted on condyle cartilage form the tibia and femur. Measurements of tissue composition indicated that femoral samples were characterized by a larger GAG content and a lower water content when compared to the tibial ones, see Table 3. However, despite the difference in composition, diffusivities in tibial and femoral samples were not statistically different from one another, for any of the solutes investigated in the study. Instead, as reported in previous studies (see review [19]), diffusivity was inversely related to solutes’ molecular weight, see Table 2. Specifically, fluorescein (~332Da) was associated with the largest measured diffusion coefficient ~110μm2/s. There are no records of measurements of fluorescein diffusivity in articular cartilage. However, the values reported in this study seem reasonable when considering that sucrose (~342Da) diffusivity in human cartilage was estimated to be ~130μm2/s [29], and similar values of diffusivity have been reported for other cartilaginous tissues, such as intervertebral disc, meniscus and temporomandibular joint [21, 22, 26, 30, 31]. The diffusion coefficients associated with D3K and insulin were not statistically different from each other, and ranged between ~60 and ~70μm2/s. Such a range of values is in agreement with previous measurements of D3K diffusivity in animal tissue, ranging from 30 to 76μm2/s [32, 33], and insulin diffusion coefficient in human and bovine tissue, varying from 22 to 93μm2/s [29, 34, 35]. Also, the diffusion coefficient of BSA was measured to be ~38μm2/s, which is comparable to the range of 20 to 38μm2/s associated to spherical molecules of similar size [36]. Finally, the smallest diffusion coefficient was that of D70K, measuring ~14μm2/s. This value was about half of that measured in human and animal tissue [33, 35, 37], but not largely different from what measured in superficial porcine cartilage (<20μm2/s) [33].
Several models describing the mechanisms of solute diffusivity in porous media have been proposed, and relate solutes diffusion coefficients to their hydrodynamic radii and characteristic structural dimensions of the media, among other parameters [38–40]. Cartilage is a porous medium and it would be reasonable to expect that its diffusive properties could be described by one of the proposed models in the literature. However, DiDomenico and Bonassar showed that existing theoretical models relating diffusivity in cartilage to the size of the diffusing probe are suboptimal. In their study, the authors propose an empirical power law relationship to predict the magnitude of diffusion coefficients of spherical probes as a function of their hydrodynamic radius [19]. This study investigated both spherical (fluorescein, insulin and BSA) and linear (D3K and D70K) molecular probes. The measured diffusion coefficients were found to be inversely related to the Stokes radii of the molecular probes, following a relationship reminiscent of the Stokes-Einstein, see Figure 2. Similar findings were reported for dextran molecules diffusing in porcine knee cartilage [33]. However, it should be noted that the empirical relation reported in Figure 2 presents the limitation of having been determined by pooling together spherical and linear molecular probes, whose diffusion mechanisms in the cartilage may be different and, therefore, not directly comparable.
The effect of tissue composition of solute diffusivity was also investigated by attempting to establish empirical relations with water and GAG content in the tissue. The results indicated that water content had a negligible effect on solute diffusivity: correlations between φw and D were only significant for fluorescein, D3K and BSA, with R2 values smaller than 0.2, see Figure 3. Change in water content in the tissue may alter the distance between collagen fibers constituting the solid mesh of the cartilage. Nevertheless, collagen has not been considered to be a significant influence on the diffusion of most molecules in cartilage because of the large spacing existing among fibers [11]. This may explain the minimal effect played by φw and D hereby reported. It should be also noted that measurements of water content were conducted on tissue samples adjacent to those used for FRAP. As such, small regional variations might have contributed to difficulty in direct correlation. Conversely, proteoglycans are believed to contribute to hindering solute diffusivity in cartilage [11, 35], and our results indicate that GAG content significantly affected the magnitude of the diffusion coefficients of D3K, D70K and BSA, see Figure 4. Specifically, for the case of BSA, diffusivity was inversely related to φGAG (Figure 4e), corroborating evidence on the hindrance role played by GAGs on molecular mobility. In contrast, the magnitudes of the diffusion coefficients of D3K and D70K were positively correlated to the GAG content (Figures 4b–d). Dextran macromolecules are linear and may follow diffusive mechanisms substantially different from those expressed by spherical solutes, such as BSA [19]. In fact, a direct proportionality between D70K and GAG content has been previously reported for the case of porcine cartilage [33]. Finally, the lack of significant correlation among φGAG and D of fluorescein and insulin may be attributed to the small size of these molecules, which makes their mobility less sensitive to structural organization of the tissue when compared to larger solutes.
Several limitations of this study should be noted. The results reported are based on human tissues obtained during autopsy, and only a limited range of tissue degenerative states and composition was obtained. To achieve more general results, in the future, the experimental cohort used in this study will need to be supplemented by additional data obtained from tissue samples including a broader range of biochemical composition. In any case, the fact that this study was based on human tissues provides clinical and translational relevance to the reported findings. Also, the investigation of this study was limited to electrically neutral molecular solutes. Charged solutes, by interacting with the negatively charged solid phase of the cartilaginous tissue, exhibit unique diffusive behavior [8, 36, 41–44]. Accordingly, future studies including charged solutes are planned in order to more fully understand solute transport behavior in the articular cartilage. Moreover, the study of the effect of tissue composition on molecular diffusivity was limited to the investigation of water and GAG components, and neglected the examination of the potential contribution of collagen content. However, the potential hindering effect of collagen on solute diffusivity is not expected to be significant due to the large spacing existing among fibers [11]. Furthermore, human articular cartilage is usually subdivided into five regions, including the superficial, the transitional, the upper radial, lower radial and calcified zone [25]. These regions exhibit variations in matrix biochemical composition, cell morphology, and cell–matrix structural organization as a function of depth [45–48]. Studies on porcine articular cartilage have shown that solute diffusivity of dextrans ranging from 3 kDa to 500 kDa significantly changes from surface to middle or deep zone [33]. In this study, cartilage samples were taken from the upper radial zone. Further studies are required to determine whether the structural and compositional characteristics of other cartilage zones determine measurable changes in the solutes’ diffusion coefficients. Finally, all the samples used in this study were harvested from knees that were visually inspected to determine the degradation grade of their articular cartilage, which was deemed to be 0 or 1 according to Outerbridge classification [24]. Nevertheless, the subgroup of samples used for fluorescein measurements exhibited water and GAG contents lower than that found in the rest of the specimens, see Figure 3a and Figure 4a. This may suggest that such samples were harvested from a cartilaginous region presenting some extent of tissue degeneration which was not detectable via visual inspection.
In summary, this study presents a characterization of diffusive transport of a wide range of molecular solutes in the cartilage of the human femur and tibia, and its relationship with tissue composition. It was found that diffusivity is inversely related to solutes molecular weight and hydrodynamic radii. Specifically, diffusion coefficients followed a relationship similar to Stokes-Einstein. Tissue water content did not significantly affect diffusivity. In contrast, significant correlations were found among diffusivities of large molecules and GAG content. These findings are crucial for better understanding of transport properties in cartilaginous tissues, as well as for the future development of numerical models to be used for describing tissue homeostasis and testing treatments for OA.
Acknowledgments
The project described was supported by Grant Number 1R01AR073222 from the NIH (NIAMS). The authors wish to thank the Ultramicroscopy Center at the University of Miami Miller School of Medicine for use of the confocal microscope for this study, Dr. Loren Latta and Abeer Albarghouthi for their assistance in tissue harvesting.
REFERENCES
- 1.Murphy L, Helmick CG. The impact of osteoarthritis in the United States: a population-health perspective. AJN The American Journal of Nursing 2012; 112: S13–S19. [DOI] [PubMed] [Google Scholar]
- 2.Felson DT, Neogi T. Osteoarthritis: is it a disease of cartilage or of bone? Arthritis & Rheumatism: Official Journal of the American College of Rheumatology 2004; 50: 341–344. [DOI] [PubMed] [Google Scholar]
- 3.Bajpayee AG, Grodzinsky AJ. Cartilage-targeting drug delivery: can electrostatic interactions help? Nature Reviews Rheumatology 2017; 13: 183–193. [DOI] [PubMed] [Google Scholar]
- 4.Evans CH, Kraus VB, Setton LA. Progress in intra-articular therapy. Nature Reviews Rheumatology 2014; 10: 11–12. [DOI] [PMC free article] [PubMed] [Google Scholar]
- 5.DiDomenico CD, Lintz M, Bonassar LJ. Molecular transport in articular cartilage—what have we learned from the past 50 years? Nature Reviews Rheumatology 2018; 14: 393–403. [DOI] [PubMed] [Google Scholar]
- 6.Poole AR, Kojima T, Yasuda T, Mwale F, Kobayashi M, Laverty S. Composition and structure of articular cartilage: a template for tissue repair. Clinical Orthopaedics and Related Research 2001; 391: S26–S33. [DOI] [PubMed] [Google Scholar]
- 7.Mow VC, Holmes MH, Lai WM. Fluid transport and mechanical properties of articular cartilage: a review. Journal of Biomechanics 1984; 17: 377–394. [DOI] [PubMed] [Google Scholar]
- 8.Bajpayee AG, Scheu M, Grodzinsky AJ, Porter RM. A rabbit model demonstrates the influence of cartilage thickness on intra‐articular drug delivery and retention within cartilage. Journal of Orthopaedic Research 2015; 33: 660–667. [DOI] [PubMed] [Google Scholar]
- 9.Kokkonen HT, Mäkelä J, Kulmala KAM, Rieppo L, Jurvelin JS, Tiitu V, et al. Computed tomography detects changes in contrast agent diffusion after collagen cross-linking typical to natural aging of articular cartilage. Osteoarthritis and Cartilage 2011; 19: 1190–1198. [DOI] [PubMed] [Google Scholar]
- 10.Leddy HA, Guilak F. Site-specific effects of compression on macromolecular diffusion in articular cartilage. Biophysical journal 2008; 95: 4890–4895. [DOI] [PMC free article] [PubMed] [Google Scholar]
- 11.Maroudas A Biophysical chemistry of cartilaginous tissues with special reference to solute and fluid transport. Biorheology 1975; 12: 233–248. [DOI] [PubMed] [Google Scholar]
- 12.Urban JPG, Holm S, Maroudas A. Diffusion of small solutes into the intervertebral disc: as in vitro study. Biorheology 1978; 15: 203–223. [DOI] [PubMed] [Google Scholar]
- 13.Urban JP, Holm S, Maroudas A, Nachemson A. Nutrition of the intervertebral disc: effect of fluid flow on solute transport. Clinical Orthopaedic and Related Research 1982; 170: 296–302. [PubMed] [Google Scholar]
- 14.Bonassar LJ, Grodzinsky AJ, Frank EH, Davila SG, Bhaktav NR, Trippel SB. The effect of dynamic compression on the response of articular cartilage to insulin‐like growth factor‐I. Journal of Orthopaedic Research 2001; 19: 11–17. [DOI] [PubMed] [Google Scholar]
- 15.Garcia AM, Frank EH, Grimshaw PE, Grodzinsky AJ. Contributions of fluid convection and electrical migration to transport in cartilage: relevance to loading. Archives of Biochemistry and Biophysics 1996; 333: 317–325. [DOI] [PubMed] [Google Scholar]
- 16.Mauck RL, Hung CT, Ateshian GA. Modeling of neutral solute transport in a dynamically loaded porous permeable gel: implications for articular cartilage biosynthesis and tissue engineering. Journal of Biomechanical Engineering 2003; 125: 602–614. [DOI] [PMC free article] [PubMed] [Google Scholar]
- 17.O’Hara BP, Urban JP, Maroudas A. Influence of cyclic loading on the nutrition of articular cartilage. Annals of Rheumatic Diseases 1990; 49: 536–539. [DOI] [PMC free article] [PubMed] [Google Scholar]
- 18.Quinn TM, Studer C, Grodzinsky AJ, Meister JJ. Preservation and analysis of nonequilibrium solute concentration distributions within mechanically compressed cartilage explants. Journal of Biochemical and Biophysical Methods 2002; 52: 83–95. [DOI] [PubMed] [Google Scholar]
- 19.DiDomenico CD, Bonassar LJ. How can 50 years of solute transport data in articular cartilage inform the design of arthritis therapeutics? Osteoarthritis and Cartilage 2018; 26: 1438–1446. [DOI] [PubMed] [Google Scholar]
- 20.Jackson AR, Gu WY. Transport properties of cartilaginous tissues. Current Rheumatology Reviews 2009; 5: 40–50. [DOI] [PMC free article] [PubMed] [Google Scholar]
- 21.Travascio F, Gu WY. Anisotropic diffusive transport in annulus fibrosus: experimental determination of the diffusion tensor by FRAP technique. Annals of biomedical engineering 2007; 35: 1739–1748. [DOI] [PMC free article] [PubMed] [Google Scholar]
- 22.Travascio F, Zhao W, Gu WY. Characterization of anisotropic diffusion tensor of solute in tissue by video-FRAP imaging technique. Annals of biomedical engineering 2009; 37: 816. [DOI] [PMC free article] [PubMed] [Google Scholar]
- 23.Travascio F, Gu WY. Simultaneous measurement of anisotropic solute diffusivity and binding reaction rates in biological tissues by FRAP. Annals of biomedical engineering 2011; 39: 53–65. [DOI] [PMC free article] [PubMed] [Google Scholar]
- 24.Slattery C, Kweon CY. Classifications in Brief: Outerbridge Classification of Chondral Lesions. Clinical Orthopaedic and Related Research 2018; 476: 2101–2104. [DOI] [PMC free article] [PubMed] [Google Scholar]
- 25.Hunziker EB. Articular cartilage structure in human and experimental animals. In: Articular cartilage and osteoarthritis. New York: Raven Press; 1992:183–199. [Google Scholar]
- 26.Travascio F, Jackson AR, Brown MD, Gu WY. Relationship between solute transport properties and tissue morphology in human annulus fibrosus. Journal of Orthopaedic Research 2009; 27: 1625–1630. [DOI] [PMC free article] [PubMed] [Google Scholar]
- 27.Tsay TT, Jacobson KA. Spatial Fourier analysis of video photobleaching measurements. Principles and optimization. Biophysical Journal 1991; 60: 360–368. [DOI] [PMC free article] [PubMed] [Google Scholar]
- 28.Burton-Wurster N, Liu W, Matthews GL, Lust G, Roughley PJ, Glant TT, et al. TGF beta 1 and biglycan, decorin, and fibromodulin metabolism in canine cartilage. Osteoarthritis and Cartilage 2003; 11: 167–176. [DOI] [PubMed] [Google Scholar]
- 29.Maroudas A Distribution and diffusion of solutes in articular cartilage. Biophysical journal 1970; 10: 365–379. [DOI] [PMC free article] [PubMed] [Google Scholar]
- 30.Shi C, Wright GJ, Ex-Lubeskie CL, Bradshaw AD, Yao H. Relationship between anisotropic diffusion properties and tissue morphology in porcine TMJ disc. Osteoarthritis and cartilage 2013; 21: 625–633. [DOI] [PMC free article] [PubMed] [Google Scholar]
- 31.Travascio F, Devaux F, Volz M, Jackson AR. Molecular and Macromolecular diffusion in human meniscus: Relationships with tissue structure and composition. Osteoarthritis and Cartilage 2020. [DOI] [PMC free article] [PubMed] [Google Scholar]
- 32.Quinn TM, Kocian P, Meister JJ. Static compression is associated with decreased diffusivity of dextrans in cartilage explants. Archives of Biochemistry and Biophysics 2000; 384: 327–334. [DOI] [PubMed] [Google Scholar]
- 33.Leddy HA, Guilak F. Site-specific molecular diffusion in articular cartilage measured using fluorescence recovery after photobleaching. Annals of Biomedical Engineering 2003; 31: 753–760. [DOI] [PubMed] [Google Scholar]
- 34.Schneiderman R, Snir E, Popper O, Hiss J, Stein H, Maroudas A. Insulin-like growth factor-I and its complexes in normal human articular cartilage: studies of partition and diffusion. Archives of Biochemistry and Biophysics 1995; 324: 159–172. [DOI] [PubMed] [Google Scholar]
- 35.Torzilli PA, Arduino JM, Gregory JD, Bansal M. Effect of proteoglycan removal on solute mobility in articular cartilage. Journal of Biomechanics 1997; 30: 895–902. [DOI] [PubMed] [Google Scholar]
- 36.Bajpayee AG, Wong CR, Bawendi MG, Frank EH, Grodzinsky AJ. Avidin as a model for charge driven transport into cartilage and drug delivery for treating early stage post-traumatic osteoarthritis. Biomaterials 2014; 35: 538–549. [DOI] [PMC free article] [PubMed] [Google Scholar]
- 37.Fetter NL, Leddy HA, Guilak F, Nunley JA. Composition and transport properties of human ankle and knee cartilage. Journal of Orthopaedic Research 2006; 24: 211–219. [DOI] [PubMed] [Google Scholar]
- 38.De Gennes PG. Scaling concepts in polymer physics, Cornell University Press; 1979. [Google Scholar]
- 39.Doi M, Edwards SF. The theory of polymer dynamics. Volume 73, Oxford University Press; 1988. [Google Scholar]
- 40.Amsden B Solute diffusion within hydrogels. Mechanisms and models. Macromolecules 1998; 31: 8382–8395. [Google Scholar]
- 41.Bajpayee AG, Scheu M, Grodzinsky AJ, Porter RM. Electrostatic interactions enable rapid penetration, enhanced uptake and retention of intra‐articular injected avidin in rat knee joints. Journal of Orthopaedic Research 2014; 32: 1044–1051. [DOI] [PubMed] [Google Scholar]
- 42.Van Lent PLEM, Van den Berg WB, Van de Putte LBA, Van den Bersselaar L Electrical charge of a protein determines penetration and localization in hyaline articular cartilage. Rheumatology International 1988; 8: 145–152. [DOI] [PubMed] [Google Scholar]
- 43.Sterner B, Harms M, Wöll S, Weigandt M, Windbergs M, Lehr CM. The effect of polymer size and charge of molecules on permeation through synovial membrane and accumulation in hyaline articular cartilage. European Journal of Pharmaceutics and Biopharmaceutics 2016; 10: 126–136. [DOI] [PubMed] [Google Scholar]
- 44.Honkanen JTJ, Turunen MJ, Tiitu V, Jurvelin JS, Töyräs J. Transport of iodine is different in cartilage and meniscus. Annals of Biomedical Engineering 2016; 44: 2114–2122. [DOI] [PubMed] [Google Scholar]
- 45.Poole AR, Pidoux I, Reiner A, Rosenberg L. An immunoelectron microscope study of the organization of proteoglycan monomer, link protein, and collagen in the matrix of articular cartilage. The Journal of Cell Biology 1982; 96: 921–937. [DOI] [PMC free article] [PubMed] [Google Scholar]
- 46.Huch K Knee and ankle: human joints with different susceptibility to osteoarthritis reveal different cartilage cellularity and matrix synthesis in vitro. Archives of orthopaedic and trauma surgery 2001; 121: 301–306. [DOI] [PubMed] [Google Scholar]
- 47.Hunziker EB, Quinn TM, Häuselmann HJ. Quantitative structural organization of normal adult human articular cartilage. Osteoarthritis and Cartilage 2001; 10: 564–572. [DOI] [PubMed] [Google Scholar]
- 48.Quinn TM, Hunziker EB, Häuselmann HJ. Variation of cell and matrix morphologies in articular cartilage among locations in the adult human knee. Osteoarthritis and Cartilage 2005; 13: 672–678. [DOI] [PubMed] [Google Scholar]
- 49.Mustafa MB, Tipton DL, Barkley MD, Russo PS, Blum FD. Dye diffusion in isotropic and liquid-crystalline aqueous (hydroxypropyl) cellulose. Macromolecules 1993; 26: 370–378. [Google Scholar]
- 50.Yousefi R, Taheri B, Alavi P, Shahsavani MB, Asadi Z, Ghahramani M, et al. Aspirin-mediated acetylation induces structural alteration and aggregation of bovine pancreatic insulin. Journal of Biomolecular Structure and Dynamics 2016; 34: 362–375. [DOI] [PubMed] [Google Scholar]
- 51.Axelsson I Characterization of proteins and other macromolecules by agarose gel chromatography. Journal of Chromatography A 1978; 152: 21–32. [Google Scholar]
- 52.Sigma. Fluorescein Isorhiocyanate-Dextran. Product Information 1997: 1–3. [Google Scholar]


