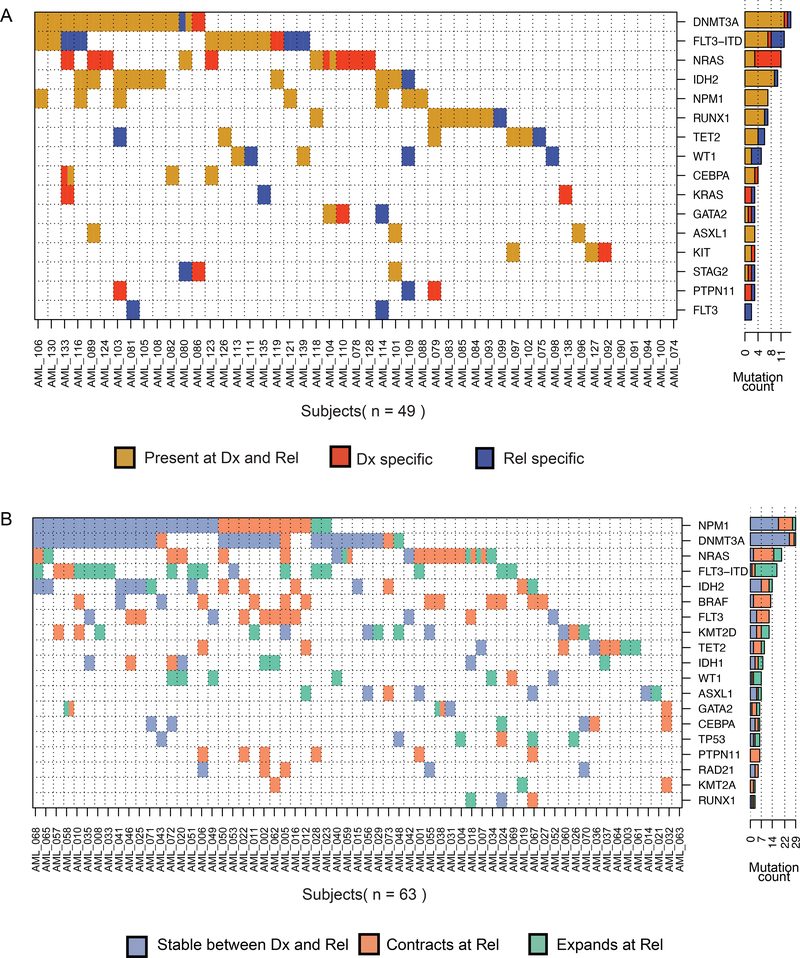
Fig. 1. Genomic landscape of relapsed AML.
A Comutation map for the whole exome sequencing cohort. Each row is a gene and each column a patient. Mutations were summarized by gene with the exception of FLT3-ITD independently plotted. A cell is colored if the corresponding gene is mutated in the corresponding patient. Every gene that is mutated in at least three patients is included. The bar plot shows the number of patients for which we detected a mutation in this gene. Colors: brown = events detected in both diagnosis and relapse, red = events only detected at diagnosis, and blue= events only detected at relapse. B Co-mutation map in the targeted panel cohort. Each cell is colored blue if the event is found stable between diagnosis and relapse, orange if it significantly contracts between diagnosis and relapse, and green if it significantly expands between diagnosis and relapse.

