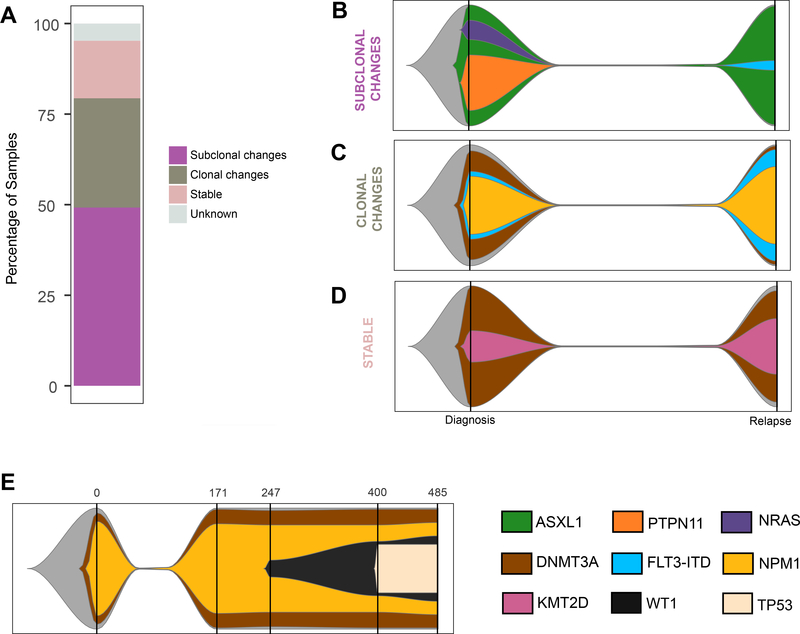
Fig. 2. Clonal evolution during disease progression (targeted panel sequencing cohort).
A Partition of the targeted panel sequencing cohort into each of the evolution patterns. Graphical representations of examples of each evolution pattern identified: subclonal (B: AML_001), clonal changes (C: AML_023), and stable changes (D: AML_029) using a fish plot representation. The clone with the highest VAF at a given time point was considered the parent clone. Subclones were defined based on criteria detailed in the Clonal evolution analysis subsection of “Materials and Methods”. The color key for gene contributions to the pattern is located in the lower right corner of the figure. E Graphical representation of AML_130 tumor evolution pattern. Each vertical bar indicates a tumor sample collection time point, with the time point (in days) along the x-axis.

