

Abstract
The vertebrate brain actively regulates incoming sensory information, effectively filtering input and focusing attention toward environmental stimuli that are most relevant to the animal's behavioral context or physiological state. Such centrifugal modulation has been shown to play an important role in processing in the retina and cochlea, but has received relatively little attention in olfaction. The terminal nerve, a cranial nerve that extends underneath the lamina propria surrounding the olfactory epithelium, displays anatomical and neurochemical characteristics that suggest that it modulates activity in the olfactory epithelium. Using immunocytochemical techniques, we demonstrate that neuropeptide Y (NPY) is abundantly present in the terminal nerve in the axolotl (Ambystoma mexicanum), an aquatic salamander. Because NPY plays an important role in regulating appetite and hunger in many vertebrates, we investigated the possibility that NPY modulates activity in the olfactory epithelium in relation to the animal's hunger level. We therefore characterized the full length NPY gene from axolotls to enable synthesis of authentic axolotl NPY for use in electrophysiological experiments. We find that axolotl NPY modulates olfactory epithelial responses evoked by L-glutamic acid, a food-related odorant, but only in hungry animals. Similarly, whole-cell patch-clamp recordings demonstrate that bath application of axolotl NPY enhances the magnitude of a tetrodotoxin-sensitive inward current, but only in hungry animals. These results suggest that expression or activity of NPY receptors in the olfactory epithelium may change with hunger level, and that terminal nerve-derived peptides modulate activity in the olfactory epithelium in response to an animal's changing behavioral and physiological circumstances.
Keywords: Ambystoma, electro-olfactogram, modulation, NPY, olfaction, patch clamp
In recent years, great strides have been made in elucidating the molecular and physiological basis of odorant transduction and processing (Firestein, 2001; Kauer, 2002; Laurent, 2002). Most such research focuses on mechanisms involving single receptor neurons, and the role of multicellular interactions, including those involved in neuromodulation, receives little attention. Nevertheless, a complete understanding of peripheral odorant processing must encompass the role of neuromodulators.
The terminal nerve is the most anterior vertebrate cranial nerve, extending between the nasal cavity and basal forebrain (Fig. 1). Although biologists have long known of its existence (Fritsch, 1878), its function has remained mysterious. Because of its anatomical projections, the nerve has been suggested to function as a chemosensory system (Rossi et al., 1972; Demski and Northcutt, 1983), although behavioral and electrophysiological studies have failed to demonstrate a sensory role (Bullock and Northcutt, 1984; Fujita et al., 1991; Wirsig-Wiechmann, 1993; White and Meredith, 1995). Instead, the terminal nerve probably serves a neuromodulatory function: its ganglion cells are rhythmically active (Oka, 1992, 2002), and the undifferentiated fibers contain acetylcholine and potentially neuromodulatory peptides (Wirsig-Wiechmann et al., 2002).
Figure 1.
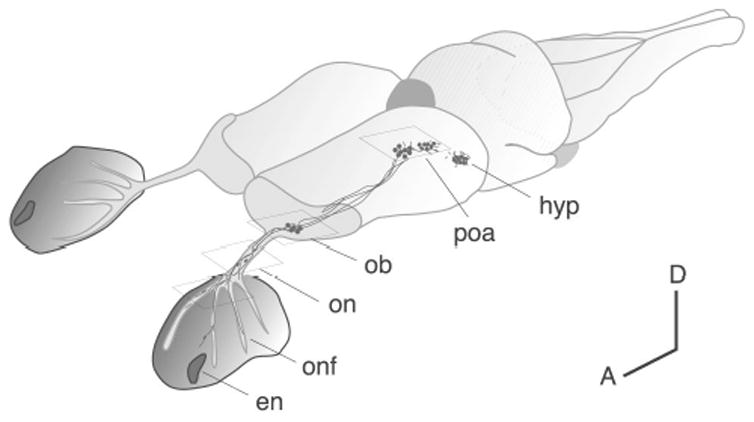
Location of the terminal nerve and NPY-immunoreactive neurons in the brain and around the nasal cavities of an axolotl (Ambystoma mexicanum). Anterior is down and to the left (A = anterior; D = dorsal). The fibers of the terminal nerve extend between the preoptic area and nasal cavities, wrapping around the outside of the nasal sacs, which are lined with olfactory epithelium. en = external nostril; hyp = hypothalamus; ob = olfactory bulb; onf = olfactory nerve fascicles; on = olfactory nerve; poa = preoptic area. Boxes indicate approximate locations of photomicrographs shown in Fig. 2.
One such peptide that has been positively identified is gonadotropin releasing hormone (GnRH) (Sherwood et al., 1986; King and Millar, 1992). In previous work, we have shown that GnRH modulates both odorant responses and voltage-activated currents in the olfactory epithelium in salamanders (Eisthen et al., 2000; Park and Eisthen, 2003). In teleost fishes, an additional branch of the nerve projects to the retina, and both GnRH and olfactory input modulate retinal activity (Walker and Stell, 1986; Maaswinkel and Li, 2003; Behrens and Wagner, 2004; Huang et al., 2005).
A second class of terminal nerve fibers contains a compound that has not been identified, but which displays immunoreactivity to neuropeptide Y (NPY) and to a smaller peptide, FMRFamide, that resembles the C-terminus of the NPY molecule (Chiba et al., 1994, 1996; Chiba, 2000, 2005). NPY-containing fibers are widely distributed in vertebrate brains, and the peptide plays an important role in the control of appetite and feeding (Kalra and Kalra, 2004; Levens et al., 2004).
We used immunocytochemical methods to demonstrate that the terminal nerve in an aquatic salamander, the axolotl (Ambystoma mexicanum), displays NPY-like immunoreactivity; control experiments indicate that the labeling obtained is not due to the presence of a FMRFamide-like compound. We then examined the possibility that NPY modulates activity in the olfactory epithelium. Because exogenous forms of NPY can produce nonphysiological responses when interacting with receptors, we sequenced the NPY gene in axolotls to allow synthesis of endogenous axolotl NPY for use in electrophysiological experiments. Using electro-olfactogram (EOG) recording techniques, we found that synthetic axolotl NPY enhances responses evoked by a feeding cue, L-glutamic acid, but only in hungry axolotls. In previous work, we found that GnRH modulates a tetrodotoxin (TTX)-sensitive inward current in salamander olfactory receptor neurons (Eisthen et al., 2000). Here, we report that synthetic axolotl NPY also modulates the magnitude of this current, but only in hungry animals.
Materials and Methods
Subjects
In all experiments, equal numbers of adult male and female axolotls (Ambystoma mexicanum) were used as subjects. Axolotls were obtained from the Indiana University Axolotl Colony and maintained at 20°C in Holtfreter's solution, which contains (in mM): 60 NaCl, 2.4 NaHCO3, 0.67 KCl, 0.81 MgSO4, and 0.68 CaCl2 (pH 7.5 – 7.6).
Except where noted, animals were fed commercial salmon pellets (Rangen, Buhl, ID) twice each week. All procedures were conducted under the supervision of the institutional animal care and use committees from Michigan State University and Queen's University Belfast, in accordance with guidelines established by the US Public Health Service and the Animals (Scientific Procedures) Act, UK.
Immunocytochemistry
Because the terminal nerve consists of bipolar neurons with long, tapering fibers, we chose to use immunocytochemical methods to visualize the full extent of NPY-containing cells and fibers in the brain and olfactory epithelium. In addition, because the deduced sequence of NPY in axolotls is largely identical to those found in other vertebrates, we were able to use a commercially-available antiserum generated against porcine NPY to examine the distribution of the peptide in the central nervous system.
Four male and four female axolotls were transcardially perfused with phosphate buffered saline followed by 4% paraformaldehyde in the same buffer. Brains with olfactory nerves and nasal cavities attached were dissected out and postfixed for 96 h at 4ºC. After cryoprotection with 5% sucrose for 12 h followed by 30% sucrose for 24 h, horizontal sections (60 lm) were cut, mounted on slides, incubated in primary antiserum at a 1:2000 dilution (anti-porcine NPY, shown to cross-react with the C-terminus [13–36 and 18–36] of NPY in dotblots; N-9528, Sigma Chemical, Poole, UK) for 24 h, washed, and then incubated in secondary antibody (FITC-labeled swine anti-rabbit; 1:100; Sigma Chemical, Poole, UK) for 24 h. For clarity, some sections were counterstained with Hoechst 33258, a fluorescent Nissl stain (Sigma Chemical, St. Louis, MO). Sections were viewed and photographed using a Leica AOBS confocal scanning laser microscope. Controls, all of which were performed on at least two of the eight specimens, included (1) omission of primary antibody, (2) preadsorption (12 h) of anti-NPY (1:2000) with synthetic axolotl NPY (250 ng/ml = 0.05 nM; American Peptide, Sunnyvale, CA), (3) preadsorption (12 h) of anti-NPY (1:2000) with synthetic GYIRFamide (250 ng/ml = 0.4 nM; American Peptide, Sunnyvale, CA) and, (4) in separate experiments, preadsorption (12 h) of anti-NPY (1:2000) with synthetic FMRFamide (4.95 μg/ml = 10 μM; Sigma Chemical, St. Louis, MO).
The primary antiserum was generated by conjugating porcine NPY to keyhole limpet hemocyanin (KLH), which can lead to artifactual staining in olfactory areas (Riddle and Oakley, 1992). We therefore compared labeling obtained with anti-NPY with that obtained using an anti-KLH antiserum (A150-104A; Bethyl Laboratories, Montgomery, TX) to ensure specificity of labeling. Anti-KLH produced labeling in peripheral structures, such as the Bowman's glands surrounding the olfactory epithelium, but not in neural tissue.
RNA extraction and standard PCR analysis
Poly A+ RNA was extracted from axolotl brain (62.5 mg) using Dynabeads mRNA DIRECT kit (Dynal Biotech, Wirral, UK) and converted to 5’ and 3’ RACE-ready cDNA (SMART RACE kit protocol, BD Biosciences, Oxford, UK). Gene specific primers (GSPs) and nested gene specific primers (nGSPs) were designed to the peptide-encoding region of the Typhlonectes natans NPY gene (Ebersole et al., 2001; see Table 1) and manufactured by Sigma-Genosys (UK). First strand cDNA was used in an initial PCR with a sense primer corresponding to the amino acid sequence PSKPDNP (TN-NPY-S1) and an antisense primer corresponding to the amino acid sequence LITRQRY (TN-NPY-A1) of T. natans NPY. Products were re-amplified with nested sense and antisense primers designed to the internal sequences NPGEDA (TN-NPY-S2) and RHYINLI (TN-NPY-A2), respectively. Components of each 50 μl primary PCR reaction were: 5 μl 10x PCR buffer (Applied Biosystems, Warrington, UK), 6 μl MgCl2 (25 mM; Applied Biosystems, Warrington, UK), 1 μl dNTP mix (10 mM; Promega, Southampton, UK), 2.5 μl cDNA, 1 μl sense GSP (20 μM), 1 μl antisense GSP (20 μM), 0.25 μl AmpliTaq Gold DNA polymerase (5 U/μl; Applied Biosystems, Warrington, UK), ddH2O to 50 μl. Secondary nested reactions were identical except that the template consisted of 2 μl of the primary reaction (neat) and sense and antisense nGSPs were used. Thermal cycling conditions for standard PCR reactions were as follows: initial denaturation and “hot start” at 94°C for 7 min, 40 cycles of 94°C for 1 min, 45°C for 1 min and 72°C for 1 min followed by a final extension step of 72°C for 7 min.
Table 1.
PCR primers
| Oligonucleotide Code | Nucleotide Sequence (5’–3’) |
|---|---|
| 1. TN-NPY-S1 | CATCCAAACCGGACAATCC |
| 2. TN-NPY-S2 | AATCCTGGAGAGGACGCG |
| 3. TN-NPY-A1 | ATATCTCTGTCTTGTGATGAG |
| 4. TN-NPY-A2 | GATGAGATTGATGTAATGCC |
| 5. AM-NPY-RS1 | CTGCGGAGGACATGGCCAAATAC |
| 6. AM-NPY-RS2 | GGCCAAATACTACTCGGCACTGAG |
| 7. AM-NPY-RS3 | ACTCGGCACTGAGGCATTACATC |
| 8. AM-NPY-RA1 | TCAGTGCCGAGTAGTATTTGGCC |
| 9. AM-NPY-RA2 | AGTATTTGGCCATGTCCTCCGCAG |
| 10. AM-NPY-RA3 | TCCTCCGCAGGCGCGTCCTTCT |
Oligonucleotide sequences designed against Typhlonectes natans NPY-encoding gene (1–4) were used in standard PCR, and those against Ambystoma mexicanum NPY-encoding gene fragments (5–10) were used in 5’ and 3’ RACE.
Rapid amplification of cDNA ends (RACE)
First round 3’ and 5’ RACE reactions were performed using the manufacturer's Universal Primer Mix (UPM; BD Biosciences, Oxford, UK) and sense (AM-NPY-RS1) or antisense (AM-NPY-AS1) GSPs. Re-amplification was performed using nGSPs [sense (AM-NPY-RS2 or AM-NPY-RS3) / antisense (AM-NPY-RA2 or AM-NPY-RA3); see Table 1] and nested UPM. Components of each 50 μl primary RACE reaction were: 5 μl 10x PCR buffer, 6 μl MgCl2 (25 mM), 1 μl dNTP mix (10 mM), 2.5 μl RACE-ready 5’ or 3’ cDNA, 5 μl 10x UPM, anchor primer, 1 μl GSP (20 μM), 0.25 μl AmpliTaq Gold DNA polymerase (5 U/μl), ddH2O to 50 μl. Secondary nested reactions had identical components to primary reactions, except that the template consisted of 5 μl of the primary reaction (1:50 dilution in Tricine EDTA buffer) and 10x UPM was replaced by 1 μl nested UPM (nUPM). The cycle profile for all RACE reactions was as follows: 1 cycle of 94°C for 7 min, 40 cycles of 94°C for 1 min, 60°C for 1 min, and 72°C for 2 min followed by 1 cycle of 72°C for 7 min.
Cloning and sequence analysis
Discrete bands from standard PCR and RACE reactions were gel purified using a Qiaquick gel extraction kit (Qiagen, Crawley, UK) and cloned using TOPO TA cloning kit (Invitrogen, Paisley, UK). Plasmid DNA was extracted using a miniprep kit (Sigma Chemical, St. Louis, MO) and sequences were confirmed using M13 forward and reverse primers using Applied Biosystems Big-Dye version 3.1 chemistry on an Applied Biosystems model 3730 automated capillary DNA sequencer. At least three independently derived clones were sequenced for each PCR reaction.
Electro-olfactogram (EOG) recordings
We examined the effects of synthetic axolotl NPY on odorant responses in the olfactory epithelium. NPY is involved in many activities in the central nervous system, but most attention has focused on its role in regulating appetite and hunger (Michel, 2004). We therefore investigated the possibility that modulatory effects of NPY on odorant responses may depend on the nutritional state of the animal. In this experiment, we tested axolotls that had been fed either 1 or 10 days prior to testing ("well-fed" and "hungry", respectively). As an odorant, we used L-glutamic acid, because amino acid odorants serve as feeding cues for aquatic vertebrates (Sorensen and Caprio, 1998) and because we had found in a previous experiment that bath application of GnRH decreases the magnitude of odorant responses evoked by amino acid odorants, including L-glutamic acid (Park and Eisthen, 2003). Responses evoked by L-glutamic acid were measured using electro-olfactogram (EOG) recordings, a technique that records odorant-stimulated receptor potentials from groups of neurons in patches of olfactory epithelium (Scott and Scott-Johnson, 2002).
EOG recordings were conducted using procedures that we have used successfully in the past to record odorant responses from axolotls (Park and Eisthen, 2003; Park et al., 2003, 2004). Briefly, axolotls were anesthetized with 0.1% MS 222 (pH 7.4) in Holtfreter’s solution and immobilized with an intramuscular injection of gallamine triethiodide (Flaxedil; Sigma Chemical, St. Louis, MO). The olfactory epithelium was exposed by removing the tissue dorsal to the nasal capsule. To record potentials, a glass capillary electrode (tip, 75 – 200 μm) was filled with 1% agar in 1 M KCl bridged to a chloride-coated silver wire and placed near the olfactory epithelium in the anterior medial portion of the nasal cavity. A reference electrode was placed under the skin nearby. Electrodes were coupled to a differential amplifier (DP-304, Warner Instruments, Hamden, CT). Signals were digitized via a Digidata 1322A interface (Molecular Devices, Sunnyvale, CA), and then displayed, recorded, and analyzed using AxoGraph software (v. 4.9; Molecular Devices, Sunnyvale, CA).
During each trial, the olfactory epithelium was bathed with a continuous flow (3 – 4 ml/min) of amphibian Ringer's solution containing (in mM) 111.2 NaCl, 5.6 KCl, and 1.7 CaCl2 (pH 7.2-7.5).The odorant solution arrived at the epithelium after approximately 20 sec and remained on the epithelium approximately 2 – 3 sec.
The odorant, 100 μl of 1 mM L-glutamic acid, was delivered with an inter-stimulus interval of 4 min, which did not produce any sign of odorant adaptation. Once 4 consistent EOG responses had been recorded, plain Ringer's solution ("control") or 1 μM synthetic axolotl NPY (American Peptide, Sunnyvale, CA) in Ringer's solution ("NPY") was delivered to the olfactory epithelium continuously for 16 min, during which 4 EOG responses were recorded. During the subsequent wash period, we recorded another 4 EOG responses while bathing the olfactory epithelium in running Ringer's solution.
Twenty-four animals were used in these experiments, and two feeding regimes were implemented. Animals in the "well-fed" group were fed every other day and were used in the experiment 1 day after being fed; animals in the "hungry" group were fed every third day and tested 10 days after their last feeding. Cohorts of four animals were matched for sex and body mass and then assigned randomly to one of four groups: hungry-NPY, hungry-control, well-fed-NPY, and well-fed-control. Each group consisted of 3 males and 3 females.
Data were expressed as a percent of the baseline response for graphing and analysis. To simplify analysis, the largest response within each testing period for each animal was selected for analysis. Statistical analyses were performed using the JMP software package (v. 5.0, SAS Institute, Cary, NC). Before conducting analyses of variance, Levene's test was used to assess homogeneity of variances among groups being compared; because the results were not significant (all P's > 0.2), untransformed data were analyzed. In general, repeated-measures analysis of variance (ANOVA) tests were used for comparisons. All tests were two-tailed.
Patch-clamp recordings
To examine the effects of NPY on the excitability of olfactory receptor neurons, whole-cell recordings of voltage-activated currents were made from individual neurons in epithelial slices, as described in Eisthen et al. (2000). Briefly, animals were decapitated, the nasal sac dissected out of its capsule, slit longitudinally, opened flat, and then attached to a support with cyanoacrylate glue. Slices 150 – 250 lm thick were cut with a Vibratome (Leica model VT S1000) and stored at 4°C up to 48 hrs, until use.
Slices were stored in amphibian physiological saline (APS) containing (in mM): 120 NaCl, 10 HEPES, 10–20 CaCl2, 5 glucose, 5 pyruvic acid, 2.5 KCl, and 1 MgCl2 (pH = 7.4). For some recordings, we did not use ionic substitutions in the intracellular solution; in these experiments, the recording pipette was filled with a solution containing (in mM): 105 K gluconate, 30 KCl, 10 HEPES, 5 ATP, 3 MgSO4, 1 EGTA, 0.5 GTP, and 0.5 CaCl2. Our preliminary experiments suggested that axolotl NPY strongly affected an inward current, so we chose to concentrate our efforts on characterizing this effect. In most experiments, then, CsCl was substituted for KCl to block large K+ currents. In addition, Ca2+-dependent K+ currents were blocked through the substitution of BaCl2 for CaCl2 in APS; in axolotl olfactory receptor neurons, the inward current carried by Ba2+ is slowly inactivating and readily distinguishable from the Na+ current. In such experiments, the intracellular solution contained (in mM): 135 CsCl, 10 HEPES, 5 ATP, 3 MgSO4, 1 EGTA, 0.5 GTP, and 0.085 CaCl2. Synthetic axolotl NPY dissolved in APS was used at concentrations ranging from 1 nM to 10 μM (see Table 2).
Table 2.
Responses of all cells examined
| hunger level | treatment | responders | nonresponders | uncategorizable | total cells |
|---|---|---|---|---|---|
| well-fed | 10 μM NPY | 0 | 1 | 0 | 1 |
| 5 μM NPY | 2 | 0 | 1 | 3 | |
| 1 μM NPY | 0 | 5 | 0 | 5 | |
| 100 nM NPY | 0 | 6 | 2 | 8 | |
| 10 nM NPY | 0 | 2 | 0 | 2 | |
| 5 nM NPY | 0 | 1 | 0 | 1 | |
| 1 nM NPY | 0 | 1 | 0 | 1 | |
| control | 2 | 9 | 0 | 11 | |
|
| |||||
| hungry | 1 μM NPY | 1 | 1 | 0 | 2 |
| 100 nM NPY | 7 | 11 | 0 | 18 | |
| control | 0 | 4 | 0 | 4 | |
|
| |||||
| total cells | 12 | 41 | 3 | 56 | |
Response of the inward current in olfactory receptor neurons from well-fed and hungry animals to different concentrations of synthetic axolotl NPY, as well as to a control solution (fast green). Significantly more neurons from hungry animals responded to application of NPY with an increase in the magnitude of the inward current, even though neurons from well-fed animals were exposed to higher concentrations of NPY. For categorization criteria, see Materials and Methods.
Epithelial slices were mounted in a recording chamber and viewed with a 40X water immersion objective on a Zeiss Axioskop 2 FS microscope. Patch electrodes of borosilicate glass (LE-16, Dagan Corp., Minneapolis, MN) were pulled on a Flaming-Brown micropipette puller (Sutter Instruments, Novato, CA) and coated with wax to reduce electrode capacitance; initial pipette resistance was generally 3–6 MΩ. All recordings were conducted at room temperature using an Axopatch 200B amplifier (Molecular Devices, Sunnyvale, CA) with a low-pass Bessel filter set at 5–10 kHz. Raw data were collected and leak current was subtracted before analysis using AxoGraph software (v. 4.9; Molecular Devices, Sunnyvale, CA).
For each recording, we followed a standard protocol to ensure that data collected from all cells could be subjected to statistical analysis. Specifically, once a seal of 1–4 GΩ was attained, the membrane under the electrode was ruptured and a holding potential of -60 mV was applied. We recorded responses to a series of 17.5-msec voltage pulses ranging from -100 mV to 100 mV in 10 mV steps, then initiated the flow of bath solution (APS) over the slice and recorded responses to the same set of pulses 1 min later. Recordings were made every 2.5 min in flowing bath until recording stabilized; for most cells, only two sets of recordings were made in flowing bath before NPY was applied. After the flow of NPY was initiated, recordings were made at 2.5-minute intervals for 15–20 min before the NPY was washed off with plain APS. Recordings were made at 2.5-minute intervals for 20-30 min during the wash period. In control recordings, APS containing fast green was substituted for NPY.
The axolotls used in this experiment were subjected to the same feeding regime described above; overall, data were collected from 24 cells from 6 hungry animals (3 male, 3 female) and 31 cells from 11 well-fed animals (7 male, 4 female). We included in our analyses only recordings for which we obtained at least 15 min of data in NPY or the control solution and 10 min of data in the wash, the measured series resistance did not vary by more than 10 MΩ, and the seal was at least 1 GΩ throughout the recording.
In a separate experiment, the identity of the inward current was examined through the application of 100 nM TTX (Sigma Chemical, St. Louis, MO) in the bath solution. For these recordings, we included 100 nM NPY in the TTX solution to ensure that the response obtained was due to the TTX and not simply to washing off the NPY solution. Only animals in the "hungry" condition were used for these recordings.
For most concentrations of NPY, the number of cells examined is too small for statistical analysis. However, many recordings were obtained from cells exposed to 100 nM NPY and these data were subjected to statistical analysis, performed using the JMP software package (v. 5.0, SAS Institute, Cary, NC). Before conducting analyses of variance, Levene's test was used to assess homogeneity of variances among groups being compared; because the results were not significant for the magnitude of the inward current, for the voltage sensitivity of the inward current, and for the analysis of rise time among cells classified as responders (F's ≤ 1.5, P's ≤ 0.25), untransformed data were used in these analyses. Because Levene's test indicated that the variances were not homogeneous for rise time data (F = 13.6, P = 0.0003), log-transformed data were used in this analysis (F = 1.16, P = 0.29). All statistical tests were two-tailed.
Results
The terminal nerve shows abundant NPY-like immunoreactivity
In salamanders, unlike most other jawed vertebrates, the cells of the terminal nerve do not form a discrete ganglion; rather, the ganglion cells are scattered in small clusters between the nasal cavity and anterior olfactory bulb (Wirsig and Getchell, 1986). We found that NPY-immunoreactive cells and fibers are present throughout the terminal nerve pathway in axolotls (Fig. 2): labeled cells were observed in fascicles of olfactory nerve fibers underneath the olfactory epithelium (Fig. 2A), in the olfactory nerve proper (Figs. 2B, C, and I), in the olfactory nerve layer on the surface of the olfactory bulb (Fig. 2J), in the ventral olfactory bulb (Fig. 2D), and in the anterior preoptic area (Figs. 2E and L). Additional labeled cells were observed beyond the pathway of the terminal nerve (Northcutt and Muske, 1994; Fiorentino et al., 2001) in the posterior preoptic area, hypothalamus, and infundibulum (Figs. 2E, L-N). No labeled cell bodies were observed in the mid- and hindbrain.
Figure 2.
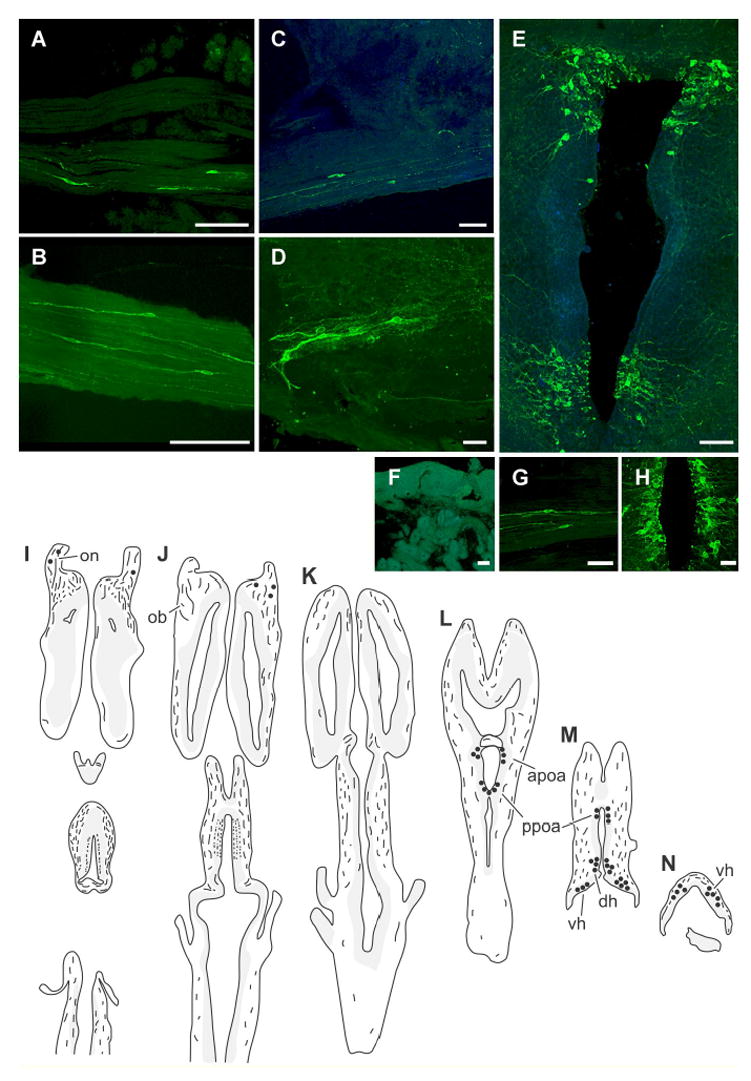
Distribution of NPY-like immunoreactivity in the brain and snout of adult axolotls. A-H, Confocal images of NPY-immunoreactive terminal nerve cell bodies and fibers (green); for clarity, some sections have been counterstained with Hoechst 33258, a fluorescent Nissl stain (blue). Anterior is toward the left in panels A-D and G, and toward the top in panels E and H-N; the lumen is toward the top in panel F. Scale bars = 100 μm. A, Olfactory nerve fascicles underneath the olfactory epithelium containing labeled terminal nerve cells. B, Labeled terminal nerve neurons inside the olfactory nerve. C, A cluster of labeled neurons in the ventral olfactory bulb. D, Labeled cells in the proximal portion of the olfactory nerve, adjacent to the olfactory bulb. E, Montage of three images illustrating labeled cells in the anterior and posterior preoptic area. F, No NPY-like immunoreactivity was observed in the olfactory epithelium. G-H, Images showing the distribution of NPY-immunoreactivity in control experiments. G, NPY-immunoreactive terminal nerve cells in olfactory nerve fascicles following preincubation of anti-NPY antiserum with GYIRFamide. H, Labeled cells in the posterior preoptic area following preincubation of anti-NPY antisersum with FMRFamide. I-N, Illustrations showing the distribution of labeled cells and fibers in horizontal sections (from dorsal, I, to ventral, N) through the brain of an adult axolotl. Shaded areas represent locations of large groups of neurons. Filled circles indicate regions in which labeled neurons were observed. apoa = preoptic area; dh = dorsal hypothalamus; ob = olfactory bulb; on = olfactory nerve; ppoa = posterior preoptic area; vh = ventral hypothalamus.
Peripherally, immunoreactive terminal nerve fibers could be traced within the olfactory nerve to the lamina propria of the olfactory epithelium, where they appeared to terminate. No labeled cells or fibers were observed in the olfactory epithelium (Fig. 2F). In the brain, fibers were densely labeled in the olfactory bulb and tectum (Figs. 2I, J). Labeled fibers were observed in the lateral portion of the dorsal telencephalon (Fig. 2J), and in the medial portion only more ventrally (Figs. 2K, L). Sparsely-labeled fibers were also observed in the medulla and tegmentum (Figs. 2J and K, respectively), and in the hippocampal, posterior, and cerebellar commissures. Some labeled fibers were present in the medial forebrain bundle, but were conspicuously absent from the lateral forebrain bundle. Fiber labeling was particularly dense in the neurohypophysis (not shown).
Immunostaining was not observed in control sections for which the primary antiserum was omitted. Importantly, labeling was not abolished after preadsorption with synthetic GYIRFamide (0.4 nM; Fig. 2G) or FMRFamide (10 μM; Fig. 2H) but was eliminated after preadsorption of the primary antiserum with synthetic axolotl NPY (0.05 nM). These data indicate that the labeling observed with the anti-NPY antisera is unlikely to be due to cross-reaction with a FMRFamide-like peptide (Chiba, 2000).
The sequence of the NPY gene in axolotls is similar to those of other amphibians
Using GSPs designed against the NPY-encoding region from T. natans (a caecilian), we amplified a 90 bp fragment from cDNA synthesized from axolotl mRNA. Subsequent 3’ and 5’ RACE resulted in the identification of 341 bp and 257 bp sequences respectively, facilitating full-length characterization of the axolotl NPY-encoding gene (amnpy; Genbank accession no.: AY660754). The axolotl NPY gene contains an open reading frame of 297 nucleotides encoding a propeptide of 98 amino acids. Also present are a 5’UTR of 133 bp and a 3’UTR of 181 bp. The 3’ UTR contains a poly-A tail and a polyadenylation signal. The putative open reading frame is marked by consensus start and stop sequences, as indicated in Figure 3A.
Figure 3.
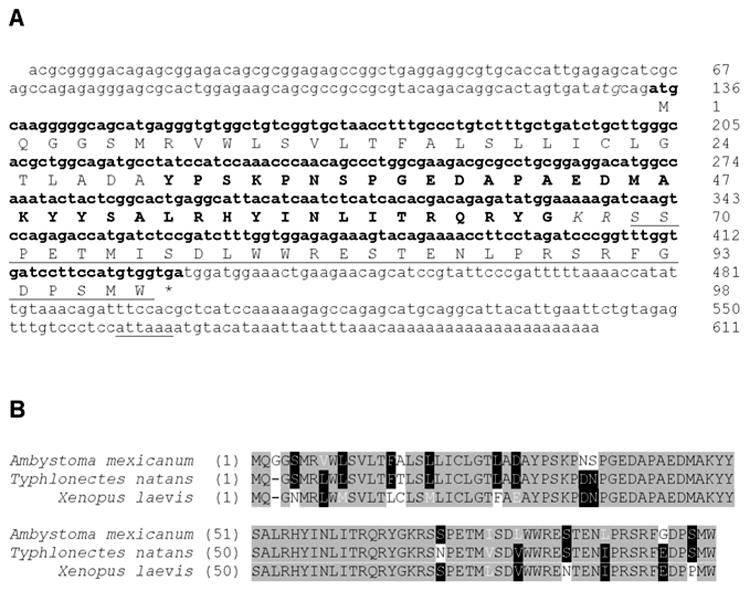
Sequence of the NPY encoding gene and propeptide sequence from axolotl (Ambystoma mexicanum). A, Nucleotide (lower case text) and amino acid (upper case text) sequences. The putative open reading frame is shown in bold text and the polyadenylation signal is underlined. Note an alternative atg codon (italics) positioned 3 nucleotides upstream of the putative open reading frame. Although both consensus start codons accommodate a signal peptide (Signal P 3.0; http://www.cbs.dtu.dk/services/SignalP/) that is subsequently cleaved between positions 29 (A) and 30 (Y), the second cleavage site results in a pre-pro-NPY that is more representative of other amphibian pre-pro NPY’s. Within the propeptide, note the mature NPY sequence (bold text), the dibasic (KR) cleavage site (italics) and the C-terminal extension (CPON) of NPY (underlined). The termination codon is marked by an asterisk. B, Amino acid alignments of axolotl NPY-encoding gene with the two amphibian NPY-encoding genes showing highest similarity. Black text on gray denotes identical residues, white text on black represents partially conserved residues, and similar residues appear as white text on gray.
The organization of amnpy conforms to all other vertebrate NPY genes in that it comprises a characteristic signal peptide, a distinct N-terminal processing site, a C-terminal glycyl residue, a dibasic processing site, and a C-terminal flanking peptide (CPON). The deduced 36-amino acid NPY primary sequence, YPSKPNSPGEDAPAEDMAKYYSALRHYINLITRQRY-NH2, is similar to all known amphibian NPYs (94.4% identity). Substitutions occur in positions 6 and 7, where the Asp-Asn common to frog and caecilian NPYs is replaced with Asn-Ser. In addition, several amino acid deviations were noted among amphibians in the sequence of the CPON. As illustrated in Figure 3B, the axolotl propeptide shares 87.8% identity with the NPY propeptide of T. natans (Ebersole et al., 2001), and 80.6% identity with the propeptide from Xenopus laevis (van Riel et al., 1993; Griffin et al., 1994).
NPY modulates responses evoked by L-glutamic acid in hungry animals
As illustrated in Figure 4, bath application of 1 μM NPY increased the magnitude of EOG responses elicited by L-glutamic acid in hungry animals but not in well-fed animals. Among hungry animals, NPY exposure resulted in an average 132% increase in EOG magnitude (SEM = 14.4%; n = 6) relative to baseline, and the magnitude of the EOG response returned to baseline within 8 min of the beginning of the wash period. We used a repeated-measures MANOVA to determine whether the application of NPY vs. the control solution had a significant effect independent of feeding condition, and to determine whether the manipulation of hunger level affected responses independent of the application of NPY. Neither effect was significant: the response magnitude did not differ significantly between NPY and control treatments (F = 0.21, P = 0.72), nor between hungry and well-fed animals (F = 0.77, P = 0.54). Importantly, however, the interaction between feeding condition and NPY/control treatment was statistically significant (F = 709.5, P = 0.024), indicating that the effect of NPY on the magnitude of the EOG response depends on the animal's hunger condition. Post-hoc tests indicate that the difference in the magnitude of the EOG response in the hungry-NPY group differs significantly from that in other groups during the treatment period (Student's t > 2.09, P < 0.05), but not during the wash period (Student's t < 1.72, P > 0.10).
Figure 4.

Synthetic axolotl NPY alters odorant responses elicited by L-glutamic acid. A, Bath application of NPY enhanced EOG responses elicited by L-glutamic acid in hungry animals, but not in well-fed animals. Although the magnitude of the response is greatly increased in the presence of NPY, it returns to baseline within 8 min of the NPY being washed off the olfactory epithelium. n = 6 per group. B, Sample EOG recordings from two axolotls that had not been fed for 10 days, shown at the same stages in the experiment indicated in A. Top: Ringer's solution (control) does not alter the magnitude of the EOG response evoked by 1 mM L-glutamic acid. Bottom: bath application of 1 μM NPY increases the magnitude of the EOG response evoked by L-glutamic acid.
Among control animals, EOG responses did not differ between hungry and well-fed animals (two-way repeated-measures ANOVA, F = 0.22, P = 0.72), and did not change over the course of the testing period (F = 0.21, P = 0.72); the interaction between these variables was also not significant (F = 1.37, P = 0.26). These results from the two control groups demonstrate that food deprivation alone does not alter EOG responses under our testing conditions, and that the change of solutions between testing periods does not significantly alter EOG responses.
In previous experiments, we found that axolotls that are deprived of food for 10 days spend more time searching for food, particularly in the presence of food odorants, than do well-fed animals (Eisthen and Park, 2005). Although in the present experiment the animals in the "hungry" condition appeared to be hungry, snapping at experimenters' fingers and disturbances in the water, these animals did not lose significant body mass relative to animals in the "well-fed" condition (Student's t = −1.39, P = 0.18). Nevertheless, we also analyzed the data by dividing the subjects into two groups: those that lost more than 5% of their initial mass during the course of the feeding regime (mean ± SEM = 9.9 ± 1.2% loss in body mass, n = 12), and those that maintained a fairly steady body mass (1.6 ± 0.8% loss, n = 12). Using these groupings, we found that the effect of applying NPY versus the control solution did not differ significantly between animals that lost mass and those that maintained their mass (repeated-measures MANOVA, P > 0.05 for all main effects and interactions). In addition, the absolute magnitude of the EOG response did not differ between control animals in the hungry and well-fed groups (two-way repeated-measures ANOVA, F = 0.02, P = 0.89). Similarly, the absolute magnitude of the EOG response did not differ among testing periods (F = 0.44, P = 0.69), and no interaction effect was observed (F = 0.36, P = 0.70). Thus, differences in responses to NPY between the hungry and well-fed groups are not attributable to changes in body mass.
NPY modulates a TTX-sensitive inward current in hungry animals
At the single-cell level, the most dramatic result of NPY application was an increase in the magnitude of a large, rapidly-inactivating voltage-activated inward current in a subset of neurons examined; the current partially recovered during the wash, as illustrated in Figure 5. Because the effect on the inward current was the first we observed in whole-cell recordings, subsequent recordings were made with CsCl intracellular solution in the recording pipette and BaCl2 in the bath solution to facilitate examination of this current.
Figure 5.
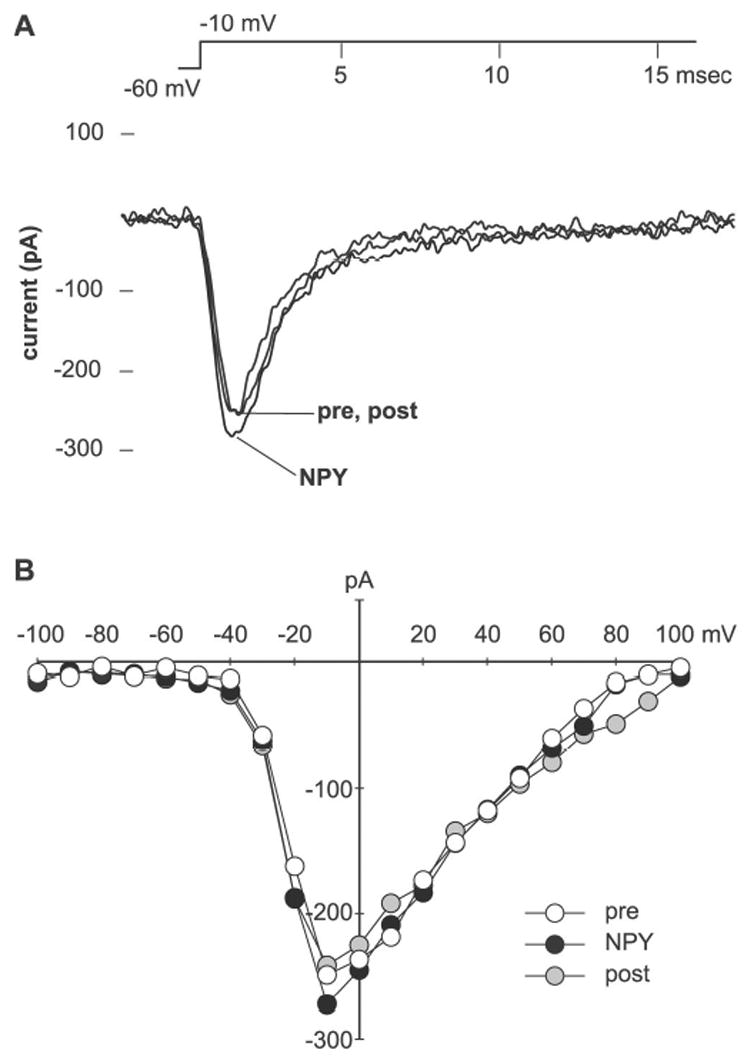
Whole-cell recordings from an olfactory receptor cell from a hungry animal, illustrating the effect on the inward current of bath application of 100 nM synthetic axolotl NPY in a cell classified as a responder. Outward currents have been blocked. Vhold = −60 mV. A, Inward currents elicited by a voltage pulse of -10 mV, showing the magnitude of the inward current before application of NPY (pre), after 7.5 min exposure to NPY (NPY), and after washing NPY off the slice for 7.5 min (post). B, Relationship between peak current and voltage for the same cell, at the same time points. Currents were elicited by applying a series of voltage pulses ranging from −100 mV to +100 mV, in 10 mV increments.
We did not observe any cases in which the magnitude of the inward current decreased in NPY and then increased during the wash period. Nevertheless, our observations indicated that not all cells responded to NPY with an increase in the inward current. We categorized cells as "responders" or "non-responders" based on the dynamics of inward current during the treatment period, in which the cells were exposed to NPY or the control (fast green) solution. Cells were classified as responders if the inward current elicited by a –10 mV voltage pulse was elevated above baseline, defined as the magnitude of the current recorded immediately before application of NPY or the control solution, by at least 5% for at least 5 consecutive readings (10 min) during the treatment period. Cells were classified as non-responders if the inward current was equal to or below baseline for at least 10 min during the treatment period.
Using these criteria, we were able to categorize 53 of 56 cells that were exposed to different concentrations of NPY or the control solution; in the remaining 3 cells, the inward current was variable. Overall, 10 of the 41 cells exposed to NPY (24%) responded with a sustained increase in the magnitude of the inward current. Interestingly, 8 of the 10 responders were from hungry animals, and the difference in probability of responding to NPY between hungry and well-fed animals was statistically significant (chi square = 7.15, P = 0.028). Within hungry animals, the probability that the inward current increased during treatment was greater in NPY than the control treatment (chi square = 3.63, P = 0.057). Within well-fed animals, this difference was not significant, even though we tested cells from well-fed animals with higher concentrations of NPY than were used with cells from hungry animals (chi square = 0.50, P = 0.48). In addition, 2 of the 9 control cells recorded from well-fed animals also met our criteria for classification as responders, suggesting that the magnitude of the inward current is subject to inherent variability. Details concerning the hunger level of the animal, concentration of NPY applied, and responses of all cells examined are provided in Table 2.
In recordings from hungry animals, we collected data from a large number of cells exposed to 100 nM NPY (n = 18). We used these data for quantitative analysis of the effects of NPY on olfactory receptor neurons. The recorded magnitude of the inward current varied considerably among cells; therefore, for statistical analysis and data display, we normalized all data to the magnitude of the inward current measured immediately before applying NPY to the slice. Figure 6 illustrates the time-course and magnitude of the response to NPY among cells categorized as responders and nonresponders, as well as controls.
Figure 6.
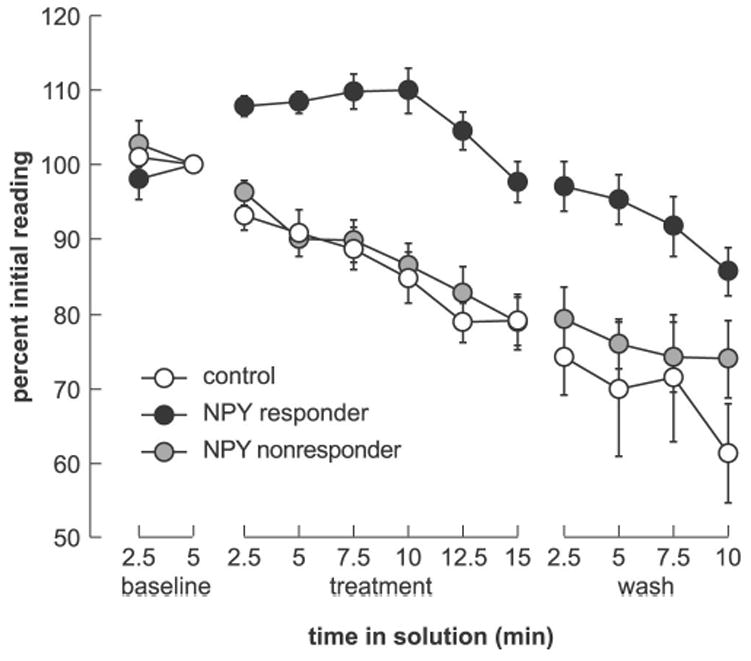
Change over time in the magnitude of the inward current of olfactory receptor neurons from hungry animals exposed to 100 nM synthetic axolotl NPY or a control solution (fast green). Data were normalized such that the magnitude of the inward current immediately before application of the test solution was designated 100%, and the magnitude of the current at other times is expressed as a percentage of the magnitude at this time point. "Baseline" refers to the initial recording period, "treatment" indicates the time at which NPY or the control solution was washed onto the slice, and "wash" indicates the period during which the solution was washed off. Means and standard errors are shown for cells exposed to the control solution (open circles; n = 4) or NPY (filled circles); the black circles indicate cells classified as "responders" (n = 7), and gray circles indicate "nonresponders" (n = 11). After 2.5 min in NPY, the magnitude of the inward current was significantly larger in cells responding to NPY than in control cells and nonresponders; the current decreased but did not recover during the 10 min wash period. All recordings were made with CsCl in the intracellular solution and BaCl2 in the extracellular solution.
The magnitude of the inward current differed significantly among the three groups of cells (two-way repeated-measures ANOVA, F = 113.4, P = 0.004) and between the treatment and wash periods (F = 112.1, P = 0.009); no significant interaction was observed (F = 0.669, P = 0.51). In general, the inward current began to increase in magnitude almost immediately after NPY was first washed onto the slice. The difference between responders and other cells was statistically significant after 2.5 min in NPY (Student's t's ≥ 4.31, P's < 0.001), but the magnitude of the current in nonresponders and controls did not differ (Student's t = 0.99, P = 0.34). The inward current remained elevated throughout the period of NPY exposure, and did not recover completely in the wash. The difference in magnitude between the responders and other groups was still significant toward the end of the wash period (at 7.5 min in wash, responders vs. nonresponders and controls, t's ≥.19, P ≤ 0.05; at 10 min in wash, responders vs. nonresponders, Student's t = 1.73, P = 0.10, and responders vs. controls, Student's t = 3.77, P = 0.004). As reflected in Figure 6, for most cells classified as responders, the inward current reached its maximum after approximately 10 min of NPY exposure, and began to decline somewhat before the wash period began. Among responsive cells, the inward current was approximately 10% larger than baseline after 10 min of exposure to NPY (mean = 9.96%, SEM = 3.04); at this same time point, the inward current had declined an average of 15.1% (SEM = 3.46) in cells exposed to the control solution.
The 18 neurons from hungry animals that were exposed to 100 nM were derived from 6 animals, detailed in Table 3. Seven of these cells (38.9%) responded to NPY application with an increase in the inward current. The difference between cells that responded to NPY and those that did not is not attributable to the sex of the animal from which the neurons were derived (Pearson's chi square = 0.23, P = 0.63). In addition, the probability that a cell responded to NPY did not differ significantly among individuals (chi square = 2.92, P = 0.71). Thus, we found no evidence that the difference in probability of a neuron responding to NPY varies among individuals; rather, some neurons within an individual respond to NPY, and some do not.
Table 3.
Responses in cells from hungry animals
| animal number | sex | responders | nonresponders |
|---|---|---|---|
| AX533 | F | 2 | 1 |
| AX535 | M | 1 | 2 |
| AX538 | F | 1 | 3 |
| AX543 | M | 2 | 2 |
| AX544 | M | 0 | 2 |
| AX547 | F | 1 | 1 |
Responses to 100 nM NPY in olfactory receptor neurons from hungry animals only. The probability of a cell responding does not appear to be related to the sex of the animal; in addition, the probability of responding does not vary among animals. For categorization criteria, see Materials and Methods.
Although NPY clearly altered the magnitude of the inward current, it did not alter other aspects of the current. A within-subjects ANOVA indicates that although the voltage sensitivity of the peak of the inward current differed significantly among cells (F = 25.4, P < 0.0001), it did not change among the baseline, treatment, and wash recordings (F = 2.32, P = 0.14); the interaction between these variables was also not significant (F = 1.21, P = 0.29). We also examined the possible effect of NPY application on the rise time for the inward current, defined as the time required for the inward current to increase from 10 to 90% of its maximal level. Although we measured the rise time for both the peak of the inward current for each cell as well as for the inward current elicited by a –10 mV voltage pulse, we were unable to find any statistically significant effect of NPY application. For example, a repeated-measures two-way ANOVA indicated that the rise time of the current elicited by a –10 mV voltage pulse did not differ between NPY-treated and control cells (F = 7.53, P = 0.094); the rise time also did not vary across the baseline, treatment, and wash recordings (F = 0.14, P = 0.88), and the interaction between these two variables was not significant (F = 1.49, P = 0.23). Even within the cells classified as responders, a repeated-measures one-way ANOVA indicated no difference across the baseline, treatment, and wash recordings (F = 1.45, P = 0.24).
The voltage-activated inward current that increased in the presence of NPY was large and rapidly-inactivating, resembling a sodium current. To further characterize this current, we used TTX in some recordings, as illustrated in Figure 7. For this experiment, we followed the standard recording protocol described above, with CsCl-containing intracellular solution in the recording pipette and BaCl2 rather than CaCl2 in the bath solution. Three hungry individuals were used, and of the 9 cells to which NPY was applied, 3 cells met our criteria for being classified as responders. In all 3 cells, the inward current decreased significantly or was abolished within 2-5 min of application of the TTX-NPY. The inward current recovered to its baseline level within approximately 15 min during the wash period. These data suggest that the inward current that is affected by application of NPY is the TTX-sensitive sodium current, which in olfactory receptor neurons is also modulated by the application of GnRH (Eisthen et al., 2000).
Figure 7.

Whole-cell recordings from an olfactory receptor cell, illustrating the effect of tetrodotoxin (TTX) on the inward current in a cell that responds to NPY. A, Currents elicited by stepping from a holding potential of -60 mV to a series of voltage pulses ranging from −100 mV to +100 mV, in 10 mV increments. These currents were recorded in barium-APS, 3 min before NPY was applied to the cell. B, Currents elicited after 5 min exposure to a bath solution containing 100 nM NPY. The peak magnitude of the inward current is approximately 12% larger than in A. C, Currents elicited after 5 min exposure to 100 nM NPY + 100 nM TTX. Note that the large, rapidly-inactivating, voltage-activated inward current that is probably carried by sodium has been blocked; the inward current is approximately 25% of its initial magnitude. D, Currents elicited after 12.5 min of washing in barium-APS. The inward current has returned to 97% of its initial magnitude.
Discussion
NPY-immunoreactive fibers are extensively distributed throughout the brain in axolotls (Fig. 2). However, labeled cell bodies were found only in the terminal nerve pathway, hypothalamus, and infundibulum, a more restricted distribution than has been described in other amphibians, including another salamander species, Triturus cristatus (Danger et al., 1990; Tuinhof et al., 1994; Perroteau et al., 1988; Ebersole et al., 2001). In the preoptic area and hypothalamus, many immunoreactive cells had processes that extend to the ventricular surface (Fig. 2E), suggesting that in axolotls NPY may be released into the ventricles, as is GnRH. The presence of NPY in the olfactory epithelium proper varies across species, as NPY and NPY-like immunoreactivity have been observed in the olfactory epithelium of zebrafish and mice (Hansel et al., 2001; Mathieu et al., 2002), but not in gars (Chiba, 2005) nor, in this study, in axolotls.
Clearly, the amino acid sequence of NPY has been highly conserved during the evolution of vertebrates. The deduced axolotl NPY sequence conforms with this extraordinary sequence conservation in that it displays profound similarity (94.4%) to isolated and/or deduced sequences from other amphibians including the frogs Rana ridibunda (Chartrel et al., 1991), Rana temporaria (McKay et al., 1992), and X. laevis (Griffin et al., 1994), and the caecilian T. natans (Ebersole et al., 2001). In addition, putative axolotl NPY possesses conserved prolines at positions 2, 5, and 8 and tyrosines at positions 21 and 27, which are essential for maintenance of the PP-fold. As in other vertebrates, the C-terminal sequence is very highly conserved.
Surprisingly, the primary structure of axolotl NPY reveals previously unreported variation among tetrapod NPYs. Compared to other amphibian sequences, the predicted axolotl NPY sequence displays variation in positions 6 and 7. Although the substitution of Asn for Ser at position 7 has previously been observed in chicken (Blomqvist et al., 1992), replacement of Asp for Asn at position 6 is unique among reported tetrapod NPY sequences. Within previously-known tetrapod NPYs, only 4 positions have been shown to vary (positions 7, 10, 17, and 19), and 32 positions, particularly those toward the C-terminus, remain perfectly conserved (Larhammar, 1996; Cerda-Reverter and Larhammar, 2000). Axolotl-derived NPY is the first that does not conform to this consensus, displaying additional variability at position 6 and thereby increasing the number of known variable residues within tetrapod NPYs to 5. The physiological significance, if any, of these changes is unclear.
We found that NPY modulates responses evoked by L-glutamic acid as well as a voltage-sensitive current in olfactory receptor neurons. Several lines of evidence indicate that these effects are not simply due to activation of odorant receptors by NPY. First, application of NPY alone does not produce a signal that can be recorded with our EOG electrodes, although EOG responses are due in part to odorant-stimulated receptor potentials (Scott and Scott-Johnson, 2002). In addition, no odorant or odorant transduction pathway has been shown or suggested to activate or modulate the TTX-sensitive, voltage-activated inward current in olfactory receptor neurons. Finally, olfactory receptor neurons generally begin to adapt or desensitize to the presence of individual odorants within seconds, but we recorded consistent changes in both responses evoked by L-glutamic acid and in voltage-activated currents during bath application of NPY that lasted a minimum of 12–15 min.
Increased levels of NPY in the central nervous system stimulate feeding in a variety of vertebrates, including Xenopus, teleosts, birds, rodents, and humans and other primates (Richardson et al., 1995; Crespi et al., 2004; Halford et al., 2004; Kalra and Kalra, 2004; Levens et al., 2004; Volkoff et al., 2005). One might therefore expect that in hungry animals, the terminal nerve would release NPY, thereby altering odorant responses. However, because we applied a constant dose of NPY to all subjects and cells in physiological experiments, the observed hunger-based differences in responding are likely due to differences in the expression or activity of NPY receptors or other elements of the NPY signal transduction pathway. Although the relative roles of NPY receptor subtypes in mediating food intake have received much attention (Chamorro et al., 2002), to our knowledge, hunger-related changes in NPY receptor expression or transduction have not been documented in previous studies.
In our patch-clamp experiments, we did not find a significant number of cells from well-fed animals responding to NPY, even though we tested a wider range of concentrations with well-fed animals than with hungry animals. We note with some interest that of the 4 cells from well-fed animals tested at high concentrations (5 and 10 μM), 2 cells were categorized as responders and 1 as a nonresponder (Table 2). The data from the fourth cell were ambiguous, as the inward current increased for the first three readings in NPY and then remained near baseline before declining in the wash. Thus, it seems possible that cells from hungry animals are more responsive to NPY, perhaps because of increased receptor expression or other changes in the transduction pathway, but that cells in well-fed animals will also respond to NPY if presented with sufficiently high doses. Nevertheless, 2 control cells also met our criteria for being categorized as responders, making it impossible to draw conclusions concerning the effect of concentration on such a small number of cells.
In the olfactory epithelium, the effects of NPY and GnRH differ. Most conspicuously, in our EOG experiment, NPY increased the magnitude of responses elicited by L-glutamic acid, but only in hungry animals. In contrast, we have previously found that GnRH suppresses EOG responses evoked by L-glutamic acid and other amino acids, irrespective of the animal's hunger level (Park and Eisthen, 2003). Curiously, in that experiment, we also found that the magnitude of the EOG response elicited by L-glutamic acid did not simply return to baseline during the wash period but was significantly larger than before GnRH application (Park and Eisthen, 2003). In our patch-clamp experiments (Eisthen et al., 2000, and the present study), we found that both NPY and GnRH enhanced the magnitude of a TTX-sensitive current that was probably carried by sodium, although the effects occur in different physiological conditions. In the current study, we found that olfactory receptor neurons from hungry animals were more likely to respond to NPY than were those from well-fed animals, even though we tested much higher concentrations on neurons from well-fed animals than from hungry animals. The probability that an individual olfactory receptor neuron will respond to GnRH varies across the breeding season (Eisthen et al., 2000). In combination, these data suggest that NPY could serve to enhance responses to food-related odorants when animals are hungry, and that GnRH may suppress responses to these same odorants, perhaps when animals are involved in courtship or mating behavior; these responses could even rebound after termination of GnRH release. Note that the modulatory effects of peptides on EOG responses and sodium currents are likely independent, as EOG recordings measure receptor potentials, which are generated before voltage-dependent currents are activated.
Taken together with the results of previous studies, our results suggest that the terminal nerve functions to regulate responses to odorants as appropriate to the animal's physiological or behavioral state by releasing NPY or GnRH in different contexts. Anatomical data from teleost fishes suggest that this regulation is controlled by direct input from olfactory areas in the forebrain, as well as from a midbrain area that receives input from the visual and somatosensory systems and from the reticular formation (Yamamoto and Ito, 2000). Thus, the terminal nerve may be part of a feedback loop to filter olfactory stimuli based on input from the olfactory system itself, as well as from other sensory systems.
The demonstration that NPY functions as a neuromodulator in the olfactory epithelium adds to a growing body of literature showing that the activity of olfactory receptor neurons is regulated by numerous compounds, including acetylcholine, adrenaline, ATP, dopamine, and GnRH, from autonomic fibers, the trigeminal and terminal nerves, and from the olfactory epithelium itself (Arechiga and Alcocer, 1969; Bouvet et al., 1988; Kawai et al., 1999; Vargas and Lucero, 1999; Eisthen et al., 2000; Hegg et al., 2003; Hegg and Lucero, 2004). In addition, NPY has recently been shown to modulate activity in taste buds (Zhao et al., 2005), suggesting that this widely-distributed peptide may play an important neuromodulatory role both in the central nervous system and in peripheral sense organs. Most intriguingly, our data may shed light on the observation that both sensitivity to and perceptual quality of food odorants is enhanced with hunger (Duclaux et al., 1973), suggesting that release of NPY from the terminal nerve could play a role in this common phenomenon.
Acknowledgments
Thanks to Aaron Maule for assistance with the design of the molecular experiments and to Shenna Washington and David Dimitrie for assistance with experimental logistics and animal care. We are indebted to Aaron Maule, Rona Delay, Katherine Leitch, and Petra Telgkamp for insightful comments on the manuscript. Supported by grants from the National Institutes of Health (DC05366) and Wellcome Trust (069411).
References
- Arechiga C, Alcocer H. Adrenergic effects on the electro-olfactogram. Exp Med Surg. 1969;27:384–394. [PubMed] [Google Scholar]
- Behrens U, Wagner HJ. Terminal nerve and vision. Microsc Res Tech. 2004;65:25–32. doi: 10.1002/jemt.20108. [DOI] [PubMed] [Google Scholar]
- Blomqvist AG, Soderberg C, Lundell I, Milner RJ, Larhammar D. Strong evolutionary conservation of neuropeptide Y: Sequences of chicken, goldfish, and Torpedo marmorata DNA clones. Proc Natl Acad Sci USA. 1992;89:2350–2354. doi: 10.1073/pnas.89.6.2350. [DOI] [PMC free article] [PubMed] [Google Scholar]
- Bouvet JF, Delaleu JC, Holley A. The activity of olfactory receptor cells is affected by acetylcholine and substance P. Neurosci Res. 1988;5:214–223. doi: 10.1016/0168-0102(88)90050-8. [DOI] [PubMed] [Google Scholar]
- Bullock TH, Northcutt RG. Nervus terminalis in dogfish (Squalus acanthias, Elasmobranchii) carries tonic efferent impulses. Neurosci Lett. 1984;44:155–160. doi: 10.1016/0304-3940(84)90074-0. [DOI] [PubMed] [Google Scholar]
- Cerda-Reverter JM, Larhammar D. Neuropeptide Y family of peptides: Structure, anatomical expression, function, and molecular evolution. Biochem Cell Biol. 2000;78:371–392. [PubMed] [Google Scholar]
- Chamorro S, Della-Zuana O, Fauchere JL, Feletou M, Galizzi JP, Levens N. Appetite suppression based on selective inhibition of NPY receptors. Int J Obes Relat Metab Disord. 2002;26:281–298. doi: 10.1038/sj.ijo.0801948. [DOI] [PubMed] [Google Scholar]
- Chartrel N, Conlon JM, Danger JM, Fournier A, Tonon MC, Vaundry H. Characterization of melanotropin-release-inhibiting factor (melanostatin) from frog brain: Homology with human neuropeptide Y. Proc Natl Acad Sci USA. 1991;88:3862–3866. doi: 10.1073/pnas.88.9.3862. [DOI] [PMC free article] [PubMed] [Google Scholar]
- Chiba A. Immunohistochemical cell types in the terminal nerve ganglion of the cloudy dogfish, Scyliorhinus torazame, with special regard to neuropeptide Y/FMRFamide-immunoreactive cells. Neurosci Lett. 2000;286:195–198. doi: 10.1016/s0304-3940(00)01122-8. [DOI] [PubMed] [Google Scholar]
- Chiba A. Neuropeptide Y-immunoreactive (NPY-ir) structures in the brain of the gar Lepisosteus oculatus (Lepisosteiformes, Osteichthyes) with special regard to their anatomical relations to gonadotropin-releasing hormone (GnRH)-ir structures in the hypothalamus and the terminal nerve. Gen Comp Endocrinol. 2005;142:336–346. doi: 10.1016/j.ygcen.2005.02.010. [DOI] [PubMed] [Google Scholar]
- Chiba A, Oka S, Honma Y. Ontogenetic development of gonadotropin-releasing hormone-like immunoreactive neurons in the brain of the chum salmon, Oncorhynchus keta. Neurosci Lett. 1994;178:51–54. doi: 10.1016/0304-3940(94)90287-9. [DOI] [PubMed] [Google Scholar]
- Chiba A, Sohn YC, Honma Y. Immunohistochemical and ultrastructural characterization of the terminal nerve ganglion cells of the ayu, Plecoglossus altivelis (Salmoniformes, Teleostei) Anat Rec. 1996;246:549–556. doi: 10.1002/(SICI)1097-0185(199612)246:4<549::AID-AR14>3.0.CO;2-O. [DOI] [PubMed] [Google Scholar]
- Crespi EJ, Vaudry H, Denver RJ. Roles of corticotropin-releasing factor, neuropeptide Y and corticosterone in the regulation of food intake in Xenopus laevis. J Neuroendocrinol. 2004;16:279–288. doi: 10.1111/j.0953-8194.2004.01168.x. [DOI] [PubMed] [Google Scholar]
- Danger JM, Tonon MC, Jenks BG, Saint-Pierre S, Martel JC, Fasolo A, Breton B, Quirion R, Pelletier G, Vaudry H. Neuropeptide Y: localization in the central nervous system and neuroendocrine functions. Fundam Clin Pharmacol. 1990;4:307–340. doi: 10.1111/j.1472-8206.1990.tb00497.x. [DOI] [PubMed] [Google Scholar]
- Demski LS, Northcutt RG. The terminal nerve: A new chemosensory system in vertebrates? Science. 1983;220:435–437. doi: 10.1126/science.6836287. [DOI] [PubMed] [Google Scholar]
- Duclaux R, Feisthau J, Cabanac M. Effect of eating a meal on pleasantness of food and nonfood odors in man. Physiol Behav. 1973;10:1029–1033. doi: 10.1016/0031-9384(73)90184-4. [DOI] [PubMed] [Google Scholar]
- Ebersole TJ, Conlon JM, Goetz FW, Boyd SK. Characterization and distribution of neuropeptide Y in the brain of a caecilian amphibian. Peptides. 2001;22:325–334. doi: 10.1016/s0196-9781(01)00334-5. [DOI] [PubMed] [Google Scholar]
- Eisthen HL, Park D. Chemical signals and vomeronasal system function in axolotls (Ambystoma mexicanum) In: Mason R, LeMaster M, Müller-Schwarze D, editors. Chemical Signals in Vertebrates 10. Berlin, New York: Springer; 2005. pp. 216–227. [Google Scholar]
- Eisthen HL, Delay RJ, Wirsig-Wiechmann CR, Dionne VE. Neuromodulatory effects of gonadotropin releasing hormone on olfactory receptor neurons. J Neurosci. 2000;20:3947–3955. doi: 10.1523/JNEUROSCI.20-11-03947.2000. [DOI] [PMC free article] [PubMed] [Google Scholar]
- Fiorentino M, Pinelli C, D'Aniello B, Iela L, di Meglio M, Rastogi RK. Development and distribution of FMRFamide-like immunoreactivity in the toad (Bufo bufo) brain. J Chem Neuroanat. 2001;21:201–213. doi: 10.1016/s0891-0618(01)00110-7. [DOI] [PubMed] [Google Scholar]
- Firestein S. How the olfactory system makes sense of scents. Nature. 2001;413:211–218. doi: 10.1038/35093026. [DOI] [PubMed] [Google Scholar]
- Fritsch G. Untersuchungen über den feineren Bau des Fischgehirns mit besonderer Berücksichtigung der Homologien bei anderen Wirbelthierklassen. Berlin: Verlag der Gutmann'schen Buchhandlung; 1878. [Google Scholar]
- Fujita I, Sorensen PW, Stacey NE, Hara TJ. The olfactory system, not the terminal nerve, functions as the primary chemosensory pathway mediating responses to sex pheromones in the male goldfish. Brain Behav Evol. 1991;38:313–321. doi: 10.1159/000114397. [DOI] [PubMed] [Google Scholar]
- Griffin D, Minth CD, Taylor WL. Isolation and characterization of the Xenopus laevis cDNA and genomic homologs of neuropeptide Y. Mol Cell Endocrinol. 1994;101:1–10. doi: 10.1016/0303-7207(94)90213-5. [DOI] [PubMed] [Google Scholar]
- Halford JC, Cooper GD, Dovey TM. The pharmacology of human appetite expression. Curr Drug Targets. 2004;5:221–240. doi: 10.2174/1389450043490541. [DOI] [PubMed] [Google Scholar]
- Hansel DE, Eipper BA, Ronnett GV. Neuropeptide Y functions as a neuroproliferative factor. Nature. 2001;410:940–944. doi: 10.1038/35073601. [DOI] [PubMed] [Google Scholar]
- Hegg CC, Lucero MT. Dopamine reduces odor- and elevated-K+-induced calcium responses in mouse olfactory receptor neurons in situ. J Neurophysiol. 2004;91:1492–1499. doi: 10.1152/jn.00670.2003. [DOI] [PMC free article] [PubMed] [Google Scholar]
- Hegg CC, Greenwood D, Huang W, Han P, Lucero MT. Activation of purinergic receptor subtypes modulates odor sensitivity. J Neurosci. 2003;23:8291–8301. doi: 10.1523/JNEUROSCI.23-23-08291.2003. [DOI] [PMC free article] [PubMed] [Google Scholar]
- Huang L, Maaswinkel H, Li L. Olfactoretinal centrifugal input modulates zebrafish retinal ganglion cell activity: A possible role for dopamine-mediated Ca2+ signaling pathways. J Physiol. 2005;569:939–948. doi: 10.1113/jphysiol.2005.099531. [DOI] [PMC free article] [PubMed] [Google Scholar]
- Kalra SP, Kalra PS. NPY: A novel on/off switch for control of appetite and reproduction. In: Michel MC, editor. Neuropeptide Y and Related Peptides. Berlin, New York: Springer; 2004. pp. 221–249. [Google Scholar]
- Kauer JS. On the scents of smell in the salamander. Nature. 2002;417:336–342. doi: 10.1038/417336a. [DOI] [PubMed] [Google Scholar]
- Kawai F, Kurahashi T, Kaneko A. Adrenaline enhances odorant contrast by modulating signal encoding in olfactory receptor cells. Nature Neurosci. 1999;2:133–138. doi: 10.1038/5686. [DOI] [PubMed] [Google Scholar]
- King JA, Millar RP. Evolution of gonadotropin-releasing hormones. Trends Endocrinol Metab. 1992;3:339–346. doi: 10.1016/1043-2760(92)90113-f. [DOI] [PubMed] [Google Scholar]
- Larhammar D. Evolution of neuropeptide Y, peptide YY and pancreatic polypeptide. Regul Pept. 1996;62:1–11. doi: 10.1016/0167-0115(95)00169-7. [DOI] [PubMed] [Google Scholar]
- Laurent G. Olfactory network dynamics and the coding of multidimensional signals. Nat Rev Neurosci. 2002;3:884–895. doi: 10.1038/nrn964. [DOI] [PubMed] [Google Scholar]
- Levens NR, Félétou M, Galizzi J-P, Fauchére J-L, Della-Zuana O, Lonchampt M. NPY effects on food intake and metabolism. In: Michel MC, editor. Neuropeptide Y and Related Peptides. Berlin, New York: Springer; 2004. pp. 283–325. [Google Scholar]
- Maaswinkel H, Li L. Olfactory input increases visual sensitivity in zebrafish: a possible function for the terminal nerve and dopaminergic interplexiform cells. J Exp Biol. 2003;206:2201–2209. doi: 10.1242/jeb.00397. [DOI] [PubMed] [Google Scholar]
- Mathieu M, Tagliafierro G, Bruzzone F, Vallarino M. Neuropeptide tyrosine-like immunoreactive system in the brain, olfactory organ and retina of the zebrafish, Danio rerio, during development. Brain Res Dev Brain Res. 2002;139:255–265. doi: 10.1016/s0165-3806(02)00577-1. [DOI] [PubMed] [Google Scholar]
- McKay DM, Shaw C, Halton DW, Thim L, Buchanan KD. The primary structure and tissue distribution of an amphibian neuropeptide Y. Regul Pept. 1992;37:143–153. doi: 10.1016/0167-0115(92)90663-f. [DOI] [PubMed] [Google Scholar]
- Michel MC, editor. Neuropeptide Y and Related Peptides. Berlin, New York: Springer; 2004. [Google Scholar]
- Northcutt RG, Muske LE. Multiple embryonic origins of gonadotropin-releasing hormone (GnRH) immunoreactive neurons. Developmental Brain Research. 1994;78:279–290. doi: 10.1016/0165-3806(94)90037-x. [DOI] [PubMed] [Google Scholar]
- Oka Y. Gonadotropin-releasing hormone (GnRH) cells of the terminal nerve as a model neuromodulator system. Neurosci Lett. 1992;142:119–122. doi: 10.1016/0304-3940(92)90353-9. [DOI] [PubMed] [Google Scholar]
- Oka Y. Physiology and release activity of GnRH neurons. Prog Brain Res. 2002;141:259–281. doi: 10.1016/S0079-6123(02)41098-9. [DOI] [PubMed] [Google Scholar]
- Park D, Eisthen HL. Gonadotropin releasing hormone (GnRH) modulates odorant responses in the peripheral olfactory system of axolotls. J Neurophysiol. 2003;90:731–738. doi: 10.1152/jn.01162.2002. [DOI] [PubMed] [Google Scholar]
- Park D, Zawacki SR, Eisthen HL. Olfactory signal modulation by molluscan cardioexcitatory tetrapeptide (FMRFamide) in axolotls (Ambystoma mexicanum) Chem Senses. 2003;28:339–348. doi: 10.1093/chemse/28.4.339. [DOI] [PubMed] [Google Scholar]
- Park D, McGuire JM, Majchrzak AL, Ziobro JM, Eisthen HL. Discrimination of conspecific sex and reproductive condition using chemical cues in axolotls (Ambystoma mexicanum) J Comp Physiol A. 2004;190:415–427. doi: 10.1007/s00359-004-0510-y. [DOI] [PubMed] [Google Scholar]
- Perroteau I, Danger JM, Biffo S, Pelletier G, Vaudry H, Fasolo A. Distribution and characterization of neuropeptide Y-like immunoreactivity in the brain of the crested newt. J Comp Neurol. 1988;275:309–325. doi: 10.1002/cne.902750302. [DOI] [PubMed] [Google Scholar]
- Richardson RD, Boswell T, Raffety BD, Seeley RJ, Wingfield JC, Woods SC. NPY increases food intake in white-crowned sparrows: effect in short and long photoperiods. Am J Physiol. 1995;268:R1418–1422. doi: 10.1152/ajpregu.1995.268.6.R1418. [DOI] [PubMed] [Google Scholar]
- Riddle DR, Oakley B. Immunocytochemical identification of primary olfactory afferents in rainbow trout. J Comp Neurol. 1992;324:575–589. doi: 10.1002/cne.903240410. [DOI] [PubMed] [Google Scholar]
- Rossi A, Basile A, Palombi F. Speculations on the function of the nervus terminalis in teleosts. Riv Biol. 1972;65:385–409. [PubMed] [Google Scholar]
- Scott JW, Scott-Johnson PE. The electroolfactogram: A review of its history and uses. Microsc Res Tech. 2002;58:152–160. doi: 10.1002/jemt.10133. [DOI] [PubMed] [Google Scholar]
- Sherwood NM, Zoeller RT, Moore FL. Multiple forms of gonadotropin-releasing hormone in amphibian brains. Gen Comp Endocrinol. 1986;61:313–322. doi: 10.1016/0016-6480(86)90208-x. [DOI] [PubMed] [Google Scholar]
- Sorensen P, Caprio J. Chemoreception. In: Evans D, editor. The Physiology of Fishes. New York: CRC Press; 1998. pp. 375–405. [Google Scholar]
- Tuinhof R, Gonzalez A, Smeets WJ, Roubos EW. Neuropeptide Y in the developing and adult brain of the South African clawed toad Xenopus laevis. J Chem Neuroanat. 1994;7:271–283. doi: 10.1016/0891-0618(94)90018-3. [DOI] [PubMed] [Google Scholar]
- van Riel MC, Tuinhof R, Roubos EW, Martens GJ. Cloning and sequence analysis of hypothalamic cDNA encoding Xenopus preproneuropeptide Y. Biochem Biophys Res Commun. 1993;190:948–951. doi: 10.1006/bbrc.1993.1141. [DOI] [PubMed] [Google Scholar]
- Vargas G, Lucero MT. Dopamine modulates inwardly rectifying hyperpolarization- activated current (Ih) in cultured rat olfactory receptor neurons. J Neurophysiol. 1999;81:149–158. doi: 10.1152/jn.1999.81.1.149. [DOI] [PubMed] [Google Scholar]
- Volkoff H, Canosa LF, Unniappan S, Cerda-Reverter JM, Bernier NJ, Kelly SP, Peter RE. Neuropeptides and the control of food intake in fish. Gen Comp Endocrinol. 2005;142:3–19. doi: 10.1016/j.ygcen.2004.11.001. [DOI] [PubMed] [Google Scholar]
- Walker SE, Stell WK. Gonadotropin-releasing hormone (GnRF), molluscan cardioexcitatory peptide (FMRFamide), enkephalin and related neuropeptides affect goldfish retinal ganglion cell activity. Brain Res. 1986;384:262–273. doi: 10.1016/0006-8993(86)91162-5. [DOI] [PubMed] [Google Scholar]
- White J, Meredith M. Nervus terminalis ganglion of the bonnethead shark (Sphyrna tiburo): Evidence for cholinergic and catecholamingeric influence on two cell types distinguished by peptide immunocytochemistry. J Comp Neurol. 1995;351:385–403. doi: 10.1002/cne.903510306. [DOI] [PubMed] [Google Scholar]
- Wirsig CR, Getchell TV. Amphibian terminal nerve: Distribution revealed by LHRH and AChE markers. Brain Res. 1986;385:1–21. doi: 10.1016/0006-8993(86)91541-6. [DOI] [PubMed] [Google Scholar]
- Wirsig-Wiechmann CR. Nervus terminalis lesions: I. No effect on pheromonally induced testosterone surges in the male hamster. Physiol Behav. 1993;53:251. doi: 10.1016/0031-9384(93)90201-p. [DOI] [PubMed] [Google Scholar]
- Wirsig-Wiechmann CR, Wiechmann AF, Eisthen HL. What defines the nervus terminalis? Neurochemical, developmental, and anatomical criteria. Prog Brain Res. 2002;141:45. doi: 10.1016/S0079-6123(02)41083-7. [DOI] [PubMed] [Google Scholar]
- Yamamoto N, Ito H. Afferent sources to the ganglion of the terminal nerve in teleosts. J Comp Neurol. 2000;428:355. doi: 10.1002/1096-9861(20001211)428:2<355::aid-cne12>3.0.co;2-w. [DOI] [PubMed] [Google Scholar]
- Zhao FL, Shen T, Kaya N, Lu SG, Cao Y, Herness S. Expression, physiological action, and coexpression patterns of neuropeptide Y in rat taste-bud cells. Proc Natl Acad Sci USA. 2005;102:11100. doi: 10.1073/pnas.0501988102. [DOI] [PMC free article] [PubMed] [Google Scholar]