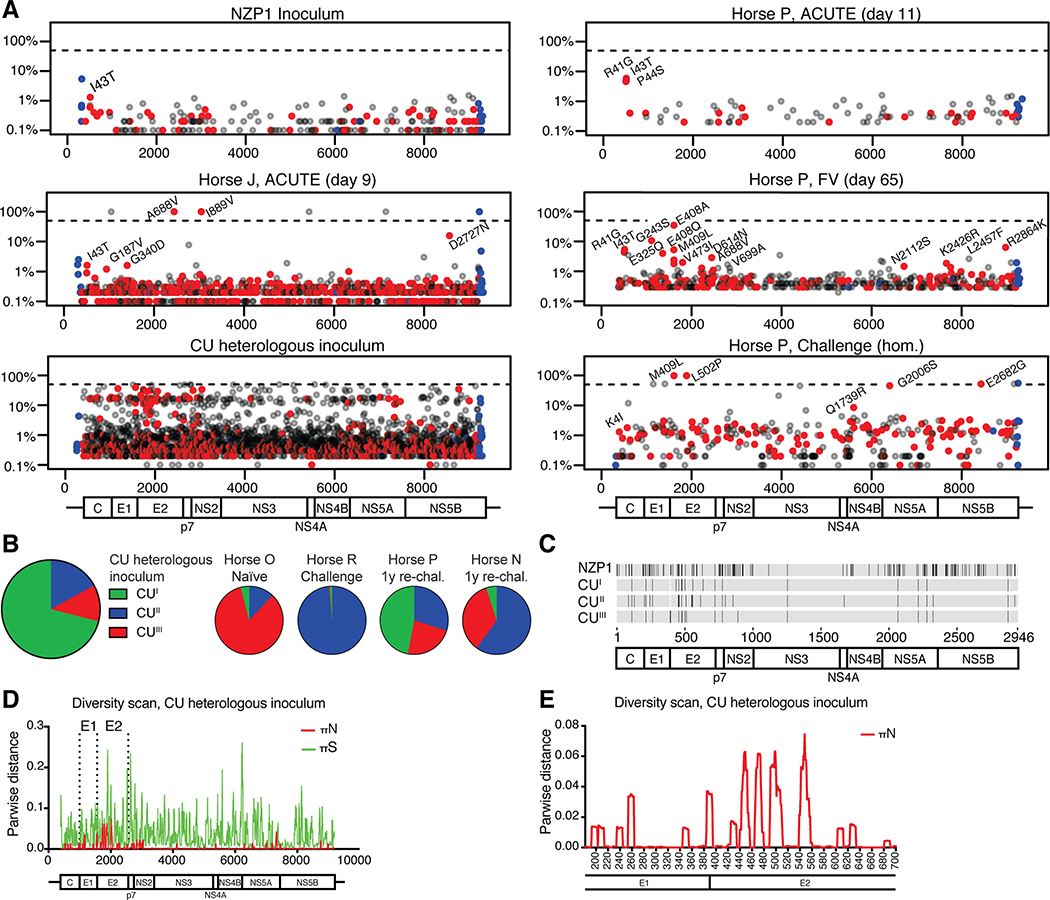
Fig 3: EqHV evolution over the course of infection shows little evidence of immune escape.
(A) Viral genome diversity is shown for the NZP1 inoculum, for representative ACUTE, FV and homologous rechallenge timepoints from horse P, for the ACUTE timepoint for horse J, and for the CU heterologous inoculum. Data for remaining horses are shown in Supplemental Fig. S8. Non-synonymous changes are in red, synonymous in grey, and UTR changes in blue. Non-synonymous changes with a frequency >1% are annotated (except for CU). The dashed line indicates 50% (consensus change). (B) Three CU sub-populations are recognized (GenBank MT955622-24) and shown in a pie-chart, with the distribution in inoculated horses shown to the right. (C) Non-synonymous differences among NZP1 and CU sub-populations (no reference sequence set). (D-E) Viral diversity scan for the CU inoculum across the genome (D; nt) or E1-E2 region (E; aa).

