Abstract
Background
Over half of all cancer patients receive radiation therapy (RT). However, radiation exposure to the heart can cause cardiotoxicity. Nevertheless, there is a paucity of data on RT-induced cardiac damage, with limited understanding of safe regional RT doses, early detection, prevention and management. A common initial feature of cardiotoxicity is asymptomatic dysfunction, which if left untreated may progress to heart failure. The current paradigm for cardiotoxicity detection and management relies primarily upon assessment of ejection fraction (EF). However, cardiac injury can occur without a clear change in EF.
Objectives
To identify magnetic resonance imaging (MRI) markers of early RT-induced cardiac dysfunction.
Methods
We investigated the effect of RT on global and regional cardiac function and myocardial T1/T2 values at two timepoints post-RT using cardiac MRI in a rat model of localized cardiac RT. Rats who received image-guided whole-heart radiation of 24Gy were compared to sham-treated rats.
Results
The rats maintained normal global cardiac function post-RT. However, a deterioration in strain was particularly notable at 10-weeks post RT, and changes in circumferential strain were larger than changes in radial or longitudinal strain. Compared to sham, circumferential strain changes occurred at the basal, mid-ventricular and apical levels (p<0.05 for all at both 8-weeks and 10-weeks post-RT), most of the radial strain changes occurred at the mid-ventricular (p=0.044 at 8-weeks post-RT) and basal (p=0.018 at 10-weeks post-RT) levels, and most of the longitudinal strain changes occurred at the apical (p=0.002 at 8-weeks post-RT) and basal (p=0.035 at 10-weeks post-RT) levels. Regionally, lateral myocardial segments showed the greatest worsening in strain measurements, and histologic changes supported these findings. Despite worsened myocardial strain post-RT, myocardial tissue displacement measures were maintained, or even increased. T1/T2 measurements showed small non-significant changes post-RT compared to values in non-irradiated rats.
Conclusions
Our findings suggest MRI regional myocardial strain is a sensitive imaging biomarker for detecting RT-induced subclinical cardiac dysfunction prior to compromise of global cardiac function.
Keywords: Radiation therapy, MRI, heart, cardiotoxicity, rat, strain, ejection fraction
Condensed Abstract
Radiation therapy (RT) is received in over half of all cancer patients. However, radiation exposure to the heart can cause cardiotoxicity. In this study, we investigated the effect of RT on global and regional cardiac function at two timepoints post-RT using MRI in a rat model of localized cardiac RT. The results showed that rats maintained normal global cardiac function post-RT. Nevertheless, myocardial strain worsened post-RT, especially at 10-weeks and in lateral regions, with histology supporting these findings. Our data suggest that MRI myocardial strain is a sensitive imaging biomarker for detecting RT-induced cardiac dysfunction before global cardiac function is compromised.
Introduction
Cancer radiation treatment aims to reduce the risk of recurrence and improve survival by eliminating tumor cells locally that may seed distant metastatic disease. Radiation therapy (RT) is used in more than 50% of all cancer patients, but radiation doses can be limited by side effects to nearby organs, especially the heart for patients with thoracic tumors. Radiation-induced cardiac dysfunction can occur months to years following cardiac RT exposure, and cardiac sequelae can include a number of clinical manifestations, including ischemic heart disease, fibrosis, arrhythmias, cardiomyopathy, valvular abnormalities, and/or pericarditis (1, 2). RT plays an integral role in treating breast cancer, as well as advanced lung cancer (3-6), and studies in lung cancer patients have found that mortality correlates with mean heart dose (3), or with the percent of the heart receiving 5Gy (7), 30Gy, and/or 50Gy (5). However, it is unclear what radiation doses to the heart pose the most risk in lung cancer patients (8), which is likely due to inherent challenges in addressing the case-by-case variability of incidental cardiac radiation in these patients. Preclinical models using defined radiation dose distributions and sensitive imaging to assess regional cardiac function are ideal to meet many of these identified challenges for radiation oncologists treating thoracic tumors (9). Identification of an imaging protocol that can allow for sensitive, regional detection of subclinical radiation-induced cardiac dysfunction in preclinical models would advance knowledge of how radiation affects cardiac function, and ultimately lead to better dose guidelines for radiation therapy and decrease the incidence and severity of radiation-induced cardiotoxicity.
The most common initial feature of cardiotoxicity is asymptomatic systolic left ventricular (LV) dysfunction, which if left untreated may progress to congestive heart failure (HF) (10,11). This initial cardiac dysfunction may not be clinically apparent for many years because of cardiac function normalization by compensatory mechanisms. The current paradigm for cardiotoxicity detection and management relies primarily upon the assessment of LV ejection fraction (EF). Although EF is important, it may not reflect the underlying advancement of subclinical cardiovascular disease that could portend the development of treatment-induced cardiovascular events (12).
Cardiac magnetic resonance imaging (MRI) is considered the reference-standard for the evaluation of cardiac volumes, mass, and function. Further, parameters that reflect global and regional function, such as myocardial strain, are more sensitive than EF for early recognition of asymptomatic cardiac dysfunction and identification of patients at risk of HF (13,14). Although changes in these parameters have been widely studied following cancer treatment in specific cancer populations such as breast cancer (15), the clinical value of these imaging biomarkers has not been comprehensively defined with RT treatment or in lung cancer patients. In this study, we investigated cardiac MRI capabilities for regional cardiac function analysis and tissue characterization for evaluation of cardiac performance and early detection of RT-induced cardiotoxicity in a lung cancer rat model of image-guided localized cardiac RT (16). We evaluated early timepoints prior to the compromise of global function but when inflammatory changes could be observed (9,16), and we compared the results to sham-treated control rats.
Methods
Animal Model of Radiation Therapy
This study was approved by our Institutional Animal Care Committee. Inbred salt-sensitive (SS) rats were housed in pathogen-free conditions with a 12:12-hour light:dark cycle and administered a standard diet (0.4% salt) (9). A total of 22 salt-sensitive (SS) adult female rats, aged 10-12 weeks, were randomized (1:2) into two groups: sham-treated (N=7) and cardiac RT (N=15). The RT group received image-guided localized whole-heart radiation of 24Gy in one fraction (3 equally-weighted beams (1 anterior-posterior beam and 2 lateral beams, 1:1:1, 225kVp, 13mA, 0.32mm Cu, 2.69Gy/min)), as previously described (16).
MRI Scans
Rats were imaged on a small-animal 9.4T MRI scanner (Bruker, Ettlingen, Germany) using a 4-element surface coil at 8- and 10-weeks post-RT or 8-weeks post-sham treatment. The implemented MRI scan included acquiring both long-axis (LAX) and short-axis (SAX) cine and tagged images, as previously described (17). In addition, inversion recovery (IR) T1 mapping and multi-echo spin-echo (MESE) T2 mapping techniques were used to acquire relaxometry maps in mid-ventricular SAX slices (17). Total scan time was approximately one hour.
MRI Image Analysis and Statistics
The cine, IR, and MESE images were analyzed using the cvi42 (Circle Cardiovascular Imaging, Calgary, Canada) software to measure ventricular EF, mass, end-diastolic volume (EDV), end-systolic volume (ESV), stroke volume (SV), and T1/T2 maps. The tagged images were analyzed using the SinMod technique (InTag, Lyon, France) (18) to measure myocardial circumferential, radial, and longitudinal strain as well as tissue rotation angle, SAX motion, and LAX motion, where the reproducibility of the MRI measures have been previously demonstrated (18). Analysis was performed in a blinded fashion to avoid bias. Regional cardiac function parameters were measured at different myocardial segments and results were represented using the American Heart Association (AHA) 17-segment model.
Tissue Architecture and Measurement of Cardiac Fibrosis, Mast Cells, and Vascularization
Ten weeks after RT or sham treatment, rats were euthanized by isoflurane overdose, hearts were excised and rapidly rinsed with PBS, and a short-axis mid-ventricular section was excised for histology. The heart sections were fixed in zinc formalin for 48 hours, transferred to 70% ethanol, and embedded in paraffin. Four micrometer sections were stained with hematoxylin and eosin (H&E) using standard methods. H&E slides from the hearts were examined for architectural changes, such as hemorrhage, cellular vacuolization, and/or cellular necrosis in the interventricular septum or left ventricular lateral wall (N=4-5/condition). These changes were scored blindly by a board-certified pathologist (C.L.).
For immunofluorescent staining of blood vessels and cardiomyocytes, all antibodies were diluted 1:100 in phosphate buffered saline with Tween (PBST, pH 7.4, 0.1% Tween-20) containing 5 mg/mL of BSA. Frozen sections were fixed with formalin for 1 minute, rehydrated in PBST for 10 minutes, and incubated for 1 hour at 37°C with primary antibodies against the blood vessel marker, Sh2b3 (HPA005483; Sigma-Aldrich, St. Louis, MO) (19) and cardiomyocyte marker Caveolin-3 (610420, BD Biosciences) (20). Slides were then washed with PBST for 10 minutes and incubated for 1 hour at 37°C with secondary antibodies conjugated with Alexa Flour 488 or Alexa Fluor 555 (Jackson ImmunoResearch, West Grove, PA), followed by an additional 10-minute wash in PBST. Slides were mounted in Vectashield medium containing 4,69-diamidino-2-phenylindole nuclear stain (Vector Laboratories, Burlingame, CA). Images were obtained from the LV lateral wall where cross-sectioned cardiomyocytes and capillaries were visualized. All images were acquired using a Nikon Eclipse 55i upright microscope equipped with a Nikon SD-2MBW camera and NIS Elements D software (Nikon Instruments, Melville, NY). Staining was quantified on blinded samples by counting the number of capillaries abutting each cardiomyocyte in 3-4 high-powered fields per heart (N=3), as previously described (21-24).
For fibrosis quantification, Masson’s trichrome staining for collagen deposition was performed on fixed 4 μm sections. Images were acquired using Nikon Eclipse 50i upright microscope and Digital DS-U3 camera. ImageJ software (NIH, Bethesda, MD) was used to quantify interstitial collagen, taking blue area/(total area - white space). In a blinded manner, 4-5 hearts per condition were analyzed, with 5 fields per samples quantified in areas lacking visualized blood vessels so as to exclude the contribution of perivascular fibrosis. Perivascular fibrosis in coronary vessels (<50 μm) was quantified separately using ImageJ, and expressed as % fibrosis per lumen area, with at least 5 vessels quantified per field, with 3-4 hearts examined per condition, and 15-20 vessels per condition analyzed. Mast cell staining was performed using toluidine blue as previously described (16). Four high-powered fields were quantified per sample, with N=4 animals examined per condition. Cells were quantified in the myocardium by two independent investigators blinded to the sample treatments.
Statistical Analysis
SPSS Statistics ver. 24 (IBM, Armonk, NY) and Excel ver. (Microsoft Office 365, Redmond, WA) were used for statistical analysis. Measurements are represented as mean±standard error of mean (SEM). The Student’s t-test was used to determine significant measurement changes between MRI measurements according to different groups and for the analysis of immunofluorescent and immunohistochemical data (P<0.05 considered significant). Post-hoc Bonferroni correction was used to adjust p-values for multiple comparisons.
Results
Histopathologic Changes in the Rat Heart Occur by 10 Weeks after Localized Cardiac RT
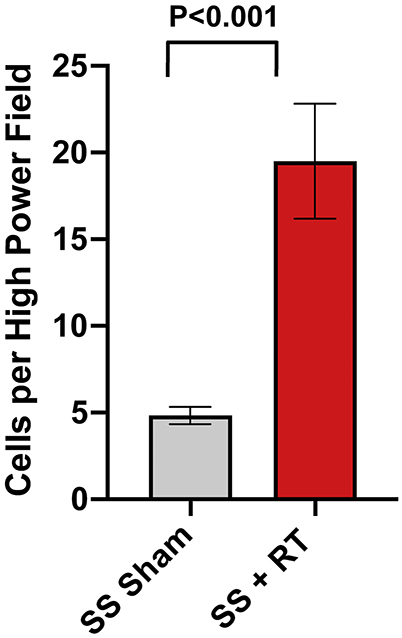
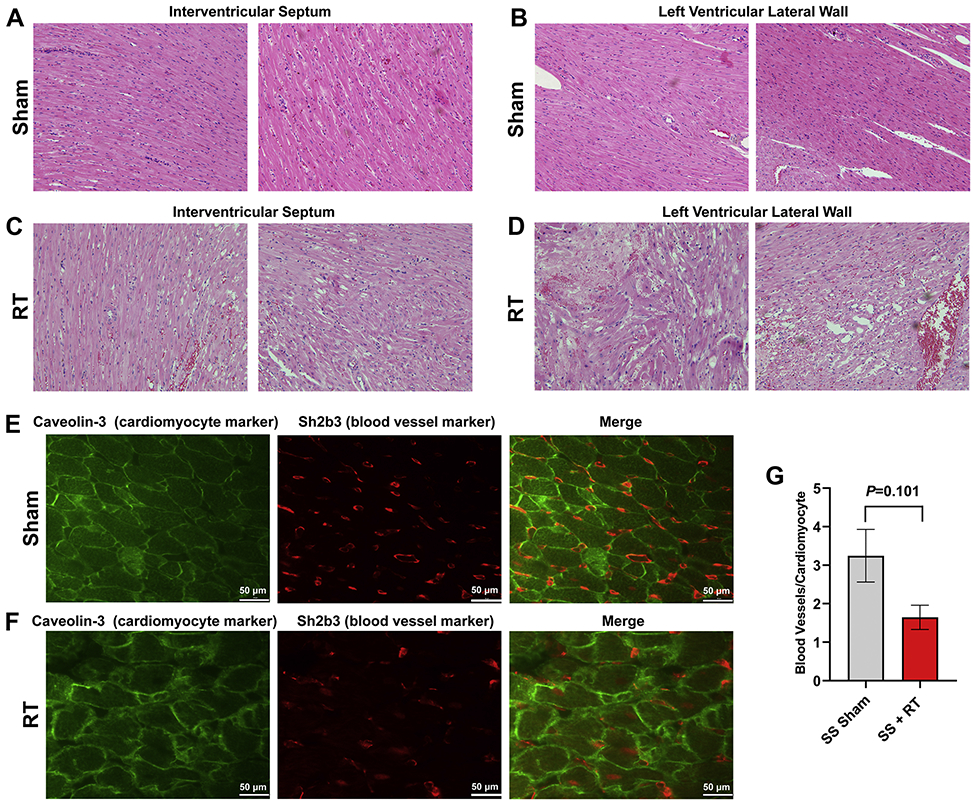
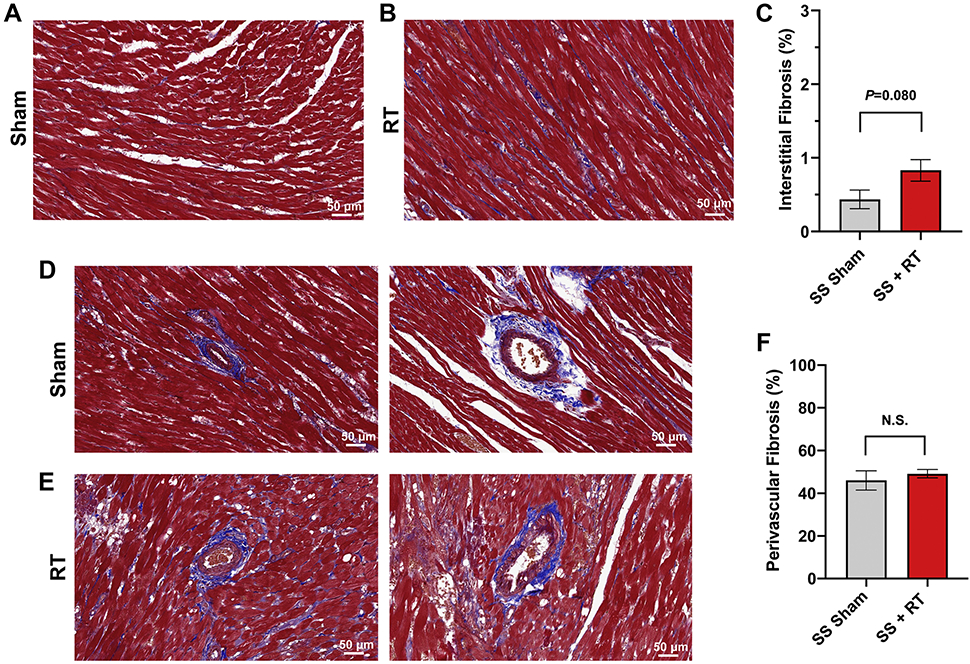
SS rats developed cardiac dysfunction, as measured via echocardiogram at 12-20 weeks after 24Gy of cardiac RT (16). However, no significant decrease in EF was seen at 12-weeks post-RT in this model. For this study, we specifically focused on earlier timepoints, during periods where inflammatory changes occur (9, 16) that may be detectable via cardiac MRI. At 10-weeks post-RT, there was a significant increase in mast cells in the myocardium after RT, compared to sham treatment (Figure 1). We also examined myocardial damage and microvascular density in SS hearts 10-weeks post-RT. H&E stained sections from sham-treated hearts demonstrated no cellular vacuolization or necrosis in the myocardium (Figure 2a,b), while myocardial damage was seen in the RT-treated hearts (Figure 2c,d). Hemorrhage was also seen in the radiated hearts (Figure 2c,d). In general, there was more notable necrosis and vacuolization in the LV lateral wall (Figure 2d) than the interventricular septum (Figure 2c). Vascularity was quantified using the number of vessels/cardiomyocyte (21), which demonstrated a marginally significant decrease of microvascular density in irradiated rat hearts post-RT, as compared to non-irradiated, sham-treated animals at 10-weeks after treatment (Figure 2e,f), although the difference was not statistically significant (sham vs. RT 3.25±0.68 vs. 1.65±32, P=0.101, Figure 2g). In addition, there was an increase in interstitial fibrosis at 10-weeks post-RT compared to sham, although this was also not statistically significant (0.41±0.16 vs. 0.79±0.14, P=0.080, Figure 3a,b,c). Similarly, there was a small but non-significant increase in perivascular fibrosis in the left ventricle (Figure 3d,e,f).
Figure 1. Mast cell infiltration increases in the myocardium after localized cardiac RT.
Adult female rats were administered 24Gy of localized cardiac RT or sham treatment, and at 10-weeks post-treatment their hearts were harvested. Mast cells were stained using toluidine blue and quantified. The figure shows a significant increase in mast cell infiltration after RT, N=4/condition. Values are the mean±SEM.
Figure 2. SS rats demonstrate myocardial vacuolization and necrosis, with a marginally significant decrease of microvascular density, 10-weeks after 24Gy localized cardiac RT.
Adult female rats were administered 24Gy of localized cardiac RT or sham treatment, and at 10-weeks post-treatment their hearts were harvested. H&E stained sections demonstrated healthy LV myocardial tissue in sham-treated hearts (a-b), while RT-treated hearts had notable necrosis and vacuolization (c-d), which was increased in the LV lateral wall (d) when compared to the interventricular septum (c). (e-g) Fixed heart sections were stained for cardiomyocytes (caveolin-3) and blood vessels (Sh2b3). The number of blood vessels per cardiomyocyte was calculated, with representative images from sham-treated (e) and RT-treated (f) hearts. This demonstrated a marginally significant decrease of capillary density after RT (g). N=3/condition. Values are the mean±SEM.
Figure 3. SS rats demonstrate no appreciable increase in fibrosis 10-weeks after 24Gy localized cardiac RT.
Ten weeks after 24Gy of localized cardiac RT or sham treatment, Masson’s trichrome staining was performed and the interstitial and perivascular fibrosis was quantified. There was a non-significant increase in interstitial (a-c) and perivascular (d-f) fibrosis in the RT-treated hearts. N=4-5 per condition. Values are the mean±SEM, P=0.476.
Cardiac Function is Maintained Up to 10-Weeks Post-High Dose Whole-Heart RT
We conducted cardiac MRIs at 8- and 10-weeks after 24Gy of localized cardiac radiation, when inflammatory changes were significantly different between sham-treated and RT-treated animals, but fibrosis and vascular density showed more modest differences between the rats receiving RT compared to non-irradiated sham controls. At these timepoints, local radiation changes, such as hair loss at the RT-beam entry sites, were occurring, but systemic changes such as weight loss were absent (data not shown). Figure 4 shows representative end-diastolic (ED) and end-systolic (ES) cine images of RT and control rats at 8-weeks post-treatment. These revealed preserved cardiac function with cardiac remodeling and hypertrophy after RT. Global cardiac function was normal in all rats (Table 1), with increased EF and myocardial mass and decreased ESV and EDV in the RT compared to non-irradiated rats.
Figure 4. Cine images of RT and sham-treated rats demonstrate ventricular remodeling and hypertrophy post-RT.
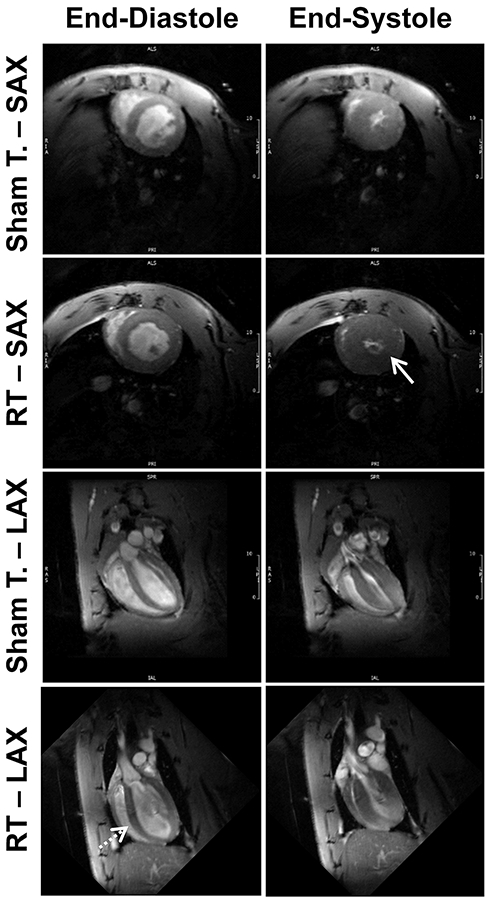
Short-axis (SAX) and long-axis (SAX) cine MRI images showing end-diastolic (ED) and end-systolic (ES) slices in both sham-treated and radiation therapy (RT)-treated rats at 8-weeks post treatment. The images show preserved global cardiac function post-RT, along with hypertrophy (solid arrow) and cardiac remodeling (dotted arrow) compared to sham-treated rats.
Table-1.
Global cardiac function parameters at different timepoints post-RT demonstrate increased EF and hypertrophy post-RT.
| 8-weeks Sham-treated Controls |
8-weeks post-RT |
P-value vs. control |
10-weeks post-RT |
P-value vs. control |
|
|---|---|---|---|---|---|
| LV EF(%) | 67±2.6 | 78±0.7 | 0.003 | 79±0.9 | 0.002 |
| LV Mass(g) | 0.38±0.01 | 0.49±0.02 | <0.001 | 0.56±0.01 | < 0.001 |
| LV EDV(ml) | 0.29±0.01 | 0.259±0.01 | 0.022 | 0.263±0.01 | 0.014 |
| LV ESV(ml) | 0.1±0.007 | 0.06±0.004 | <0.001 | 0.06±0.003 | <0.001 |
| LV SV(ml) | 0.19±0.008 | 0.2±0.007 | 0.317 | 0.2±0.005 | 0.141 |
| RV EF (%) | 69±1.2 | 73±1.6 | 0.039 | 72±1.6 | 0.038 |
| RV Mass(g) | 0.07±0.002 | 0.1±0.009 | 0.009 | 0.13±0.008 | <0.001 |
| RV EDV(ml) | 0.14±0.005 | 0.12±0.008 | 0.113 | 0.13±0.009 | 0.300 |
| RV ESV(ml) | 0.04±0.003 | 0.03±0.002 | 0.007 | 0.03±0.004 | 0.047 |
| RV SV(ml) | 0.1±0.005 | 0.09±0.007 | 0.639 | 0.1±0.006 | 0.556 |
Abbreviations: EDV, end-diastolic volume; EF, ejection fraction; ESV, end-systolic volume; LV, left ventricle; RV, right ventricle; SV, stroke volume. Values represent mean ± standard error of mean.
Myocardial Strain is a Sensitive Marker of Early RT-Induced Cardiotoxicity
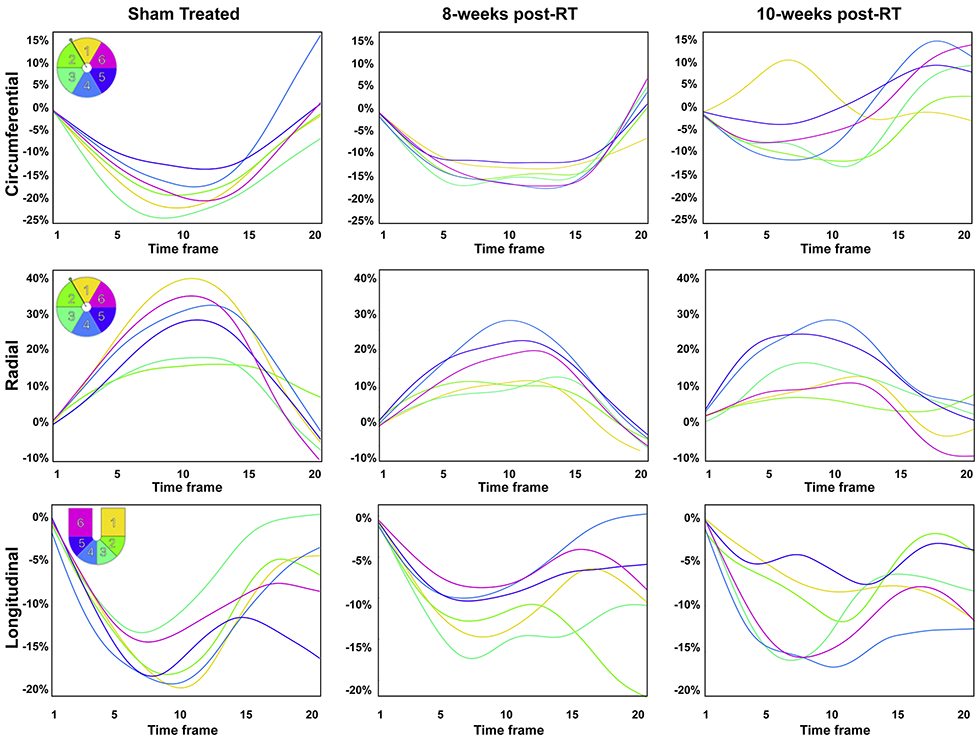
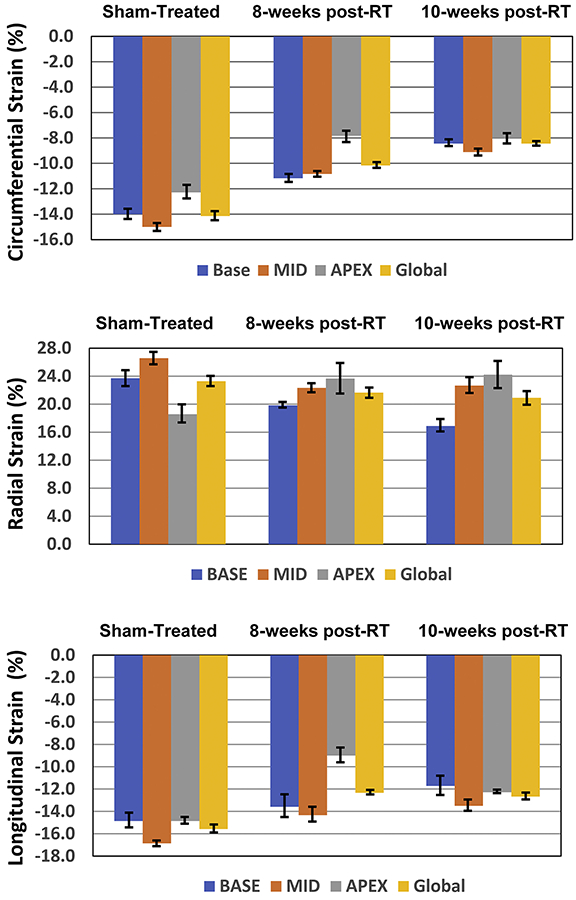
Segmental strain curves during the whole cardiac cycle in sham-treated, 8-weeks post-RT, and 10-weeks post-RT rats are shown in Figure 5. Despite normal global function, strain measurements showed reduced strain in the RT rats compared to non-irradiated controls. Furthermore, the curves show lack of synchrony for contraction of different segments at 10-weeks post-RT. Values for global, basal, mid-ventricular, and apical myocardial strain are shown in Table 2 and Figure 6, which demonstrate reduced strain post-RT with altered patterns between different myocardial segments.
Figure 5. Strain curves in sham-treated and RT rats demonstrate reduced strain and altered patterns post-RT.
Representative circumferential, radial, and longitudinal strain curves across different myocardial segments in the left ventricle throughout the cardiac cycle in sham-treated, 8-weeks, and 10-weeks post-RT rats. Color code is shown in the upper left corner of the left panels for mid-ventricular short-axis segments (1, anterior; 2, anteroseptal; 3, inferoseptal; 4, inferior; 5, inferolateral; 6, anterolateral) and 4-chamber long-axis segments (1, basal-lateral; 2, mid-lateral; 3, apical-lateral; 4, apical-septal; 5, mid-septal; 6, basal-septal). The strain curves show strain values throughout the whole cardiac cycle (20 heart phases), starting with time frame #1 immediately after the ECG R-wave, through end-systole at time frame #9 or #10 until end-diastole at time frame #20. Overall, peak strain worsens post-RT. Furthermore, the curves show lack of synchrony for contraction of different segments at 10-weeks post-RT.
Table-2.
Myocardial strain measurements in RT and control (sham-treated) rats at different ventricular levels and whole heart (global) demonstrate reduced strain post-RT.
| 8-weeks Sham- treated Controls |
8-weeks post-RT |
P value vs. control |
10-weeks post-RT |
P value vs. control |
|
|---|---|---|---|---|---|
| Circumferential-Global | −14.1±0.8 | −10.2±0.3 | 0.002 | −8.4±0.2 | < 0.001 |
| Circumferential-Base | −14.0±0.9 | −11.2±0.6 | 0.017 | −8.4±0.5 | < 0.001 |
| Circumferential-Mid | −15.0±0.7 | −10.8±0.3 | <0.001 | −9.1±0.5 | < 0.001 |
| Circumferential-Apex | −12.3±1.2 | −7.8±1.0 | 0.012 | −8.0±0.9 | 0.011 |
| Radial- Global | 23.3±1.5 | 21.7±1.5 | 0.270 | 20.9±2.0 | 0.201 |
| Radial-Base | 23.7±2.3 | 19.8±0.8 | 0.076 | 16.9±1.8 | 0.018 |
| Radial-Mid | 26.6±1.8 | 22.3±1.4 | 0.044 | 22.7±2.3 | 0.107 |
| Radial-Apex | 18.6±2.7 | 23.7±4.5 | 0.201 | 24.2±4.0 | 0.143 |
| Longitudinal - Global | −15.6±0.7 | −12.3±0.4 | 0.002 | −12.7±0.6 | 0.004 |
| Longitudinal - Base | −14.9±1.3 | −13.6±2.0 | 0.271 | −12±1.7 | 0.035 |
| Longitudinal - Mid | −16.9±0.5 | −14.3±1.3 | 0.094 | −14±1.0 | 0.059 |
| Longitudinal - Apex | −14.9±0.6 | −9.0±1.3 | 0.002 | −12±0.2 | 0.093 |
Values represent mean ± standard error of mean.
Figure 6: Strain measurements in RT and sham rats reveal early worsening in strain, especially in the circumferential direction, post-RT.
Compared to sham, circumferential strain changes occurred at the basal, mid-ventricular and apical levels (p<0.05 for all), especially at the lateral regions, which suggests that circumferential strain a sensitive marker of RT-induced cardiotoxicity.
Tissue Contractility Patterns Post-RT Are Affected by Location of Different Myocardial Segments
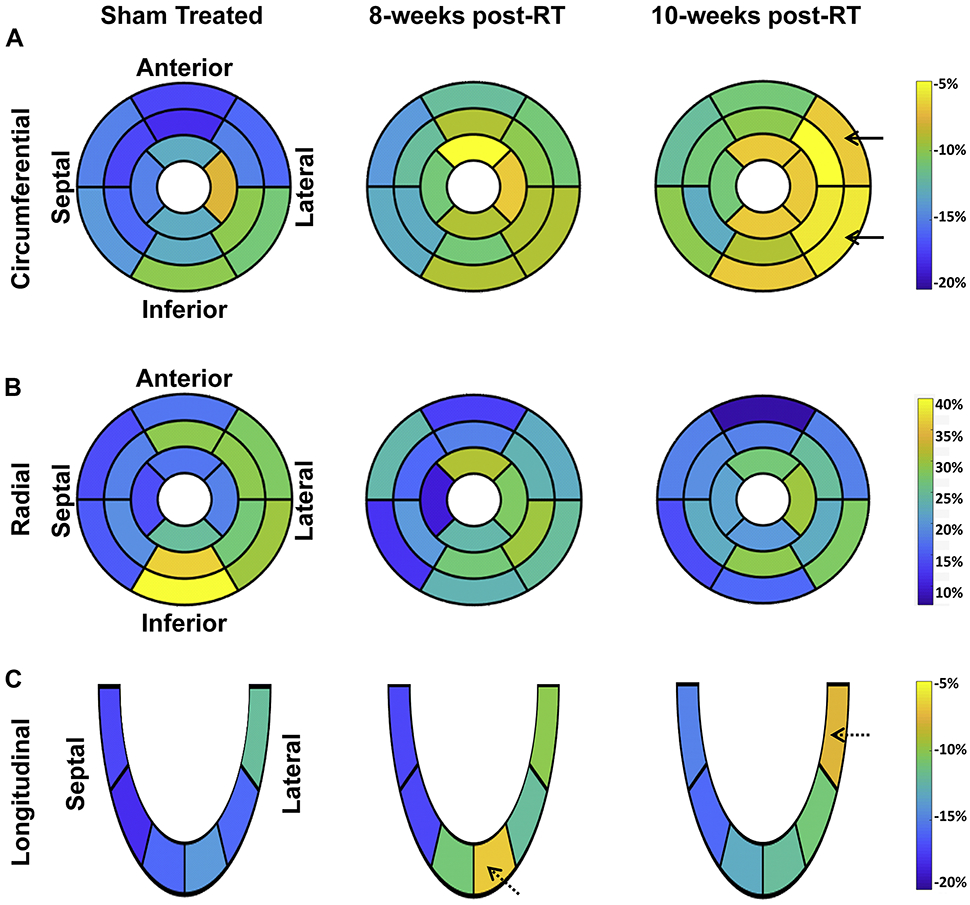
On a regional basis, different myocardial segments showed different temporal patterns of change in strain post-RT, as shown in Figure 7 and Table-2. For circumferential strain, most strain reductions between the sham-treated and 8-weeks post-RT rats occurred at the basal (anterior and anterolateral segments), mid-ventricular (all but the inferior segments), and apical (all but the lateral segments) levels (Figure 7a). The greatest reduction in circumferential strain at 10-weeks post-RT, compared to 8-weeks post-RT, occurred at the basal (all but the anterior segments) and mid-ventricular (anterolateral and inferolateral segments) levels. Although circumferential strain worsened between the 8-weeks post-RT and 10-weeks post-RT at the basal and mid-ventricular levels, it was mostly maintained at the apical level between these 2 timepoints.
Figure 7. Segmental strain distribution in RT and sham-treated rats demonstrates reduced strain post-RT.
Average segmental strain ((a) circumferential, (b) radial, and (c) longitudinal) in sham-treated, 8-weeks, and 10-weeks post-RT rats. The left-ventricle 17-segment model is used for presenting strain at the basal, mid-ventricular, and apical levels. Blue and yellow colors represent better and worse strain, respectively, in the circumferential and longitudinal directions, while color interpretation is the opposite for radial strain (blue and yellow colors represent worse and better strain, respectively). Overall, strain values are reduced post-RT, which occurs differently in different myocardial segments and strain dimensions. Greater changes in strain are seen in the lateral wall (solid arrows) versus the septum for circumferential strain. Longitudinal strain showed apical and basal strain reduction at 8-weeks and 10-weeks post-RT, respectively (dashed arrows).
For radial strain, most reductions between the non-irradiated and 8-weeks post-RT rats occurred at the basal (inferior and inferolateral), mid-ventricular (anterior, anterolateral, and inferior), and apical (septal only) levels (Figure 7b). Compared to sham, although radial strain decreased at the basal and mid-ventricular levels, it increased at the apical level. Most of the reductions in radial strain at 10-weeks post-RT, compared to 8-weeks post-RT, occurred at the basal (anterior and inferior), mid-ventricular (inferolateral only), and apical (anterior only) levels. Although radial strain decreased at the basal level, it was mostly maintained at the mid-ventricular and apical levels between 8 and 10 weeks.
For longitudinal strain, changes between the non-irradiated control and 8-weeks post-RT rats were qualitatively greater than the changes between 8-weeks and 10-weeks post-RT (Figure 7c). Most of the reductions between the non-irradiated and 8-weeks post-RT rats occurred at the apical level, while most of the worsening between 8-weeks and 10-weeks post-RT longitudinal strain occurred at the basal lateral regions (Figure 7c). Apical longitudinal strain at 10-weeks post-RT was worse than that in the non-irradiated rats, but improved compared to rats 8-weeks post-RT.
Tissue Displacement is Maintained Up to Ten-Weeks After Whole-Heart High-Dose RT
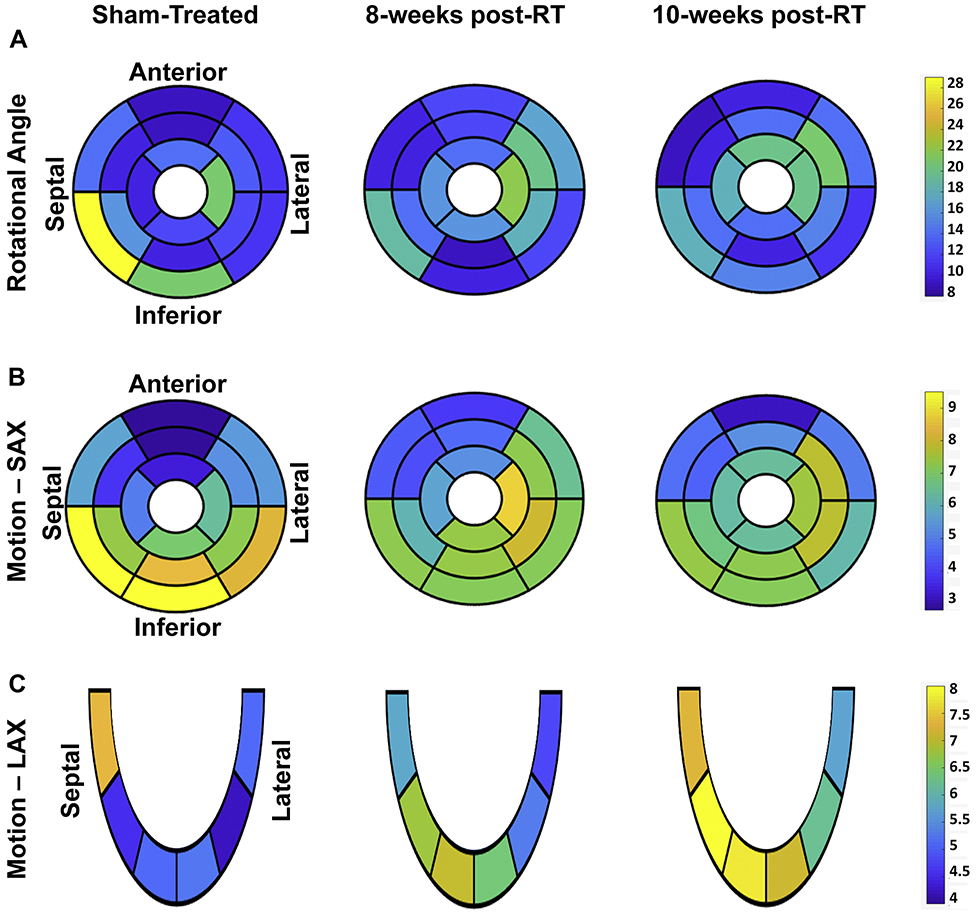
Tissue displacement analyses are shown in Figure 8 and Table 3. The rotation angle decreased at the basal level and increased at mid-ventricular and apical levels between the sham-treated and 8-weeks post-RT rats, while it was maintained at all levels between 8-weeks and 10-weeks post-RT (Figure 8a). Most of the reductions in rotation angle occurred between the non-irradiated control and 8-weeks post-RT rats at the basal inferior and inferolateral segments. Most of the increases in rotation angle between the non-irradiated and 8-weeks post-RT rats occurred at the basal (anterolateral segments), mid-ventricular (anterior, anterolateral, and inferolateral segments), and apical (septal segment) levels, while most of the increases in rotation angle between 8-weeks and 10-weeks post-RT occurred at the basal (inferior segments), and mid-ventricular and apical (anterior segments) levels (Figure 8a).
Figure 8. Segmental tissue displacement in RT and sham-treated rats demonstrate maintained tissue motion post-RT.
Segmental distribution of average myocardial tissue displacement ((a) rotation angle (°), (b) short-axis (SAX) motion (mm), and (c) long-axis (LAX) motion (mm)) in the left ventricle in sham-treated, 8-weeks, and 10-weeks post-RT rats. The left-ventricle 17-segment model is used for presenting values at basal, mid-ventricular, and apical levels. Note different tissue displacement values post-RT compared to the sham-treated rats, which differ based on location of the myocardial segment and type of displacement.
Table-3.
Myocardial displacement measurements in RT and control (sham-treated) rats at different ventricular levels and whole heart (global) demonstrate maintained, or even increased, tissue motion post-RT.
| 8-weeks Sham- treated Controls |
8-weeks post-RT |
P-value vs. control |
10-weeks post-RT |
P-value vs. control |
|
|---|---|---|---|---|---|
| Rot- Global | 14.1±1.0 | 14.4±0.7 | 0.524 | 14.7±0.7 | 0.393 |
| Rot-Base | 16.1±1.3 | 13.3±1.1 | 0.067 | 13.0±0.6 | 0.029 |
| Rot-Mid | 11.9±0.9 | 13.7±1.0 | 0.108 | 14.1±0.8 | 0.042 |
| Rot-Apex | 14.4±1.5 | 17.0±1.1 | 0.098 | 18.0±1.5 | 0.057 |
| SAX- Global | 6.1±0.4 | 6.3±0.3 | 0.444 | 6.2±0.3 | 0.559 |
| SAX-Base | 6.9±0.4 | 6.0±0.3 | 0.079 | 5.6±0.2 | 0.015 |
| SAX-Mid | 5.9±0.5 | 6.3±0.4 | 0.343 | 6.6±0.4 | 0.146 |
| SAX-Apex | 5.4±0.4 | 6.8±0.1 | 0.006 | 6.7±0.5 | 0.026 |
| LAX- Global | 5.2±0.3 | 6.0±0.7 | 0.196 | 7.0±0.5 | 0.005 |
| LAX-Base | 6.2±0.6 | 5.3±0.3 | 0.081 | 6.4±0.4 | 0.493 |
| LAX-Mid | 4.4±0.1 | 6.0±0.4 | 0.008 | 7.1±0.4 | < 0.001 |
| LAX-Apex | 5.1±0.1 | 6.7±0.2 | 0.015 | 7.4±0.1 | < 0.001 |
Myocardial rotation angle (Rot; °), short-axis motion (SAX; mm), and long-axis motion (LAX; mm) in non-irradiated control and RT rats at the base, mid-ventricular, and apical levels, and whole-heart global average (Global) value. Values represented as mean ± standard error of mean.
Changes in tissue motion showed different patterns in the SAX and LAX directions, as shown in Table 3. Changes in SAX motion between the non-irradiated control and 8-weeks post-RT rats were larger than measurement changes between 8-weeks and 10-weeks post-RT. Similar to the rotation angle’s temporal change pattern, SAX motion decreased at the basal level and increased at the mid-ventricular and apical levels between the sham-treated and 8-weeks post-RT rats, while it decreased, increased, and was maintained at the basal, mid-ventricular, and apical levels, respectively, between 8-weeks and 10-weeks post-RT (Figure 8b). On the other hand, global LAX motion showed a notable increase post-RT, as shown in Table 3. LAX motion decreased at the basal level and increased at mid-ventricular and apical levels between the sham-treated and 8-weeks post-RT rats, while it increased at all levels between 8-weeks and 10-weeks post-RT rats.
Myocardial T1/T2 Values Show Small Changes After High-Dose Cardiac RT
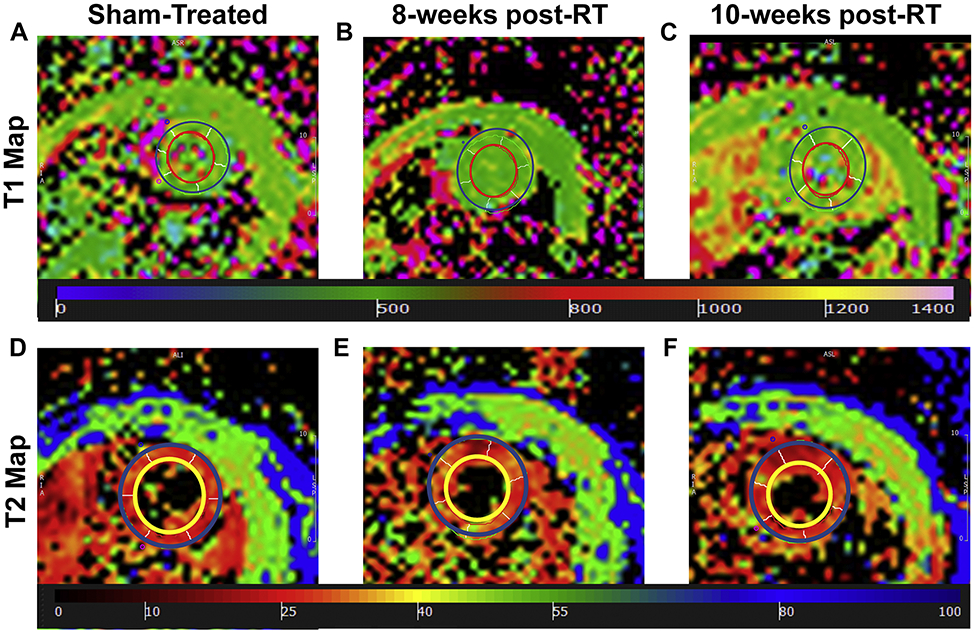
Figure 9 shows representative T1 and T2 maps. Apparent myocardium T1 values were 647±26ms, 619±17ms (P=0.405), and 655±15ms (P=0.796) in the sham-treated, 8-weeks, and 10-weeks post-RT rats, respectively. In general, T1 values were not significantly different between different rat groups, although T1 values at 10-weeks post-RT were closer to those in sham-treated rats than to the values at 8-weeks post-RT. Average myocardium T2 values were 12.7±0.3ms, 16.2±0.4ms (P=0.001), and 14.7±0.6ms (P=0.041) in the sham-treated, 8-weeks, and 10-weeks post-RT rats, respectively, where the T2 values post-RT were elevated, especially at 8-weeks post-RT, compared to T2 values in the sham-treated rats. The differences in the T2 values between 8-weeks and 10-weeks post-RT were not statistically significant.
Figure 9.
(a-c) Apparent T1 and (d-f) T2 maps of a mid-ventricular slice from (a,d) sham-treated, (b,d) 8-weeks post-RT, and (c,f) 10-weeks post-RT rats (T1 and T2 measurements in ms). Note slight difference in values (color) between sham and RT rats.
Discussion
In this study, we investigated the effect of RT on global and regional cardiac function and myocardial T1/T2 values using cardiac MRI in a rat model of high-dose localized whole-heart irradiation, and we also examined potential histological correlates of MRI changes seen after cardiac RT. Histologic analysis of the irradiated cardiac tissue correlates with increased changes seen in the LV lateral wall when compared to the septum, with increased vacuolization and necrosis seen in the lateral wall. In addition, changes in edema manifesting on cardiac MRI may be due to inflammation, as increased mast cell infiltration (Figure 1) (16) and T-cell infiltration (25) is seen after cardiac RT. To the best of our knowledge, this is the first study to investigate RT-induced cardiotoxicity effects on regional cardiac function and histologic changes associated with this dysfunction in such detail.
In this model, we utilized a single high dose of RT localized to the heart of SS female rats to provide proof-of-principle that cardiac MRI can identify RT-induced cardiac changes. This model of RT has previously been published (9,16), and the 24Gy single dose of RT has been shown to result in long-term cardiac damage similar to the multi-fraction regimen of 9Gy×5 (16,25). Due to the need for daily anesthesia for image-guided RT in our models, as well as the time required for these daily treatments, regimens that mirror clinical treatments lasting many weeks are not feasible in our small animal model. While the exact doses and fractionations used in our models are not received clinically to the whole heart, high doses of fractionated RT to regions of the heart do occur in subsets of patients receiving high doses of RT or RT with concurrent or sequential chemotherapy (5,26). In other situations, such as some malignancies more common in children and young adults, the whole heart still receives radiation exposure as part of their cancer treatment radiation prescription (27). In the current study, using high dose cardiac RT to the whole heart, we observed an increase in LV EF at 8-10 weeks post-RT (Figure 4). This is consistent with previously published results at 12-weeks post-RT, where LV EF is preserved initially and subsequently decreases by 20-weeks post-RT (16). The increase in EF post-RT was accompanied by significant cardiac hypertrophy. RV EF also increased post-RT, but this was not statistically significant. Similarly, although both LV and RV ESV decreased post-RT compared to non-irradiated rats, this decrease was significant only for the LV, and not for the RV. In this study, both LV and RV myocardial mass increased post-RT (Table 1). We hypothesize that this reflects cardiac remodeling to maintain global function and/or inflammation in the face of acute injury from RT. Previous work has demonstrated that cardiac hypertrophy in this model is dependent upon adaptive immunity, animal sex, and/or strain (16,25).
Despite normal EF, worsening in myocardial strain revealed subclinical cardiac dysfunction, where different strain components helped characterize the nature of these abnormal patterns (Table-2 and Figures 6 and 7). Interestingly, apical circumferential strain and both mid-ventricular and apical radial strain were maintained between 8-weeks and 10-weeks post-RT, and apical radial strain increased at 8-weeks post-RT compared to sham-treated rats. The changes in circumferential strain post-RT were more substantial than the changes in radial or longitudinal strain. Compared to sham, changes in circumferential strain occurred at the basal, mid-ventricular and apical levels, most of the changes in radial strain occurred at the mid-ventricular level, and most changes in longitudinal strain occurred at the apical level, with less substantial changes at the basal segments for all strain dimensions. Lateral myocardial segments showed significant changes in strain measurements at 10 weeks post-RT (Figure 7), which may be related to increased myocardial tissue vacuolization and necrosis in the lateral wall versus the interventricular septum in our animal model (Figure 2c,d). Although myocardial strain values worsened post-RT, the tissue displacement parameters showed non-significant increases post-RT, especially at mid-ventricular and apical levels, with LAX motion showing more increase post-RT versus SAX motion or rotation angle. This paradoxical increase in tissue motion post-RT may be due to ongoing remodeling to maintain global cardiac function despite the observed deterioration in different strain dimensions.
While rats were prescribed 24Gy to isocenter using 3 equally-weighted beams, due to differences in tissue density, anatomy, and other factors, the whole heart does not receive a uniform dose of 24Gy (16). Unfortunately, detailed dosimetric data for the 17 LV segments was not possible to obtain due to limitations with the CT-guided irradiator-obtained non-contrast CT imaging and planning software limitations. However, crude dosimetric analysis of a representative female rat treated with 24Gy of localized RT indicates that due to anatomy and beam arrangements, the inferior basal and inferior apical areas may receive higher doses than other surrounding areas (data not shown). Additional studies with improved methodologies will help to further define whether different segments of the heart are more sensitive to a given dose of irradiation.
The myocardial T1 and T2 values showed different patterns post-RT compared to sham-treatment. The changes in T1 values were non-significant; therefore, these changes could be due to measurement variability and limited sample size. The T2 values slightly increased at 8-weeks post-RT and then decreased at 10-weeks post-RT. T1 and T2 values have been used for the assessment of changes in tissue composition, e.g. fibrosis or generic myocardial tissue damage (T1 increase) and edema (T2 increase) (28), which may be part of the sub-acute and/or late cardiac responses to RT. Indeed, in this model of localized cardiac radiation in female SS rats, we have demonstrated increased mast cells (Figure 1) and T-cells, including CD8+ T-cells, infiltrating the heart 10-weeks after radiation (16,25). This increase in inflammation may be responsible for the increased T2 values seen after cardiac radiation. In addition, the vacuolization and tissue changes seen on H&E staining may account for T2 changes (29). The lack of significant changes in T1 values is consistent with the lack of significant increases in interstitial fibrosis at 10-weeks post-RT (Figure 3).
A number of rodent models, including ours, have shown overall preservation of function/EF initially after a high dose of cardiac RT (16, 30), with eventual decreased EF by 5-6 months after RT. A key finding in this study is the importance of myocardial strain as early markers of RT-induced subclinical cardiac dysfunction despite preserved EF. The observed more significant abnormalities in circumferential and longitudinal strain compared to radial strain may be attributed in part to cardiac remodeling and ventricular hypertrophy post-RT, which results in less changes in radial strain. Changes in radial strain may occur later after RT in this model, as previously shown (16).
This study demonstrates that myocardial segments with the greatest worsening in strain values were in the lateral region of the heart when compared to the septal region, even though there was not a notable difference in RT dose distribution between these areas. Histologic examination of the LV also demonstrates increased vacuolization in the LV lateral wall versus the septal region (Figure 2a-d). While it is possible that certain segments of the heart may be more sensitive to a given dose of RT, we cannot definitively conclude that from our findings, due to the lack of detailed segmental dosimetry data available for our studies. The use of small-animal cardiac MRI to assess subclinical changes after radiation can assist in elucidating the relative radiation sensitivity of different cardiac substructures. This will be especially helpful in determining regions where damage occurs after partial heart radiation, which is the clinical situation that occurs in most thoracic cancer patients who receive cardiac RT exposure.
A limitation of the current study is the acquisition of T1 and T2 maps only at the mid-ventricular level to reduce scan time to ~1 hour for animal welfare with anesthesia time. For the same reason, the MRI protocol used in this study did not include contrast-enhanced or flow imaging, which could have been used for assessing coronary artery, valvular or pericardial diseases. However, the strain imaging included in this study provided valuable information about regional cardiac function that showed to correlate with regions of myocardial ischemia and infarction and is affected in different cardiomyopathies, valvular heart diseases, and pericardial diseases (14). It should be noted that RV strain analysis was not feasible in the current study due to thin RV wall with respect to tag spacing. Another limitation is that the sham rats were imaged at 8-weeks post treatment, which should be taken in consideration when comparing results from the sham rats to those from the 10-weeks post-RT rats. It should be also noted that our model utilized rats that were not tumor-bearing, while patients exposed to cardiac radiation as part of their cancer treatment typically have intact tumors/tumor cells that are irradiated. However, in many situations, such as the majority of breast cancer patients treated with RT, the cancer cells present may be microscopic and/or non-detectable. Finally, the addition of even earlier timepoints, when cardiac function may be preserved but inflammatory changes may be occurring, may also be useful to shed insight into how T1 and T2 mapping may change after localized cardiac radiation.
In conclusion, regional cardiac imaging by cardiac MRI provides detailed information about the functional patterns post-RT and allows for the early detection of RT-induced cardiotoxicity before worsening in EF is evident. Our histologic studies support our MRI findings. Using these methods, quantitation of strain across different dimensions and segments allow for the detailed assessment of spatial and temporal progression of regional cardiac dysfunction post-RT. This knowledge is valuable for better understanding the segmental radiation effects on the heart, and with further study may allow for the early initiation of cardioprotective therapy with the potential to inform radiation treatment planning to reduce RT-induced cardiotoxicity.
Supplementary Material
Video-1. Long-axis cine MRI in a sham rat.
Video-2. Short-axis cine MRI in a sham rat.
Video-3. Long-axis cine MRI in an RT rat 10-weeks post-RT
Video-4. Short-axis cine MRI in an RT rat 10-weeks post-RT
CENTRAL ILLUSTRATION: Strain Measurements in Radiation Therapy and Sham Rats.
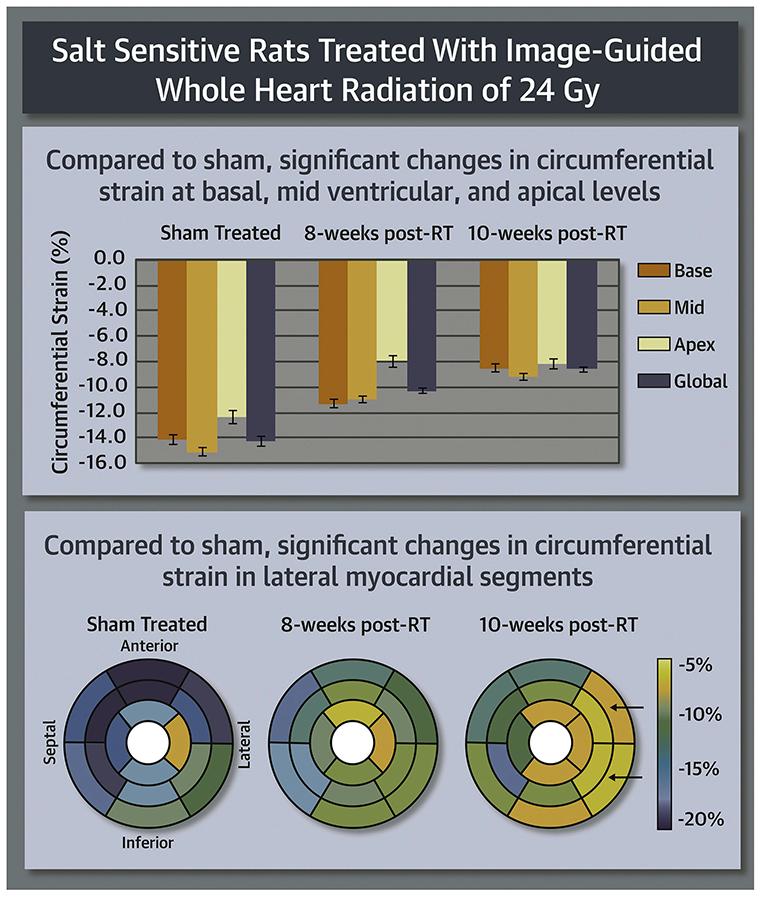
Ibrahim, E.-S.H. et al. J Am Coll Cardiol CardioOnc. 2021;3(1):113-30.
Clinical Perspectives.
Competency In Medical Knowledge: This study illustrates the capabilities of regional myocardial strain imaging by magnetic resonance imaging (MRI) for the early detection of radiation therapy (RT)-induced subclinical cardiac dysfunction before global cardiac function, as assessed by ejection fraction (EF), is affected. A worsening in strain was particularly notable at 10-weeks post RT, with greatest changes in circumferential at the basal, mid-ventricular and apical levels. Lateral myocardial segments showed significant changes in strain measurements at 10 weeks post-RT. Histologic changes supported the changes seen on MRI imaging.
Translational Outlook: With additional study, regional myocardial strain by MRI may inform how we treat and monitor cancer patients treated with radiation, and allow for the early detection of patients at risk for cardiotoxicity. Furthermore, identification of cardiac substructures that are vulnerable to RT injury could allow for optimized treatment planning. With further investigation, these data could also be used to build models for predicting cardiotoxicity risk in patients.
Acknowledgments
Funding Information: The study was funded by the Daniel M. Soref Charitable Trust, Center for Imaging Research, Medical College of Wisconsin, Milwaukee, Wisconsin, USA (E.H.I. and B.C.). This work was supported by NIH NHLBI 1R01HL147884, Bethesda, Maryland, USA (C.B.). Additional support was provided by the Mary Kay Foundation Award Grant No. 017-29, Dallas, Texas, USA (C.B.), Susan G. Komen® Grant CCR17483233, Dallas, Texas, USA (C.B.), the Nancy Laning Sobczak, PhD, Breast Cancer Research Award (C.B.), Milwaukee, Wisconsin, USA, the Medical College of Wisconsin Cancer Center, Milwaukee, Wisconsin, USA (C.B.), the Michael H. Keelan, Jr., MD, Research Foundation Grant (C.B.), Milwaukee, Wisconsin, USA, and the Cardiovascular Center at the Medical College of Wisconsin, Milwaukee, Wisconsin, USA (C.B.).
Abbreviations
- AHA
American Heart Association
- ED
end-diastolic
- EDV
end-diastolic volume
- EF
ejection fraction
- ES
end-systolic
- ESV
end-systolic volume
- FOV
field of view
- HF
heart failure
- IR
inversion recovery
- LAX
long-axis
- LV
left ventricle
- MESE
multi-echo spin-echo
- RT
radiation therapy
- SAX
short-axis
- SE
standard error
- SS
salt-sensitive
- SV
stroke volume
- TE
echo time
- TR
repetition time
Footnotes
Publisher's Disclaimer: This is a PDF file of an unedited manuscript that has been accepted for publication. As a service to our customers we are providing this early version of the manuscript. The manuscript will undergo copyediting, typesetting, and review of the resulting proof before it is published in its final form. Please note that during the production process errors may be discovered which could affect the content, and all legal disclaimers that apply to the journal pertain.
References
- 1.Darby SC, Ewertz M, McGale P, Bennet AM, Blom-Goldman U, Bronnum D, et al. Risk of ischemic heart disease in women after radiotherapy for breast cancer. N Engl J Med 2013;368(11):987–98. [DOI] [PubMed] [Google Scholar]
- 2.Donnellan E, Phelan D, McCarthy CP, Collier P, Desai M, Griffin B. Radiation-induced heart disease: A practical guide to diagnosis and management. Cleve Clin J Med 2016;83(12):914–22. [DOI] [PubMed] [Google Scholar]
- 3.Dess RT, Sun Y, Matuszak MM, Sun G, Soni PD, Bazzi L, et al. Cardiac Events After Radiation Therapy: Combined Analysis of Prospective Multicenter Trials for Locally Advanced Non-Small-Cell Lung Cancer. J Clin Oncol 2017;35(13):1395–402. [DOI] [PMC free article] [PubMed] [Google Scholar]
- 4.Wang K, Pearlstein KA, Patchett ND, Deal AM, Mavroidis P, Jensen BC, et al. Heart dosimetric analysis of three types of cardiac toxicity in patients treated on dose-escalation trials for Stage III non-small-cell lung cancer. Radiother Oncol 2017;125(2):293–300. [DOI] [PMC free article] [PubMed] [Google Scholar]
- 5.Speirs CK, DeWees TA, Rehman S, Molotievschi A, Velez MA, Mullen D, et al. Heart Dose Is an Independent Dosimetric Predictor of Overall Survival in Locally Advanced Non-Small Cell Lung Cancer. J Thorac Oncol 2017;12(2):293–301. [DOI] [PubMed] [Google Scholar]
- 6.Haque W, Verma V, Fakhreddine M, Butler EB, Teh BS, Simone CB 2nd. Trends in Cardiac Mortality in Patients With Locally Advanced Non-Small Cell Lung Cancer. Int J Radiat Oncol Biol Phys 2018;100(2):470–7. [DOI] [PubMed] [Google Scholar]
- 7.Bradley JD, Paulus R, Komaki R, Masters G, Blumenschein G, Schild S, et al. Standard-dose versus high-dose conformal radiotherapy with concurrent and consolidation carboplatin plus paclitaxel with or without cetuximab for patients with stage IIIA or IIIB non-small-cell lung cancer (RTOG 0617): a randomised, two-by-two factorial phase 3 study. Lancet Oncol 2015;16(2):187–99. [DOI] [PMC free article] [PubMed] [Google Scholar]
- 8.Zhang TW, Snir J, Boldt RG, Rodrigues GB, Louie AV, Gaede S, et al. Is the Importance of Heart Dose Overstated in the Treatment of Non-Small Cell Lung Cancer? A Systematic Review of the Literature. Int J Radiat Oncol Biol Phys 2019;104(3):582–9. [DOI] [PubMed] [Google Scholar]
- 9.Schlaak RA, SenthilKumar G, Boerma M, Bergom C. Advances in Preclinical Research Models of Radiation-Induced Cardiac Toxicity. Cancers (Basel) 2020;12(2). [DOI] [PMC free article] [PubMed] [Google Scholar]
- 10.Johnson CB, Sulpher J, Stadnick E. Evaluation, prevention and management of cancer therapy-induced cardiotoxicity: a contemporary approach for clinicians. Curr Opin Cardiol 2015;30(2):197–204. [DOI] [PubMed] [Google Scholar]
- 11.Higgins AY, O'Halloran TD, Chang JD. Chemotherapy-induced cardiomyopathy. Heart Fail Rev 2015;20(6):721–30. [DOI] [PubMed] [Google Scholar]
- 12.Kongbundansuk S, Hundley WG. Noninvasive imaging of cardiovascular injury related to the treatment of cancer. JACC Cardiovasc Imaging 2014;7(8):824–38. [DOI] [PMC free article] [PubMed] [Google Scholar]
- 13.Choi EY, Rosen BD, Fernandes VR, Yan RT, Yoneyama K, Donekal S, et al. Prognostic value of myocardial circumferential strain for incident heart failure and cardiovascular events in asymptomatic individuals: the Multi-Ethnic Study of Atherosclerosis. Eur Heart J 2013;34(30):2354–61. [DOI] [PMC free article] [PubMed] [Google Scholar]
- 14.Ibrahim EH. Heart Mechanics: Magnetic Resonance Imaging. . Boca Raton, FL: CRC Press; 2017. [Google Scholar]
- 15.Zagar TM, Cardinale DM, Marks LB. Breast cancer therapy-associated cardiovascular disease. Nat Rev Clin Oncol 2016;13(3):172–84. [DOI] [PubMed] [Google Scholar]
- 16.Schlaak RA, Frei A, Schottstaedt AM, Tsaih SW, Fish BL, Harmann L, et al. Mapping genetic modifiers of radiation-induced cardiotoxicity to rat chromosome 3. Am J Physiol Heart Circ Physiol 2019;316(6):H1267–H80. [DOI] [PMC free article] [PubMed] [Google Scholar]
- 17.Ibrahim el SH, Baruah D, Budde M, Rubenstein J, Frei A, Schlaak RA, et al. Optimized Cardiac Functional MRI of Small-Animal Models of Cancer Radiation Therapy. Magn Reson Imaging 2020;73(130–137). [DOI] [PMC free article] [PubMed] [Google Scholar]
- 18.Ibrahim EH, Stojanovska J, Hassanein A, Duvernoy C, Croisille P, Pop-Busui R, et al. Regional cardiac function analysis from tagged MRI images. Comparison of techniques: Harmonic-Phase (HARP) versus Sinusoidal-Modeling (SinMod) analysis. Magn Reson Imaging 2018;54:271–82. [DOI] [PMC free article] [PubMed] [Google Scholar]
- 19.Flister MJ, Hoffman MJ, Lemke A, Prisco SZ, Rudemiller N, O'Meara CC, et al. SH2B3 Is a Genetic Determinant of Cardiac Inflammation and Fibrosis. Circ Cardiovasc Genet 2015;8(2):294–304. [DOI] [PubMed] [Google Scholar]
- 20.Rybin VO, Grabham PW, Elouardighi H, Steinberg SF. Caveolae-associated proteins in cardiomyocytes: caveolin-2 expression and interactions with caveolin-3. Am J Physiol Heart Circ Physiol 2003;285(1):H325–32. [DOI] [PubMed] [Google Scholar]
- 21.Dedkov EI, Zheng W, Christensen LP, Weiss RM, Mahlberg-Gaudin F, Tomanek RJ. Preservation of coronary reserve by ivabradine-induced reduction in heart rate in infarcted rats is associated with decrease in perivascular collagen. Am J Physiol Heart Circ Physiol 2007;293(1):H590–8. [DOI] [PubMed] [Google Scholar]
- 22.Di Marco GS, Reuter S, Kentrup D, Ting L, Ting L, Grabner A, et al. Cardioprotective effect of calcineurin inhibition in an animal model of renal disease. Eur Heart J 2011;32(15):1935–45. [DOI] [PubMed] [Google Scholar]
- 23.Tirziu D, Chorianopoulos E, Moodie KL, Palac RT, Zhuang ZW, Tjwa M, et al. Myocardial hypertrophy in the absence of external stimuli is induced by angiogenesis in mice. J Clin Invest 2007; 117(11):3188–97. [DOI] [PMC free article] [PubMed] [Google Scholar]
- 24.Zheng W, Brown MD, Brock TA, Bjercke RJ, Tomanek RJ. Bradycardia-induced coronary angiogenesis is dependent on vascular endothelial growth factor. Circ Res 1999;85(2):192–8. [DOI] [PubMed] [Google Scholar]
- 25.Schlaak RA, Frei A, Fish BL, Harmann L, Gasperetti T, Pipke JL, et al. Acquired Immunity Is Not Essential for Radiation-Induced Heart Dysfunction but Exerts a Complex Impact on Injury. Cancers (Basel) 2020;12(4). [DOI] [PMC free article] [PubMed] [Google Scholar]
- 26.Reshko LB, Kalman NS, Hugo GD, Weiss E. Cardiac radiation dose distribution, cardiac events and mortality in early-stage lung cancer treated with stereotactic body radiation therapy (SBRT). J Thorac Dis 2018;10(4):2346–56. [DOI] [PMC free article] [PubMed] [Google Scholar]
- 27.Pieters RS, Wagner H, Baker S, Morano K, Ulin K, Cicchetti MG, et al. The impact of protocol assignment for older adolescents with hodgkin lymphoma. Front Oncol 2014;4:317. [DOI] [PMC free article] [PubMed] [Google Scholar]
- 28.Kim PK, Hong YJ, Im DJ, Suh YJ, Park CH, Kim JY, et al. Myocardial T1 and T2 Mapping: Techniques and Clinical Applications. Korean J Radiol 2017;18(1):113–31. [DOI] [PMC free article] [PubMed] [Google Scholar]
- 29.Galan-Arriola C, Lobo M, Vilchez-Tschischke JP, Lopez GJ, de Molina-Iracheta A, Perez-Martinez C, et al. Serial Magnetic Resonance Imaging to Identify Early Stages of Anthracycline-Induced Cardiotoxicity. J Am Coll Cardiol 2019;73(7):779–91. [DOI] [PubMed] [Google Scholar]
- 30.Mezzaroma E, Di X, Graves P, Toldo S, Van Tassell BW, Kannan H, et al. A mouse model of radiation-induced cardiomyopathy. Int J Cardiol 2012;156(2):231–3. [DOI] [PMC free article] [PubMed] [Google Scholar]
Associated Data
This section collects any data citations, data availability statements, or supplementary materials included in this article.
Supplementary Materials
Video-1. Long-axis cine MRI in a sham rat.
Video-2. Short-axis cine MRI in a sham rat.
Video-3. Long-axis cine MRI in an RT rat 10-weeks post-RT
Video-4. Short-axis cine MRI in an RT rat 10-weeks post-RT


