

Declines in US life expectancy since 2014 have rightly garnered widespread attention from researchers (e.g., Woolf & Schoomaker, 2019), the media (e.g., Christensen, 2019), and policymakers (e.g., H.R. 7035, 2018), while less attention has been paid to the dynamic trends in life expectancy across US states. Focusing only on trends at the national level obscures dramatically diverging trends across states. In recent years, some states experienced larger declines in life expectancy than did the country as a whole, while others experienced little change, and still others saw gains in life expectancy. Differences in life expectancy across states are now larger than ever recorded. Explaining these disparate trends can provide important clues about the structural conditions that cut short many American lives.
This article discusses the large and growing disparities in life expectancy across states and posits that the partisan polarization across state policy contexts has contributed in important ways to the disparate trends. It first describes differences in life expectancy and other key measures of population health across states. It then summarizes key changes in state policy contexts that occurred during that timeframe. These latter changes led to a polarization in state contexts with potentially profound consequences for people’s chances of living long and healthy lives. The article then highlights emerging evidence showing that states which have implemented more liberal policies in recent decades have made some of the largest gains in life expectancy and movement toward maximizing human longevity.
Total and Healthy Life Expectancy across US States
Life expectancy differs markedly across states. Table 1 lists five states with the highest and lowest life expectancies in 2017, the latest year for which state-level estimates are available. Life expectancy ranged from 74.6 years in West Virginia to 81.6 years in Hawaii, a full 7-year difference (United States Mortality Database, n.d.). If Hawaii and West Virginia were countries, the former would be ranked 23rd in the world in life expectancy and the latter would be ranked 93rd. The 7-year difference in life expectancy across US states is larger than that found across sex or race: the gap in life expectancy between men and women in 2017 was 5.0 years and the gap between whites and Blacks was 3.5 years (Arias & Xu, 2019).
Table 1.
Top Five and Bottom Five US States in Total and Healthy Life Expectancy
| Total Life Expectancy | Healthy Life Expectancy | |||
|---|---|---|---|---|
| Top 5 States | Top 5 States | |||
| Hawaii | 81.6 | Minnesota | 70.3 | |
| California | 81.2 | Hawaii | 70.1 | |
| New York | 81.0 | California | 69.9 | |
| Minnesota | 80.8 | Washington | 69.1 | |
| Connecticut | 80.7 | Vermont | 69.0 | |
| Bottom 5 States | Bottom 5 States | |||
| Arkansas | 75.7 | Mississippi | 64.9 | |
| Alabama | 75.4 | Alabama | 64.6 | |
| Kentucky | 75.3 | Oklahoma | 64.5 | |
| Mississippi | 74.8 | Kentucky | 64.3 | |
| West Virginia | 74.6 | West Virginia | 63.8 | |
| United States | 78.6 | 67.7 |
Source: Data on Total Life Expectancy are for 2017 and come from the United States Mortality Database (n.d.). Data on Healthy Life Expectancy are for 2016 and come from the US Burden of Disease Collaborators (2018).
The number of years that an individual can expect to live in good health, sometimes referred to as Healthy Life Expectancy (HLE), also differs across states. The right side of Table 1 lists five states with the highest and lowest HLE in 2016, the latest year for which HLE estimates are available for states. Healthy Life Expectancy ranged from 63.8 years in West Virginia to 70.3 years in Minnesota, a difference of 6.5 years (US Burden of Disease Collaborators, 2018). Residents of some states experience an earlier onset of health-related issues and a more rapid rise in the risk of experiencing those issues with age. For instance, a study of disability prevalence found that adults aged 25–34 years in Kentucky and Maine experience levels of disability similar to adults aged 35–44 in Michigan and Virginia and those aged 45–54 in North Dakota and Wisconsin (Montez, Hayward, & Wolf, 2017). Patterns of health and longevity are similar (although not identical) across states. As shown in Table 1, states in which people enjoy relatively long lives tend to be the same states in which people enjoy more years of those lives in good health.
Importantly, disparities in health and longevity across states are not simply a reflection of the demographic composition of states or migration across states. Although people who move across state lines tend to be healthier than those who do not move, the disparities persist even when limiting analyses to midlife and older adults residing in their state of birth (Montez et al, 2017, 2019). In fact, one study found that the disparities were somewhat larger, as people living in healthy states (e.g., Minnesota) throughout their lives accumulated a lifetime of health advantages while those in unhealthy states accumulated disadvantages (Montez et al, 2017).
Differences in life expectancy across states have not always been as stark as they are today. As shown in Figure 1, during the 1960s and 1970s, states became more similar in life expectancy until the early 1980s. The smallest recorded range in life expectancy across the 50 states was 4.9 years in 1984. Since that time, however, life expectancy has markedly diverged across states. The growing disparity has important consequences. It means that one’s chances for a long and healthy life are increasingly tied to their state of residence, which for most US-born adults is also their state of birth (Florida, 2019). It has also partly contributed to the deterioration of the US life expectancy ranking in international context (Wilmoth, Boe, & Barbieri, 2011).
Figure 1. Life Expectancy by US State, 1959 to 2017.
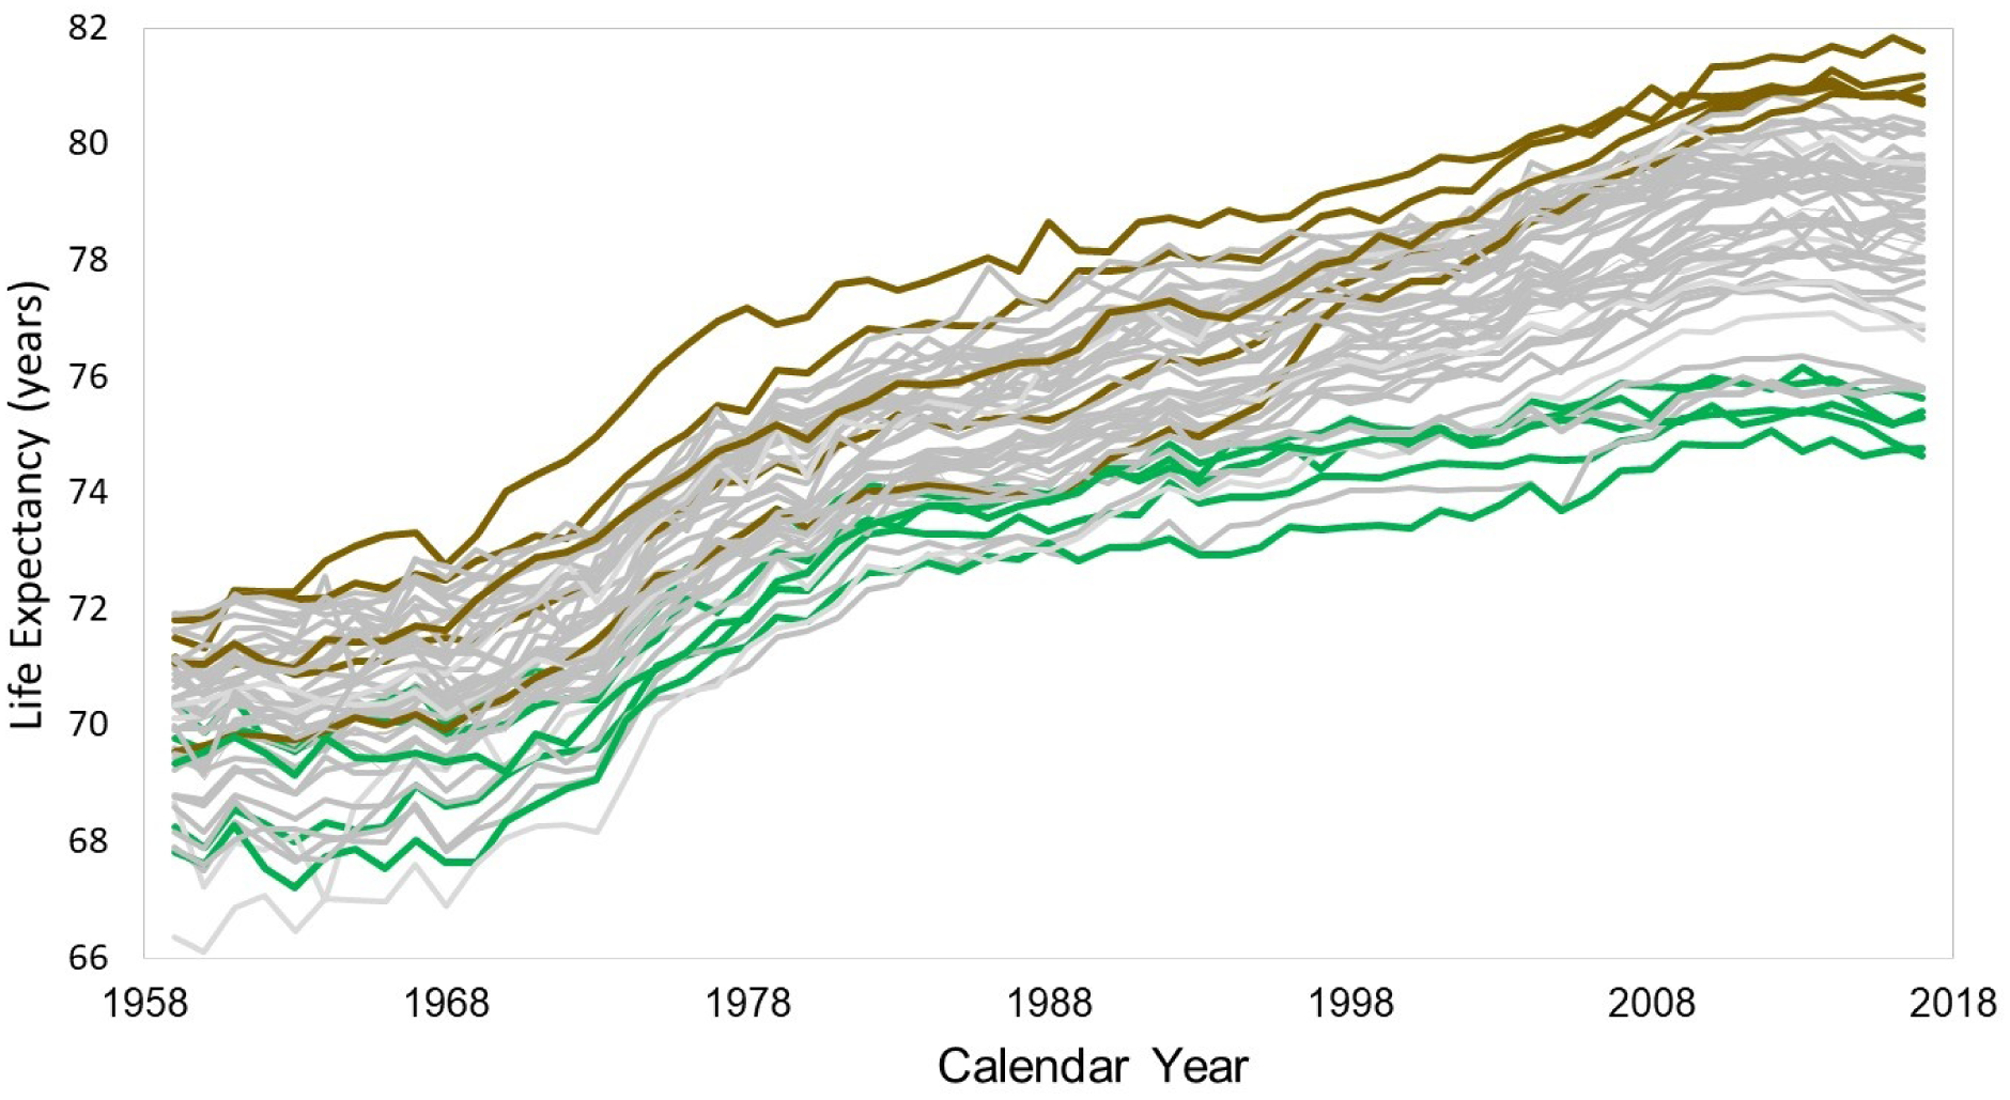
Source: Data come from the United States Mortality Database. The five states with the highest life expectancy in 2017 are identified by brown lines (Hawaii, California, New York, Minnesota, Connecticut). The five states with the lowest life expectancy in 2017 are identified by green lines (Arkansas, Alabama, Kentucky, Mississippi, West Virginia).
Polarizing Policy Contexts across US States
The large and growing differences in life expectancy across states since circa 1980 may partly reflect dramatic changes in their policy contexts during the same timeframe. This period brought a hyperpolarization in state policy contexts along partisan lines. The polarization can be tied to several forces, including devolution, preemption, and the emergence of powerful organizations that lobby state legislators for industry-friendly, socially-conservative policies (Montez, 2020a). Devolution aimed to shrink federal government and the safety net partly by transferring the design, regulatory, and fiscal responsibilities of certain policies and programs down to the states. State preemption laws, on the other hand, removed certain authorities from local governments. These laws have long been used to harmonize state and local policies or set a regulatory floor such as minimum wage. However, they have increasingly been used by (mainly conservative) state governments to stymie the progressive-leaning legislation of its cities (Briffault, 2018). As an example, half of the states now prohibit localities from raising the minimum wage above the state level (Huizar & Lathrop, 2019). The misuse of preemption has been brought out the shadows during the COVID-19 pandemic, as states such as Georgia blocked local efforts to protect the health of their constituents (Hauslohner & Willis, 2020).
Taken together, devolution and preemption consolidated considerable policymaking authority at the state level (Hertel-Fernandez, 2019). With this authority, states have made very different choices. Most implemented cohesive sets of either liberal-leaning or conservative-leaning policies. Indeed, after 1970, it became much easier to predict the political orientation of a state’s policy in one domain, such as Medicaid, taxes, or environmental protections, from its orientation on another domain (Montez 2020a). In sum, the policy context under which adults live in the United States is increasingly tied to their state of residence (Grumbach, 2018).
Partly as a consequence of the forces described above, some individuals today live in states that have created a policy context that invests in their well-being across the life span, while many others live in states that have either historically not invested or recently de-invested. As an illustration, Table 2 contrasts Minnesota and Mississippi in several key policies related to population health. States like Minnesota invest in human capital development, facilitate access to affordable medical care, provide an economic floor for working adults, and discourage risky behaviors, while states like Mississippi invest little in their residents’ well-being and even prohibit their localities from trying to do so. Partly as a consequence, residents of Minnesota enter older age having experienced a lifetime of health-promoting policies, in contrast to their counterparts in Mississippi. It in unsurprising then, that residents of Minnesota also enter older age with a much lower risk of disability than do their counterparts in Mississippi, as shown in Figure 2.
Table 2.
Comparison of Mississippi and Minnesota in Key Policies for Population Health
| Policy | Mississippi | Minnesota |
|---|---|---|
| Human Capital Development | ||
| Per pupil expenditure on primary and secondary education | $8,692 | $12,364 |
| Access to Affordable Medical Care | ||
| Medicaid income eligibility limits (% of federal poverty level) for: | ||
| Children | 214% | 288% |
| Parents in a family of three | 26% | 138% |
| Other adults | 0% | 138% |
| Among 36 states participating in ACA expansion | √ | |
| Health Behaviors | ||
| State excise taxes on a pack of cigarettes | $0.68 | $3.04 |
| Among 28 states with comprehensive smoke-free air laws | √ | |
| Number of firearm-related laws intended to reduce firearm injury | 5 | 41 |
| Economic Well-being | ||
| Minimum wage | nonea | $10.00/8.15b |
| Among 29 states offering supplemental Earned Income Tax Credit | √ | |
| State preempts local authority to improve working conditions on: | ||
| Minimum wage | √ | |
| Fair scheduling | ||
| Project labor agreements | √ | |
| Prevailing wage | ||
| Paid leave | √ | |
| Gig economy | √ |
Source: Table adapted from Montez (2020b). Data on education are from 2015–2016 (National Center for Education Statistics, 2018); data on firearms are from 2016 (Siegel et al., 2017); data on preemption are for 2018 (Economic Policy Institute, 2018); and data on Medicaid (Brooks et al., 2020), cigarette taxes (Campaign for Tobacco-free Kids, 2020) smoke-free laws (American Lung Association, 2020), minimum wage (National Conference of State Legislators, 2020), and EITC (Tax Credits for Workers and their Families, 2019) are from 2020.
Employers who are subject to the Fair Labor Standards Act are required to pay the federal minimum wage, which is currently $7.25 per hour.
The wage is $10.00 for large employers and $8.15 for others.
Figure 2. Age-specific Disability Prevalence in Mississippi and Minnesota.
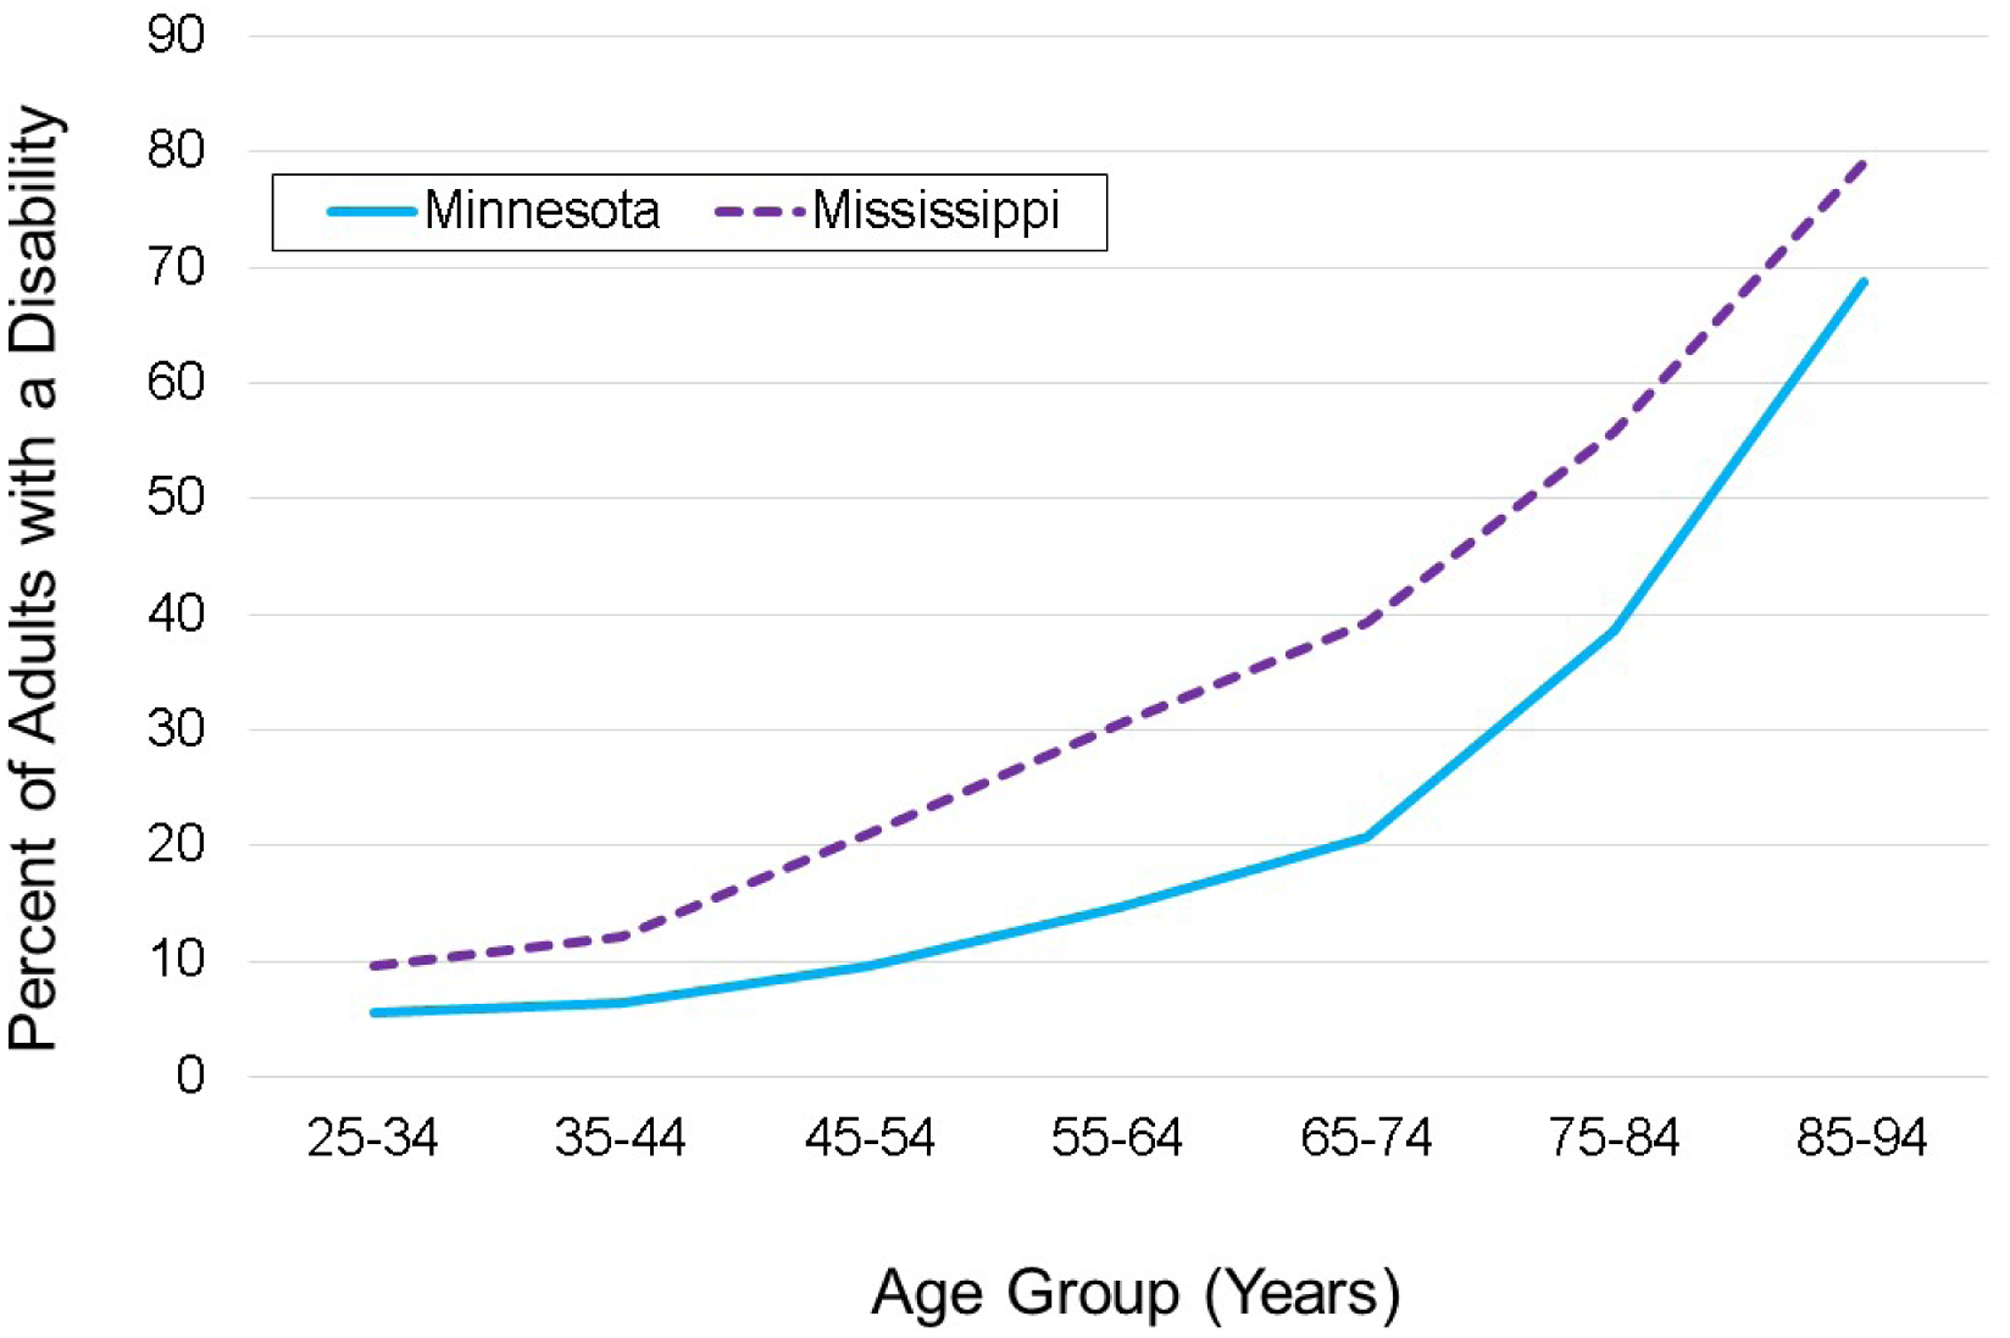
Source: Montez, Hayward, and Wolf (2017). Data are from the 2010–2014 American Community Survey. Estimates are age-standardized to the US population. Estimates include people who were born in their state of residence.
Using data from 2010–2014, Figure 2 shows that young adults in both states had a similarly low probability of disability. Among adults 25–34 years of age, there is just a 4.1 percentage point difference in disability between the states. Over the next few decades, the health-related advantages of living in Minnesota accumulate as do the disadvantages of living in Mississippi. By ages 65–74 years, there is a striking 18.5 percentage point difference in the probability of disability between the two states (20.7% in Minnesota, 39.2% in Mississippi). State policies relevant for older adults tend to maintain those differences well into old age. For instance, in 2016, Minnesota was ranked 5th in the country on Medicaid Long-Term Services and Support spending for older adults and those with disabilities ($546 per person) while Mississippi was ranked 19th ($340 per person) (Houser, Fox-Grage, & Ujvari 2018).
State Policy Contexts and Life Expectancy
Many studies find that state policies such as minimum wage, Medicaid, tobacco tax, and state supplemental Earned Income Tax Credit (EITC) affect population health. These studies generally employ statistical methods to isolate the causal effect of a single policy on population health. Although they have been invaluable for identifying causal effects, information on states’ overall policy context is needed to fully understand the role of states on population health.
Evidence is emerging that the changing policy contexts of states in recent decades may indeed have contributed to the worrisome trends in life expectancy at the national and state levels. One analysis examined the correlation between the emergence of the new type of state preemption laws and life expectancy in 2014 (Montez, 2018). It assigned a score to each state indicating the number of policy domains in which it had preempted localities from enacting progressive-leaning legislation. It considered a wide range of domains such as minimum wage, tobacco, and firearms. It found that the more policy domains in which a state preempted local authority to enact progressive legislation, the lower its life expectancy and the smaller its gains in life expectancy between 1980 and 2014.
Another study merged annual data on states’ life expectancies with annual data on 18 state policy domains from 1970 to 2014 (Montez et al., 2020). The domains include abortion, campaign finance, civil rights and liberties, criminal justice, marijuana, education, environment, gun control, health and welfare (e.g., Medicaid expansion), housing and transportation, immigration, private sector labor (e.g., disability insurance), public sector labor, LGBT rights, taxes (e.g., estate tax), voting, tobacco taxes, and the policymaking activity rate. Using statistical models that account for key characteristics of states and their populations, it found that several policy domains are strongly associated with life expectancy. For instance, it estimated that, within a given state, changing its labor policies from the most conservative to the most liberal configuration would increase life expectancy in the state by one year. It estimated a similar increase for policies on immigration, civil rights, the environment, and tobacco. The study also found that changes in state policies over time may have suppressed gains in US life expectancy during the 1980s and after 2010. Specifically, it estimated that the trend in US life expectancy after 2010 would have been 25% steeper among women and 13% steeper among men if state policy contexts had not changed in the manner they did.
State Policy Contexts and the Survival Curve
The studies above find that liberal policy contexts are generally associated with a longer average length of live, but they do not provide information on whether those contexts are also associated with a more compressed period of deaths toward the end of life. The relationship is not so straightforward: one state’s population could live longer on average than another state’s population but experience more variation in their ages of death. Variation in age of death is an important dimension of inequality in population health (Sasson, 2016). To glean insights into this issue, we compare survival curves for various types of policy contexts. A survival curve shows how a hypothetical birth cohort of 100,000 infants decreases in size as the cohort ages, due to deaths occurring at each age. If everyone in the cohort survived to a particular age and then died, the curve would appear as a horizontal line until the age everyone died and then a vertical line. The closer a survival curve is to this rectangular shape, the closer its population has maximized its longevity under current conditions (e.g., Fries, 1980; Wilmoth & Horiuchi, 1999).
The left panel of Figure 3 plots survival curves from 1970 for five states with the most conservative policy contexts (in orange) and five states with the most liberal contexts (in blue) in that year. The policy context scores are from Grumbach (2018), who defined liberal policies as those that expand economic regulation, protect marginalized groups, and restrict state power for punishing deviant behavior; conservative policies were defined as the opposite. In 1970, before hyperpolarization, survival curves for liberal states are fairly distinguishable from survival curves for conservative states until around 75 years of age. After that age, however, the chances of survival were fairly similar in both groups of states. The right panel of Figure 3 plots survival curves from 2017 for the most conservative and liberal states in that year. The curves for liberal states are even more distinguishable and have become more rectangular. Further, liberal states appear to have more survivors at each age group without crossing over at the oldest ages, suggesting the mortality advantage of liberal states in 2017 extends across the full life span.
Figure 3. Survival Curves for Most Liberal and Conservative States in 1970 and 2017.
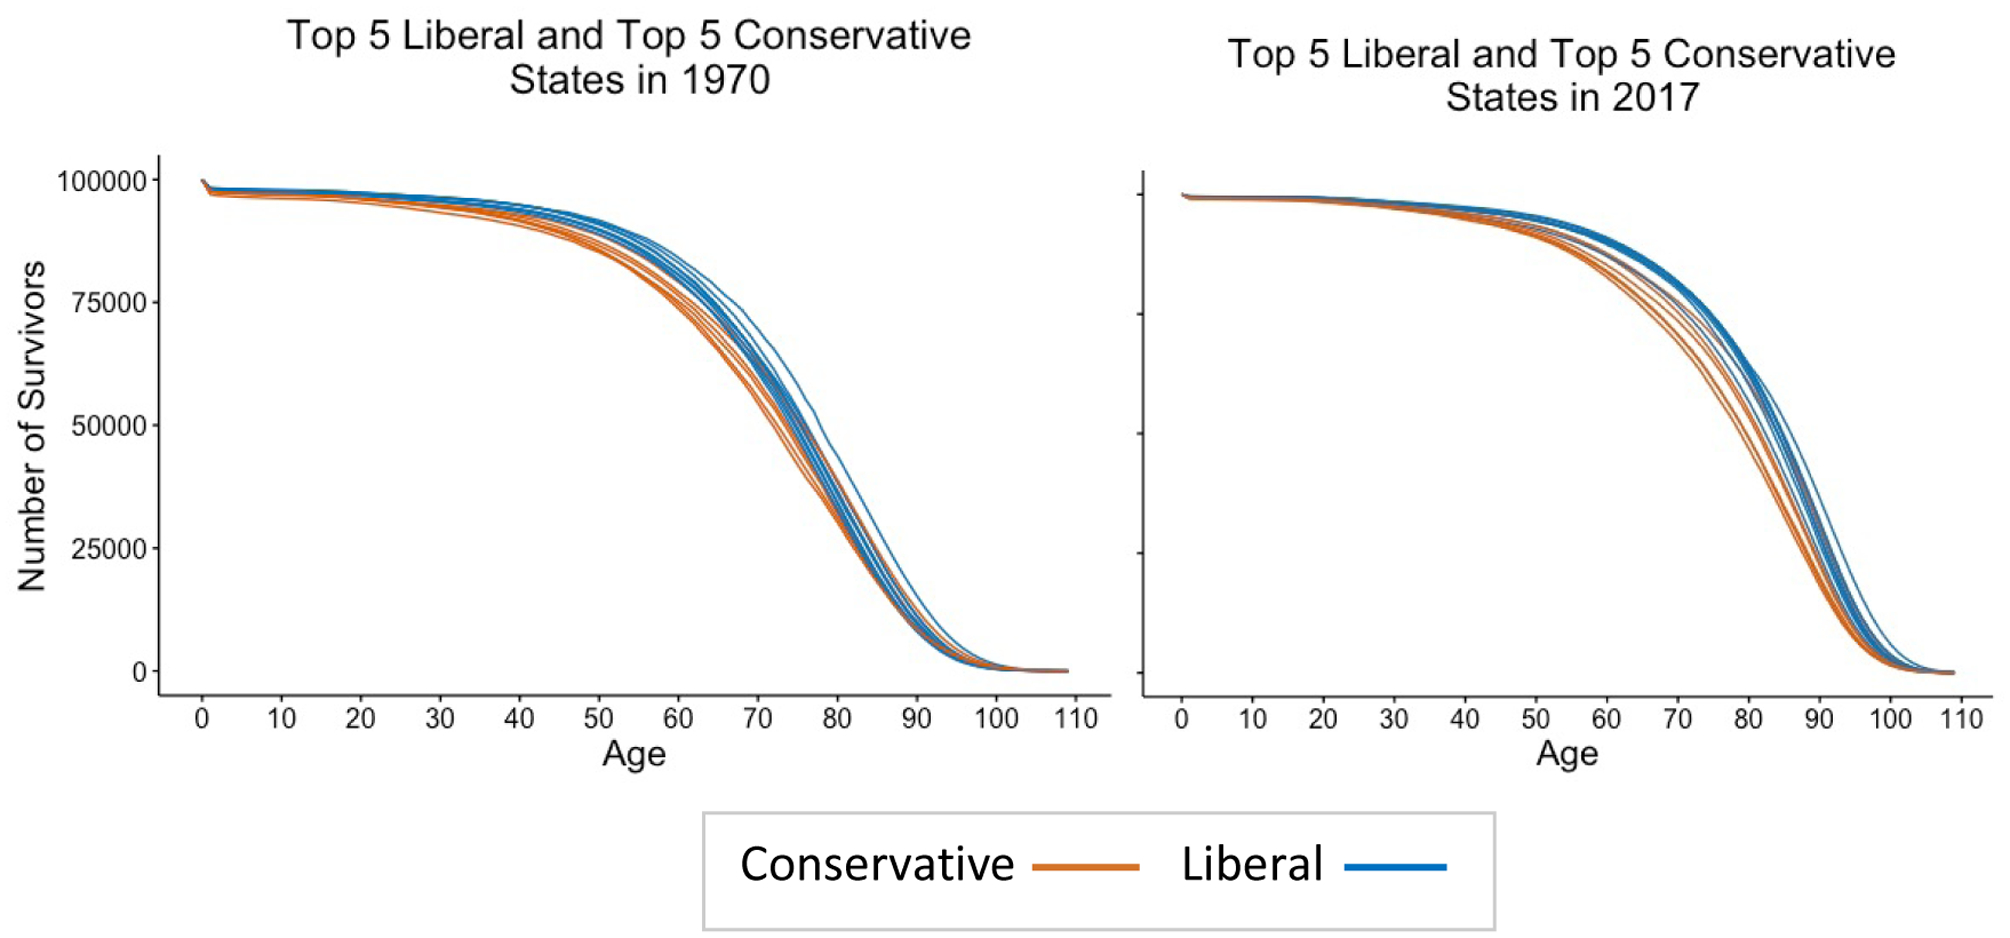
Source: Data on mortality are from the United States Mortality Database and data on state policy contexts are from Grumbach (2018). In 1970, conservative states are MS, SC, AL, GA, and FL; liberal states are NY, NJ, MA, HI, PA. In 2017, conservative states are MS, SC, AL, GA, and AR; and liberal states are NY, NJ, CA, RI, and CT. We use life table information from 1970 and 2017, but state policy scores from 1970 and 2014 (the latest year the scores are available).
The growing distinction in survival curves between liberal and conservative states that occurred between 1970 and 2017 stems largely from greater longevity gains among liberal states. This finding is illustrated in Figure 4, which includes two sets of curves. The left panel shows survival curves for five states whose policy contexts moved the most toward a conservative direction. The dashed curves represent 1970 and the solid ones represent 2017. The right panel shows survival curves for five states whose policy contexts moved the most toward a liberal direction. In both panels, the curves became more rectangular between 1970 and 2017. In all of these states, more survivors reach older ages in 2017 than in 1970. However, gains in survival during the 1970–2017 period differ between the two panels. States that moved toward a liberal policy context exhibited greater improvement in survival (as shown by the large gap between the 1970 curves and the 2017 curves in the right panel) than did states that moved toward a conservative context.
Figure 4: Survival Curves for States with Largest Movement in Policy Contexts, 1970–2017.
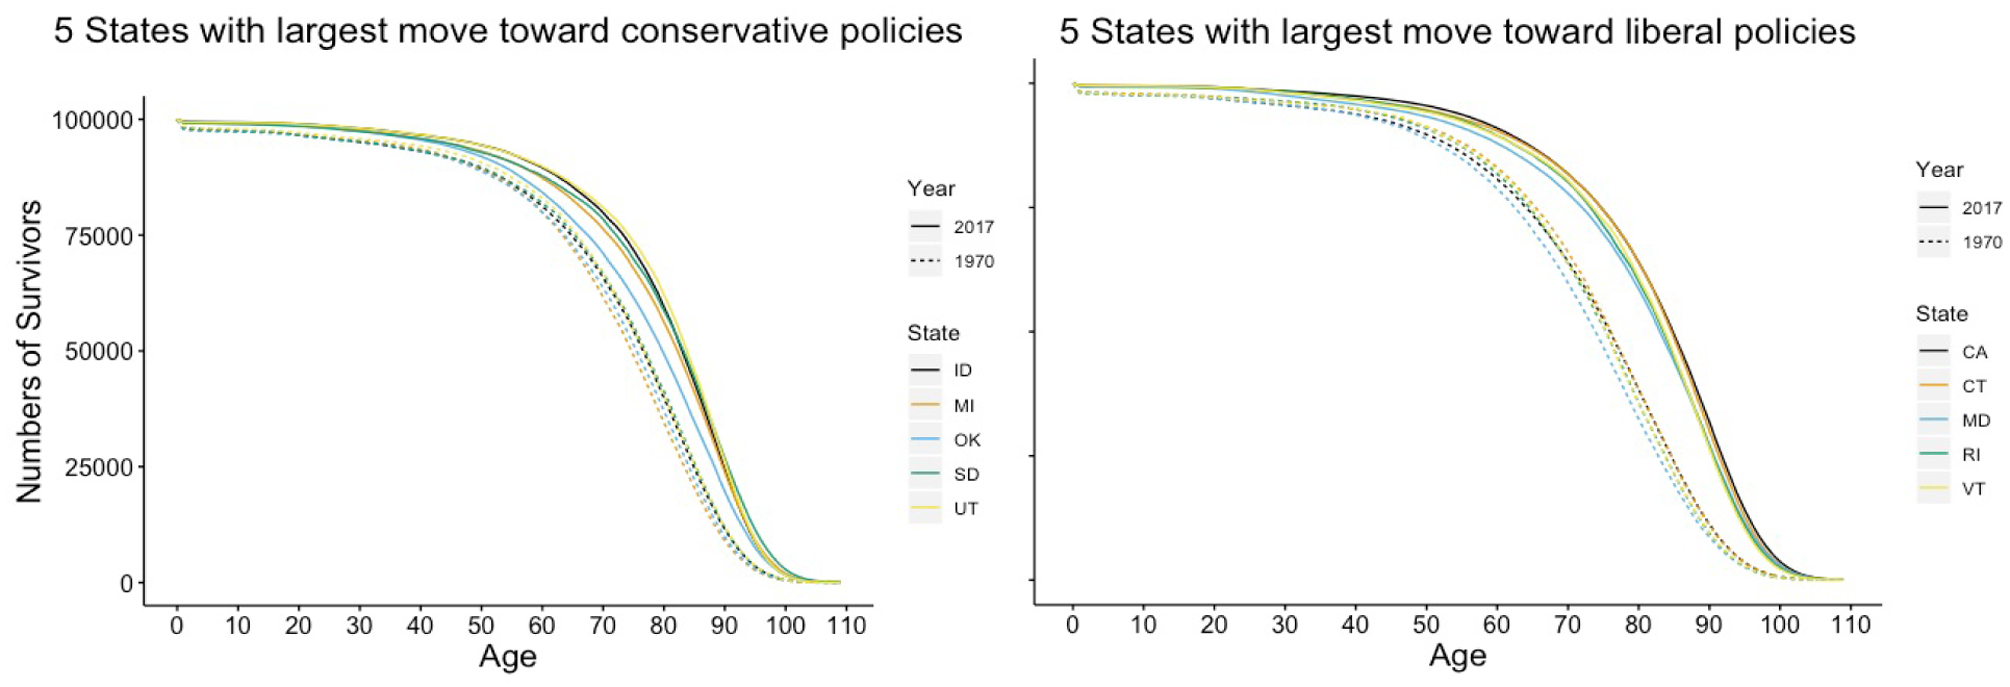
Source: Data on mortality are from the United States Mortality Database and data on state policy contexts are from Grumbach (2018). We use mortality data from 1970 and 2017, but state policy scores from 1970 and 2014 (the latest year the scores are available).
Conclusion
The policy contexts of US states have changed dramatically in recent decades and hyperpolarized. At the same time, life expectancy across states diverged. Emerging evidence suggests that these two trends are related. The chances that an individual can live a long and healthy life appear to be increasingly tied to their state of residence and the policy choices made by governors and state legislators. Without a concerted effort to reduce the disparities in health across states, they may continue to grow for the foreseeable future for at least three reasons. First, the long-term decline of interstate migration means that people increasingly enter old age having spent their entire lives within a single state (Frost, 2018). Second, their state of residence is increasingly characterized by a cohesive set of either liberal or conservative policies. Third, more recent cohorts will have spent more of their lives in the polarized post-1980 era than current cohorts of older adults.
Nevertheless, there is a positive take away from the evidence reviewed above. The stark disparities in population health and longevity across states today are not inevitable or immutable. States, such as Minnesota, Connecticut, and New York, that have moved toward a more liberal policy environment have continually made substantial increases in life expectancy since the 1980s. These states demonstrate that real gains in longevity are achievable through a policy environment that invests in its people across the entire life span.
Funding and Acknowledgements
This work was supported in part by the National Institute on Aging (R01AG055481, 2R24AG045061, T32AG000037, and P30AG066583). The authors thank members of the NIA-funded Network on Life Course Health Dynamics and Disparities in 21st Century America for helpful feedback on the topics presented in this article.
References
- American Lung Association. (2020). Smokefree Air Laws: Available at: https://www.lung.org/policy-advocacy/tobacco/smokefree-environments/smokefree-air-laws.
- Arias E, & Xu J (2019). United States Life Tables, 2017. Hyattsville, MD: National Vital Statistics Reports; vol 68 no 7. National Center for Health Statistics. [PubMed] [Google Scholar]
- Briffault R (2018). The challenge of the new preemption. Stanford Law Review, 70, 1995–2027. [Google Scholar]
- Brooks T, Roygardner L, Artiga S, Pham O, & Dolan R (2020). Medicaid and CHIP Eligibility, Enrollment, and Cost Sharing Policies as of January 2020: Findings from a 50-State Survey. Washington DC: The Henry J. Kaiser Family Foundation. http://files.kff.org/attachment/Report-Medicaid-and-CHIP-Eligibility,-Enrollment-and-Cost-Sharing-Policies-as-of-January-2020.pdf. See Tables 1 and 4. Accessed March 30, 2020. [Google Scholar]
- Campaign for Tobacco-free Kids. (2020). State Cigarette Excise Tax Rates and Rankings. Washington DC: https://www.tobaccofreekids.org/assets/factsheets/0097.pdf. Accessed March 30, 2020. [Google Scholar]
- Christensen J (2019). US Life Expectancy Is Still on the Decline. Here’s Why: CNN; (November 26, 2019). http://www.cnn.com/2019/11/26/health/us-life-expectancy-decline-study/index.html. Accessed April 16, 2020 [Google Scholar]
- Economic Policy Institute. (2018). Worker Rights Preemption in the US. Washington DC. https://www.epi.org/preemption-map/. Accessed March 30, 2020. [Google Scholar]
- Florida R (2019). The Geography of America’s Mobile and ‘Stuck,’ Mapped: Bloomberg CityLab; (March 5). [Google Scholar]
- Fries JF (1980). Aging, natural death, and the compression of morbidity. New England Journal of Medicine, 303(3), 130–135. [DOI] [PubMed] [Google Scholar]
- Frost R (2018). On the Road Again? After Long-term Decline, Interstate Migration may be Recovering. https://www.jchs.harvard.edu/blog/on-the-road-again-after-long-term-decline-interstate-migration-may-be-recovering/. Accessed April 10, 2020. [Google Scholar]
- Grumbach JM (2018). From backwaters to major policymakers: policy polarization in the states, 1970–2014. Perspectives on Politics, 16(2), 416–435. [Google Scholar]
- Hauslohner A, & Willis H (2020). Georgia bars municipalities from mandating masks as more states now require them. Washington Post; (July 16). [Google Scholar]
- Houser A, Fox-Grage W, & Ujvari K (2018). Across the States. Profiles of Long-term Services and Supports. AARP Public Policy Institute. https://www.aarp.org/content/dam/aarp/ppi/2018/08/across-the-states-profiles-of-long-term-services-and-supports-full-report.pdf. Accessed September 28, 2020. [Google Scholar]
- Huizar L, & Lathrop Y (2019). Fighting Wage Preemption: How Workers Have Lost Billions in Wages and How We Can Restore Local Democracy. National Employment Law Project; (July). https://www.nelp.org/publication/fighting-wage-preemption/. Accessed September 10, 2019. [Google Scholar]
- H.R. 7035. (2018). H.R.7035 - National Strategy To Increase Life Expectancy Act of 2018. www.congress.gov H.R. 7035. (2018). H.R.7035 - National Strategy To Increase Life Expectancy Act of 2018. www.congress.gov. [Google Scholar]
- Montez JK (2018). How state preemption laws prevent cities from taking steps to improve health and life expectancy. https://scholars.org/brief/how-state-preemption-laws-prevent-cities-taking-steps-improve-health-and-life-expectancy. Accessed September 8, 2019.
- Montez JK (2020a). Policy polarization and death in the United States. Temple Law Review, 92(4), 889–916. [PMC free article] [PubMed] [Google Scholar]
- Montez JK (2020b). US State Polarization, Policymaking Power, and Population Health. The Milbank Quarterly, in press. [DOI] [PMC free article] [PubMed] [Google Scholar]
- Montez JK, Beckfield J, Cooney JK, Grumbach JM, Hayward MD, Koytak HZ, et al. (2020). US state policies, politics, and life expectancy. The Milbank Quarterly, 98(3):668–699. [DOI] [PMC free article] [PubMed] [Google Scholar]
- Montez JK, Hayward MD, & Wolf DA (2017). Do U.S. states’ socioeconomic and policy contexts shape adult disability? Social Science & Medicine, 178, 115–126. [DOI] [PMC free article] [PubMed] [Google Scholar]
- Montez JK, Zajacova A, Hayward MD, Woolf SH, Chapman D, & Beckfield J 2019. “Educational Disparities in Adult Mortality across U.S. States: How Do They Differ and Have They Changed Since the Mid-1980s?” Demography 56(2):621–644. [DOI] [PMC free article] [PubMed] [Google Scholar]
- National Center for Education Statistics. (2018). Digest of Education Statistics. Table 236.65. Current expenditure per pupil in fall enrollment in public elementary and secondary schools, by state or jurisdiction: Selected years, 1969–70 through 2015–16. https://nces.ed.gov/programs/digest/d18/tables/dt18_236.65.asp. Accessed March 30, 2020.
- National Conference of State Legislators. (2020). State Minimum Wages, 2020 Minimum Wage by State. https://www.ncsl.org/research/labor-and-employment/state-minimum-wage-chart.aspx. Accessed March 30, 2020.
- Sasson I (2016). Trends in life expectancy and lifespan variation by educational attainment: United States, 1990–2010. Demography, 53(2), 269–293. [DOI] [PMC free article] [PubMed] [Google Scholar]
- Siegel M, Pahn M, Xuan Z, Ross CS, Galea S, Kalesan B, et al. (2017). Firearm-related laws in all 50 US states, 1991–2016. American Journal of Public Health, 107(7), 1122–1129. [DOI] [PMC free article] [PubMed] [Google Scholar]
- Tax Credits for Workers and their Families. (2019). http://www.taxcreditsforworkersandfamilies.org/state-tax-credits/. Accessed April 8, 2020.
- United States Mortality Database. (n.d.). https://usa.mortality.org/. Accessed April 15, 2020.
- US Burden of Disease Collaborators. (2018). The state of US health, 1990–2016. JAMA, 319(14), 1444–1472. [DOI] [PMC free article] [PubMed] [Google Scholar]
- Wilmoth JR, Boe C, & Barbieri M (2011). Geographic differences in life expectancy at age 50 in the United States compared with other high-income countries. In Crimmins EM, Preston SH & Cohen B (Eds.), International Differences in Mortality at Older Ages: Dimensions and Sources (pp. 333–366). Washington DC: The National Academies Press. [PubMed] [Google Scholar]
- Wilmoth JR, & Horiuchi S (1999). Rectangularization revisited: Variability of age at death within human populations. Demography, 36(4), 475–495. [PubMed] [Google Scholar]
- Woolf SH, & Schoomaker H (2019). Life expectancy and mortality rates in the United States, 1959–2017. JAMA, 322(20), 1996–2016 [DOI] [PMC free article] [PubMed] [Google Scholar]